|
|
市場調査レポート
商品コード
1515740
食肉・家禽加工機器の世界市場 2024-2028Global Meat and poultry processing equipment market 2024-2028 |
||||||

|
|||||||
カスタマイズ可能
|
|||||||

| 食肉・家禽加工機器の世界市場 2024-2028 |
|
出版日: 2024年06月11日
発行: TechNavio
ページ情報: 英文 174 Pages
納期: 即納可能
|

全表示
- 概要
- 図表
- 目次
食肉・家禽加工機器市場は、2023年から2028年にかけて53億3,610万米ドル、予測期間中のCAGRは5.4%で成長すると予測されています。
当レポートでは、食肉・家禽加工機器市場の全体的な分析、市場規模・予測、動向、成長促進要因、課題、約25のベンダーを網羅したベンダー分析などを掲載しています。
現在の市場シナリオ、最新動向と促進要因、市場環境全体に関する最新分析を提供しています。市場は、食肉・家禽製品に含まれる高い栄養源に対する意識の高まり、便利な食品に対する需要の高まり、組織小売業を通じた幅広いリーチによって牽引されています。
| 市場範囲 | |
|---|---|
| 基準年 | 2024 |
| 終了年 | 2028 |
| 予測期間 | 2024-2028 |
| 成長モメンタム | 加速 |
| 前年比2024年 | 5.12% |
| CAGR | 5.4% |
| 増分額 | 53億3,610万米ドル |
本調査では、食肉・家禽加工機器の技術的進歩が、今後数年間の食肉・家禽加工機器市場成長を牽引する主な要因の1つであるとしています。また、市場競合のM&A増加や自動化食肉・家禽加工機器への注目の高まりは、市場の大きな需要につながります。
目次
第1章 エグゼクティブサマリー
- 市場概要
第2章 市場情勢
- 市場エコシステム
- 市場の特徴
- バリューチェーン分析
第3章 市場規模の評価
- 市場の定義
- 市場セグメント分析
- 市場規模 2023
- 市場の見通し 2023-2028
第4章 市場規模実績
- 世界食肉・家禽加工機器市場 2018-2022
- 用途別セグメント分析 2018-2022
- 製品タイプ別セグメント分析 2018-2022
- 地域別セグメント分析 2018-2022
- 国別セグメント分析 2018-2022
第5章 ファイブフォース分析
- ファイブフォースの要約
- 買い手の交渉力
- 供給企業の交渉力
- 新規参入業者の脅威
- 代替品の脅威
- 競争の脅威
- 市況
第6章 市場セグメンテーション:用途別
- 市場セグメンテーション
- 比較:用途別
- 食肉加工機器:市場規模と予測 2023-2028
- 家禽加工設備:市場規模と予測 2023-2028
- 市場機会:用途別
第7章 市場セグメンテーション:製品タイプ別
- 市場セグメンテーション
- 比較:製品タイプ別
- 豚肉:市場規模と予測 2023-2028
- 牛肉:市場規模と予測 2023-2028
- チキン:市場規模と予測 2023-2028
- その他:市場規模と予測 2023-2028
- 市場機会:製品タイプ別
第8章 顧客情勢
- 顧客情勢の概要
第9章 地域別情勢
- 地域別セグメンテーション
- 地域別比較
- 北米:市場規模と予測 2023-2028
- アジア太平洋:市場規模と予測 2023-2028
- 欧州:市場規模と予測 2023-2028
- 南米:市場規模と予測 2023-2028
- 中東・アフリカ:市場規模と予測 2023-2028
- 米国:市場規模と予測 2023-2028
- 中国:市場規模と予測 2023-2028
- ブラジル:市場規模と予測 2023-2028
- ドイツ:市場規模と予測 2023-2028
- フランス:市場規模と予測 2023-2028
- 市場機会:地域情勢別
第10章 促進要因・課題・機会・抑制要因
- 市場促進要因
- 市場の課題
- 促進要因と課題の影響
- 市場の機会・抑制要因
第11章 競合情勢
- 概要
- 競合情勢
- 混乱の状況
- 業界のリスク
第12章 競合分析
- 企業プロファイル
- 企業の市場ポジショニング
- Admix Inc.
- Baader Global SE
- BAYLE SA
- Berkshire Hathaway Inc.
- Bettcher Industries Inc.
- Brower Equipment
- Buhler AG
- C.G MFG and DIST INC.
- Cantrell Gainco Group
- Duravant LLC
- GEA Group AG
- John Bean Technologies Corp.
- Marel Group
- The Middleby Corp.
- Tomra Systems ASA
第13章 付録
Exhibits:
- Exhibits1: Executive Summary - Chart on Market Overview
- Exhibits2: Executive Summary - Data Table on Market Overview
- Exhibits3: Executive Summary - Chart on Global Market Characteristics
- Exhibits4: Executive Summary - Chart on Market By Geographical Landscape
- Exhibits5: Executive Summary - Chart on Market Segmentation by Application
- Exhibits6: Executive Summary - Chart on Market Segmentation by Product Type
- Exhibits7: Executive Summary - Chart on Incremental Growth
- Exhibits8: Executive Summary - Data Table on Incremental Growth
- Exhibits9: Executive Summary - Chart on Company Market Positioning
- Exhibits10: Parent Market
- Exhibits11: Data Table on - Parent Market
- Exhibits12: Market characteristics analysis
- Exhibits13: Value Chain Analysis
- Exhibits14: Offerings of companies included in the market definition
- Exhibits15: Market segments
- Exhibits16: Chart on Global - Market size and forecast 2023-2028 ($ million)
- Exhibits17: Data Table on Global - Market size and forecast 2023-2028 ($ million)
- Exhibits18: Chart on Global Market: Year-over-year growth 2023-2028 (%)
- Exhibits19: Data Table on Global Market: Year-over-year growth 2023-2028 (%)
- Exhibits20: Historic Market Size - Data Table on Global Meat And Poultry Processing Equipment Market 2018 - 2022 ($ million)
- Exhibits21: Historic Market Size - Application Segment 2018 - 2022 ($ million)
- Exhibits22: Historic Market Size - Product Type Segment 2018 - 2022 ($ million)
- Exhibits23: Historic Market Size - Geography Segment 2018 - 2022 ($ million)
- Exhibits24: Historic Market Size - Country Segment 2018 - 2022 ($ million)
- Exhibits25: Five forces analysis - Comparison between 2023 and 2028
- Exhibits26: Bargaining power of buyers - Impact of key factors 2023 and 2028
- Exhibits27: Bargaining power of suppliers - Impact of key factors in 2023 and 2028
- Exhibits28: Threat of new entrants - Impact of key factors in 2023 and 2028
- Exhibits29: Threat of substitutes - Impact of key factors in 2023 and 2028
- Exhibits30: Threat of rivalry - Impact of key factors in 2023 and 2028
- Exhibits31: Chart on Market condition - Five forces 2023 and 2028
- Exhibits32: Chart on Application - Market share 2023-2028 (%)
- Exhibits33: Data Table on Application - Market share 2023-2028 (%)
- Exhibits34: Chart on Comparison by Application
- Exhibits35: Data Table on Comparison by Application
- Exhibits36: Chart on Meat processing equipment - Market size and forecast 2023-2028 ($ million)
- Exhibits37: Data Table on Meat processing equipment - Market size and forecast 2023-2028 ($ million)
- Exhibits38: Chart on Meat processing equipment - Year-over-year growth 2023-2028 (%)
- Exhibits39: Data Table on Meat processing equipment - Year-over-year growth 2023-2028 (%)
- Exhibits40: Chart on Poultry processing equipment - Market size and forecast 2023-2028 ($ million)
- Exhibits41: Data Table on Poultry processing equipment - Market size and forecast 2023-2028 ($ million)
- Exhibits42: Chart on Poultry processing equipment - Year-over-year growth 2023-2028 (%)
- Exhibits43: Data Table on Poultry processing equipment - Year-over-year growth 2023-2028 (%)
- Exhibits44: Market opportunity by Application ($ million)
- Exhibits45: Data Table on Market opportunity by Application ($ million)
- Exhibits46: Chart on Product Type - Market share 2023-2028 (%)
- Exhibits47: Data Table on Product Type - Market share 2023-2028 (%)
- Exhibits48: Chart on Comparison by Product Type
- Exhibits49: Data Table on Comparison by Product Type
- Exhibits50: Chart on Pork - Market size and forecast 2023-2028 ($ million)
- Exhibits51: Data Table on Pork - Market size and forecast 2023-2028 ($ million)
- Exhibits52: Chart on Pork - Year-over-year growth 2023-2028 (%)
- Exhibits53: Data Table on Pork - Year-over-year growth 2023-2028 (%)
- Exhibits54: Chart on Beef - Market size and forecast 2023-2028 ($ million)
- Exhibits55: Data Table on Beef - Market size and forecast 2023-2028 ($ million)
- Exhibits56: Chart on Beef - Year-over-year growth 2023-2028 (%)
- Exhibits57: Data Table on Beef - Year-over-year growth 2023-2028 (%)
- Exhibits58: Chart on Chicken - Market size and forecast 2023-2028 ($ million)
- Exhibits59: Data Table on Chicken - Market size and forecast 2023-2028 ($ million)
- Exhibits60: Chart on Chicken - Year-over-year growth 2023-2028 (%)
- Exhibits61: Data Table on Chicken - Year-over-year growth 2023-2028 (%)
- Exhibits62: Chart on Others - Market size and forecast 2023-2028 ($ million)
- Exhibits63: Data Table on Others - Market size and forecast 2023-2028 ($ million)
- Exhibits64: Chart on Others - Year-over-year growth 2023-2028 (%)
- Exhibits65: Data Table on Others - Year-over-year growth 2023-2028 (%)
- Exhibits66: Market opportunity by Product Type ($ million)
- Exhibits67: Data Table on Market opportunity by Product Type ($ million)
- Exhibits68: Analysis of price sensitivity, lifecycle, customer purchase basket, adoption rates, and purchase criteria
- Exhibits69: Chart on Market share By Geographical Landscape 2023-2028 (%)
- Exhibits70: Data Table on Market share By Geographical Landscape 2023-2028 (%)
- Exhibits71: Chart on Geographic comparison
- Exhibits72: Data Table on Geographic comparison
- Exhibits73: Chart on North America - Market size and forecast 2023-2028 ($ million)
- Exhibits74: Data Table on North America - Market size and forecast 2023-2028 ($ million)
- Exhibits75: Chart on North America - Year-over-year growth 2023-2028 (%)
- Exhibits76: Data Table on North America - Year-over-year growth 2023-2028 (%)
- Exhibits77: Chart on APAC - Market size and forecast 2023-2028 ($ million)
- Exhibits78: Data Table on APAC - Market size and forecast 2023-2028 ($ million)
- Exhibits79: Chart on APAC - Year-over-year growth 2023-2028 (%)
- Exhibits80: Data Table on APAC - Year-over-year growth 2023-2028 (%)
- Exhibits81: Chart on Europe - Market size and forecast 2023-2028 ($ million)
- Exhibits82: Data Table on Europe - Market size and forecast 2023-2028 ($ million)
- Exhibits83: Chart on Europe - Year-over-year growth 2023-2028 (%)
- Exhibits84: Data Table on Europe - Year-over-year growth 2023-2028 (%)
- Exhibits85: Chart on South America - Market size and forecast 2023-2028 ($ million)
- Exhibits86: Data Table on South America - Market size and forecast 2023-2028 ($ million)
- Exhibits87: Chart on South America - Year-over-year growth 2023-2028 (%)
- Exhibits88: Data Table on South America - Year-over-year growth 2023-2028 (%)
- Exhibits89: Chart on Middle East and Africa - Market size and forecast 2023-2028 ($ million)
- Exhibits90: Data Table on Middle East and Africa - Market size and forecast 2023-2028 ($ million)
- Exhibits91: Chart on Middle East and Africa - Year-over-year growth 2023-2028 (%)
- Exhibits92: Data Table on Middle East and Africa - Year-over-year growth 2023-2028 (%)
- Exhibits93: Chart on US - Market size and forecast 2023-2028 ($ million)
- Exhibits94: Data Table on US - Market size and forecast 2023-2028 ($ million)
- Exhibits95: Chart on US - Year-over-year growth 2023-2028 (%)
- Exhibits96: Data Table on US - Year-over-year growth 2023-2028 (%)
- Exhibits97: Chart on China - Market size and forecast 2023-2028 ($ million)
- Exhibits98: Data Table on China - Market size and forecast 2023-2028 ($ million)
- Exhibits99: Chart on China - Year-over-year growth 2023-2028 (%)
- Exhibits100: Data Table on China - Year-over-year growth 2023-2028 (%)
- Exhibits101: Chart on Brazil - Market size and forecast 2023-2028 ($ million)
- Exhibits102: Data Table on Brazil - Market size and forecast 2023-2028 ($ million)
- Exhibits103: Chart on Brazil - Year-over-year growth 2023-2028 (%)
- Exhibits104: Data Table on Brazil - Year-over-year growth 2023-2028 (%)
- Exhibits105: Chart on Germany - Market size and forecast 2023-2028 ($ million)
- Exhibits106: Data Table on Germany - Market size and forecast 2023-2028 ($ million)
- Exhibits107: Chart on Germany - Year-over-year growth 2023-2028 (%)
- Exhibits108: Data Table on Germany - Year-over-year growth 2023-2028 (%)
- Exhibits109: Chart on France - Market size and forecast 2023-2028 ($ million)
- Exhibits110: Data Table on France - Market size and forecast 2023-2028 ($ million)
- Exhibits111: Chart on France - Year-over-year growth 2023-2028 (%)
- Exhibits112: Data Table on France - Year-over-year growth 2023-2028 (%)
- Exhibits113: Market opportunity By Geographical Landscape ($ million)
- Exhibits114: Data Tables on Market opportunity By Geographical Landscape ($ million)
- Exhibits115: Impact of drivers and challenges in 2023 and 2028
- Exhibits116: Overview on criticality of inputs and factors of differentiation
- Exhibits117: Overview on factors of disruption
- Exhibits118: Impact of key risks on business
- Exhibits119: Companies covered
- Exhibits120: Matrix on companies position and classification
- Exhibits121: Admix Inc. - Overview
- Exhibits122: Admix Inc. - Product / Service
- Exhibits123: Admix Inc. - Key offerings
- Exhibits124: Baader Global SE - Overview
- Exhibits125: Baader Global SE - Product / Service
- Exhibits126: Baader Global SE - Key offerings
- Exhibits127: BAYLE SA - Overview
- Exhibits128: BAYLE SA - Product / Service
- Exhibits129: BAYLE SA - Key offerings
- Exhibits130: Berkshire Hathaway Inc. - Overview
- Exhibits131: Berkshire Hathaway Inc. - Business segments
- Exhibits132: Berkshire Hathaway Inc. - Key news
- Exhibits133: Berkshire Hathaway Inc. - Key offerings
- Exhibits134: Berkshire Hathaway Inc. - Segment focus
- Exhibits135: Bettcher Industries Inc. - Overview
- Exhibits136: Bettcher Industries Inc. - Product / Service
- Exhibits137: Bettcher Industries Inc. - Key offerings
- Exhibits138: Brower Equipment - Overview
- Exhibits139: Brower Equipment - Product / Service
- Exhibits140: Brower Equipment - Key offerings
- Exhibits141: Buhler AG - Overview
- Exhibits142: Buhler AG - Business segments
- Exhibits143: Buhler AG - Key news
- Exhibits144: Buhler AG - Key offerings
- Exhibits145: Buhler AG - Segment focus
- Exhibits146: C.G MFG and DIST INC. - Overview
- Exhibits147: C.G MFG and DIST INC. - Product / Service
- Exhibits148: C.G MFG and DIST INC. - Key offerings
- Exhibits149: Cantrell Gainco Group - Overview
- Exhibits150: Cantrell Gainco Group - Product / Service
- Exhibits151: Cantrell Gainco Group - Key offerings
- Exhibits152: Duravant LLC - Overview
- Exhibits153: Duravant LLC - Product / Service
- Exhibits154: Duravant LLC - Key news
- Exhibits155: Duravant LLC - Key offerings
- Exhibits156: GEA Group AG - Overview
- Exhibits157: GEA Group AG - Business segments
- Exhibits158: GEA Group AG - Key news
- Exhibits159: GEA Group AG - Key offerings
- Exhibits160: GEA Group AG - Segment focus
- Exhibits161: John Bean Technologies Corp. - Overview
- Exhibits162: John Bean Technologies Corp. - Business segments
- Exhibits163: John Bean Technologies Corp. - Key news
- Exhibits164: John Bean Technologies Corp. - Key offerings
- Exhibits165: John Bean Technologies Corp. - Segment focus
- Exhibits166: Marel Group - Overview
- Exhibits167: Marel Group - Business segments
- Exhibits168: Marel Group - Key news
- Exhibits169: Marel Group - Key offerings
- Exhibits170: Marel Group - Segment focus
- Exhibits171: The Middleby Corp. - Overview
- Exhibits172: The Middleby Corp. - Business segments
- Exhibits173: The Middleby Corp. - Key offerings
- Exhibits174: The Middleby Corp. - Segment focus
- Exhibits175: Tomra Systems ASA - Overview
- Exhibits176: Tomra Systems ASA - Business segments
- Exhibits177: Tomra Systems ASA - Key news
- Exhibits178: Tomra Systems ASA - Key offerings
- Exhibits179: Tomra Systems ASA - Segment focus
- Exhibits180: Inclusions checklist
- Exhibits181: Exclusions checklist
- Exhibits182: Currency conversion rates for US$
- Exhibits183: Research methodology
- Exhibits184: Information sources
- Exhibits185: Data validation
- Exhibits186: Validation techniques employed for market sizing
- Exhibits187: Data synthesis
- Exhibits188: 360 degree market analysis
- Exhibits189: List of abbreviations
The meat and poultry processing equipment market is forecasted to grow by USD 5336.1 mn during 2023-2028, accelerating at a CAGR of 5.4% during the forecast period. The report on the meat and poultry processing equipment market provides a holistic analysis, market size and forecast, trends, growth drivers, and challenges, as well as vendor analysis covering around 25 vendors.
The report offers an up-to-date analysis regarding the current market scenario, the latest trends and drivers, and the overall market environment. The market is driven by rising awareness of high sources of nutrition in meat and poultry products, growing demand for convenient food products, and wider reach through organized retailing.
Technavio's meat and poultry processing equipment market is segmented as below:
| Market Scope | |
|---|---|
| Base Year | 2024 |
| End Year | 2028 |
| Series Year | 2024-2028 |
| Growth Momentum | Accelerate |
| YOY 2024 | 5.12% |
| CAGR | 5.4% |
| Incremental Value | $5336.1mn |
ByApplication
- Meat processing equipment
- Poultry processing equipment
ByProduct Type
- Pork
- Beef
- Chicken
- Others
ByGeography
- North America
- APAC
- Europe
- South America
- Middle East and Africa
This study identifies the technological advances in meat and poultry processing equipment as one of the prime reasons driving the meat and poultry processing equipment market growth during the next few years. Also, growing M and A of market competitors and increasing focus on automated meat and poultry processing equipment will lead to sizable demand in the market.
The report on the meat and poultry processing equipment market covers the following areas:
- Meat and poultry processing equipment market sizing
- Meat and poultry processing equipment market forecast
- Meat and poultry processing equipment market industry analysis
The robust vendor analysis is designed to help clients improve their market position, and in line with this, this report provides a detailed analysis of several leading meat and poultry processing equipment market vendors that include Admix Inc., Baader Global SE, BAYLE SA, Berkshire Hathaway Inc., Bettcher Industries Inc., Brower Equipment, Buhler AG, C.G MFG and DIST INC., Cantrell Gainco Group, Deccan Automation Technology, Duravant LLC, Foodmate US Inc., GEA Group AG, Heat and Control Inc., John Bean Technologies Corp., Marel Group, Poultry Processing Equipment Worldwide Ltd., The Middleby Corp., Tomra Systems ASA, and Zaftech India. Also, the meat and poultry processing equipment market analysis report includes information on upcoming trends and challenges that will influence market growth. This is to help companies strategize and leverage all forthcoming growth opportunities.
The study was conducted using an objective combination of primary and secondary information including inputs from key participants in the industry. The report contains a comprehensive market and vendor landscape in addition to an analysis of the key vendors.
The publisher presents a detailed picture of the market by the way of study, synthesis, and summation of data from multiple sources by an analysis of key parameters such as profit, pricing, competition, and promotions. It presents various market facets by identifying the key industry influencers. The data presented is comprehensive, reliable, and a result of extensive research - both primary and secondary. The market research reports provide a complete competitive landscape and an in-depth vendor selection methodology and analysis using qualitative and quantitative research to forecast the accurate market growth.
Table of Contents
1 Executive Summary
- 1.1 Market overview
- Executive Summary - Chart on Market Overview
- Executive Summary - Data Table on Market Overview
- Executive Summary - Chart on Global Market Characteristics
- Executive Summary - Chart on Market By Geographical Landscape
- Executive Summary - Chart on Market Segmentation by Application
- Executive Summary - Chart on Market Segmentation by Product Type
- Executive Summary - Chart on Incremental Growth
- Executive Summary - Data Table on Incremental Growth
- Executive Summary - Chart on Company Market Positioning
2 Market Landscape
- 2.1 Market ecosystem
- Parent Market
- Data Table on - Parent Market
- 2.2 Market characteristics
- Market characteristics analysis
- 2.3 Value chain analysis
- Value Chain Analysis
3 Market Sizing
- 3.1 Market definition
- Offerings of companies included in the market definition
- 3.2 Market segment analysis
- Market segments
- 3.3 Market size 2023
- 3.4 Market outlook: Forecast for 2023-2028
- Chart on Global - Market size and forecast 2023-2028 ($ million)
- Data Table on Global - Market size and forecast 2023-2028 ($ million)
- Chart on Global Market: Year-over-year growth 2023-2028 (%)
- Data Table on Global Market: Year-over-year growth 2023-2028 (%)
4 Historic Market Size
- 4.1 Global Meat And Poultry Processing Equipment Market 2018 - 2022
- Historic Market Size - Data Table on Global Meat And Poultry Processing Equipment Market 2018 - 2022 ($ million)
- 4.2 Application segment analysis 2018 - 2022
- Historic Market Size - Application Segment 2018 - 2022 ($ million)
- 4.3 Product Type segment analysis 2018 - 2022
- Historic Market Size - Product Type Segment 2018 - 2022 ($ million)
- 4.4 Geography segment analysis 2018 - 2022
- Historic Market Size - Geography Segment 2018 - 2022 ($ million)
- 4.5 Country segment analysis 2018 - 2022
- Historic Market Size - Country Segment 2018 - 2022 ($ million)
5 Five Forces Analysis
- 5.1 Five forces summary
- Five forces analysis - Comparison between 2023 and 2028
- 5.2 Bargaining power of buyers
- Bargaining power of buyers - Impact of key factors 2023 and 2028
- 5.3 Bargaining power of suppliers
- Bargaining power of suppliers - Impact of key factors in 2023 and 2028
- 5.4 Threat of new entrants
- Threat of new entrants - Impact of key factors in 2023 and 2028
- 5.5 Threat of substitutes
- Threat of substitutes - Impact of key factors in 2023 and 2028
- 5.6 Threat of rivalry
- Threat of rivalry - Impact of key factors in 2023 and 2028
- 5.7 Market condition
- Chart on Market condition - Five forces 2023 and 2028
6 Market Segmentation by Application
- 6.1 Market segments
- Chart on Application - Market share 2023-2028 (%)
- Data Table on Application - Market share 2023-2028 (%)
- 6.2 Comparison by Application
- Chart on Comparison by Application
- Data Table on Comparison by Application
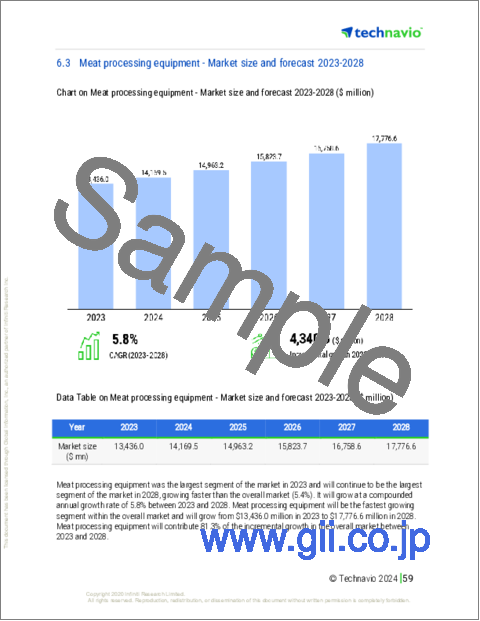
- 6.3 Meat processing equipment - Market size and forecast 2023-2028
- Chart on Meat processing equipment - Market size and forecast 2023-2028 ($ million)
- Data Table on Meat processing equipment - Market size and forecast 2023-2028 ($ million)
- Chart on Meat processing equipment - Year-over-year growth 2023-2028 (%)
- Data Table on Meat processing equipment - Year-over-year growth 2023-2028 (%)
- 6.4 Poultry processing equipment - Market size and forecast 2023-2028
- Chart on Poultry processing equipment - Market size and forecast 2023-2028 ($ million)
- Data Table on Poultry processing equipment - Market size and forecast 2023-2028 ($ million)
- Chart on Poultry processing equipment - Year-over-year growth 2023-2028 (%)
- Data Table on Poultry processing equipment - Year-over-year growth 2023-2028 (%)
- 6.5 Market opportunity by Application
- Market opportunity by Application ($ million)
- Data Table on Market opportunity by Application ($ million)
7 Market Segmentation by Product Type
- 7.1 Market segments
- Chart on Product Type - Market share 2023-2028 (%)
- Data Table on Product Type - Market share 2023-2028 (%)
- 7.2 Comparison by Product Type
- Chart on Comparison by Product Type
- Data Table on Comparison by Product Type
- 7.3 Pork - Market size and forecast 2023-2028
- Chart on Pork - Market size and forecast 2023-2028 ($ million)
- Data Table on Pork - Market size and forecast 2023-2028 ($ million)
- Chart on Pork - Year-over-year growth 2023-2028 (%)
- Data Table on Pork - Year-over-year growth 2023-2028 (%)
- 7.4 Beef - Market size and forecast 2023-2028
- Chart on Beef - Market size and forecast 2023-2028 ($ million)
- Data Table on Beef - Market size and forecast 2023-2028 ($ million)
- Chart on Beef - Year-over-year growth 2023-2028 (%)
- Data Table on Beef - Year-over-year growth 2023-2028 (%)
- 7.5 Chicken - Market size and forecast 2023-2028
- Chart on Chicken - Market size and forecast 2023-2028 ($ million)
- Data Table on Chicken - Market size and forecast 2023-2028 ($ million)
- Chart on Chicken - Year-over-year growth 2023-2028 (%)
- Data Table on Chicken - Year-over-year growth 2023-2028 (%)
- 7.6 Others - Market size and forecast 2023-2028
- Chart on Others - Market size and forecast 2023-2028 ($ million)
- Data Table on Others - Market size and forecast 2023-2028 ($ million)
- Chart on Others - Year-over-year growth 2023-2028 (%)
- Data Table on Others - Year-over-year growth 2023-2028 (%)
- 7.7 Market opportunity by Product Type
- Market opportunity by Product Type ($ million)
- Data Table on Market opportunity by Product Type ($ million)
8 Customer Landscape
- 8.1 Customer landscape overview
- Analysis of price sensitivity, lifecycle, customer purchase basket, adoption rates, and purchase criteria
9 Geographic Landscape
- 9.1 Geographic segmentation
- Chart on Market share By Geographical Landscape 2023-2028 (%)
- Data Table on Market share By Geographical Landscape 2023-2028 (%)
- 9.2 Geographic comparison
- Chart on Geographic comparison
- Data Table on Geographic comparison
- 9.3 North America - Market size and forecast 2023-2028
- Chart on North America - Market size and forecast 2023-2028 ($ million)
- Data Table on North America - Market size and forecast 2023-2028 ($ million)
- Chart on North America - Year-over-year growth 2023-2028 (%)
- Data Table on North America - Year-over-year growth 2023-2028 (%)
- 9.4 APAC - Market size and forecast 2023-2028
- Chart on APAC - Market size and forecast 2023-2028 ($ million)
- Data Table on APAC - Market size and forecast 2023-2028 ($ million)
- Chart on APAC - Year-over-year growth 2023-2028 (%)
- Data Table on APAC - Year-over-year growth 2023-2028 (%)
- 9.5 Europe - Market size and forecast 2023-2028
- Chart on Europe - Market size and forecast 2023-2028 ($ million)
- Data Table on Europe - Market size and forecast 2023-2028 ($ million)
- Chart on Europe - Year-over-year growth 2023-2028 (%)
- Data Table on Europe - Year-over-year growth 2023-2028 (%)
- 9.6 South America - Market size and forecast 2023-2028
- Chart on South America - Market size and forecast 2023-2028 ($ million)
- Data Table on South America - Market size and forecast 2023-2028 ($ million)
- Chart on South America - Year-over-year growth 2023-2028 (%)
- Data Table on South America - Year-over-year growth 2023-2028 (%)
- 9.7 Middle East and Africa - Market size and forecast 2023-2028
- Chart on Middle East and Africa - Market size and forecast 2023-2028 ($ million)
- Data Table on Middle East and Africa - Market size and forecast 2023-2028 ($ million)
- Chart on Middle East and Africa - Year-over-year growth 2023-2028 (%)
- Data Table on Middle East and Africa - Year-over-year growth 2023-2028 (%)
- 9.8 US - Market size and forecast 2023-2028
- Chart on US - Market size and forecast 2023-2028 ($ million)
- Data Table on US - Market size and forecast 2023-2028 ($ million)
- Chart on US - Year-over-year growth 2023-2028 (%)
- Data Table on US - Year-over-year growth 2023-2028 (%)
- 9.9 China - Market size and forecast 2023-2028
- Chart on China - Market size and forecast 2023-2028 ($ million)
- Data Table on China - Market size and forecast 2023-2028 ($ million)
- Chart on China - Year-over-year growth 2023-2028 (%)
- Data Table on China - Year-over-year growth 2023-2028 (%)
- 9.10 Brazil - Market size and forecast 2023-2028
- Chart on Brazil - Market size and forecast 2023-2028 ($ million)
- Data Table on Brazil - Market size and forecast 2023-2028 ($ million)
- Chart on Brazil - Year-over-year growth 2023-2028 (%)
- Data Table on Brazil - Year-over-year growth 2023-2028 (%)
- 9.11 Germany - Market size and forecast 2023-2028
- Chart on Germany - Market size and forecast 2023-2028 ($ million)
- Data Table on Germany - Market size and forecast 2023-2028 ($ million)
- Chart on Germany - Year-over-year growth 2023-2028 (%)
- Data Table on Germany - Year-over-year growth 2023-2028 (%)
- 9.12 France - Market size and forecast 2023-2028
- Chart on France - Market size and forecast 2023-2028 ($ million)
- Data Table on France - Market size and forecast 2023-2028 ($ million)
- Chart on France - Year-over-year growth 2023-2028 (%)
- Data Table on France - Year-over-year growth 2023-2028 (%)
- 9.13 Market opportunity By Geographical Landscape
- Market opportunity By Geographical Landscape ($ million)
- Data Tables on Market opportunity By Geographical Landscape ($ million)
10 Drivers, Challenges, and Opportunity/Restraints
- 10.1 Market drivers
- 10.2 Market challenges
- 10.3 Impact of drivers and challenges
- Impact of drivers and challenges in 2023 and 2028
- 10.4 Market opportunities/restraints
11 Competitive Landscape
- 11.1 Overview
- 11.2 Competitive Landscape
- Overview on criticality of inputs and factors of differentiation
- 11.3 Landscape disruption
- Overview on factors of disruption
- 11.4 Industry risks
- Impact of key risks on business
12 Competitive Analysis
- 12.1 Companies profiled
- Companies covered
- 12.2 Market positioning of companies
- Matrix on companies position and classification
- 12.3 Admix Inc.
- Admix Inc. - Overview
- Admix Inc. - Product / Service
- Admix Inc. - Key offerings
- 12.4 Baader Global SE
- Baader Global SE - Overview
- Baader Global SE - Product / Service
- Baader Global SE - Key offerings
- 12.5 BAYLE SA
- BAYLE SA - Overview
- BAYLE SA - Product / Service
- BAYLE SA - Key offerings
- 12.6 Berkshire Hathaway Inc.
- Berkshire Hathaway Inc. - Overview
- Berkshire Hathaway Inc. - Business segments
- Berkshire Hathaway Inc. - Key news
- Berkshire Hathaway Inc. - Key offerings
- Berkshire Hathaway Inc. - Segment focus
- 12.7 Bettcher Industries Inc.
- Bettcher Industries Inc. - Overview
- Bettcher Industries Inc. - Product / Service
- Bettcher Industries Inc. - Key offerings
- 12.8 Brower Equipment
- Brower Equipment - Overview
- Brower Equipment - Product / Service
- Brower Equipment - Key offerings
- 12.9 Buhler AG
- Buhler AG - Overview
- Buhler AG - Business segments
- Buhler AG - Key news
- Buhler AG - Key offerings
- Buhler AG - Segment focus
- 12.10 C.G MFG and DIST INC.
- C.G MFG and DIST INC. - Overview
- C.G MFG and DIST INC. - Product / Service
- C.G MFG and DIST INC. - Key offerings
- 12.11 Cantrell Gainco Group
- Cantrell Gainco Group - Overview
- Cantrell Gainco Group - Product / Service
- Cantrell Gainco Group - Key offerings
- 12.12 Duravant LLC
- Duravant LLC - Overview
- Duravant LLC - Product / Service
- Duravant LLC - Key news
- Duravant LLC - Key offerings
- 12.13 GEA Group AG
- GEA Group AG - Overview
- GEA Group AG - Business segments
- GEA Group AG - Key news
- GEA Group AG - Key offerings
- GEA Group AG - Segment focus
- 12.14 John Bean Technologies Corp.
- John Bean Technologies Corp. - Overview
- John Bean Technologies Corp. - Business segments
- John Bean Technologies Corp. - Key news
- John Bean Technologies Corp. - Key offerings
- John Bean Technologies Corp. - Segment focus
- 12.15 Marel Group
- Marel Group - Overview
- Marel Group - Business segments
- Marel Group - Key news
- Marel Group - Key offerings
- Marel Group - Segment focus
- 12.16 The Middleby Corp.
- The Middleby Corp. - Overview
- The Middleby Corp. - Business segments
- The Middleby Corp. - Key offerings
- The Middleby Corp. - Segment focus
- 12.17 Tomra Systems ASA
- Tomra Systems ASA - Overview
- Tomra Systems ASA - Business segments
- Tomra Systems ASA - Key news
- Tomra Systems ASA - Key offerings
- Tomra Systems ASA - Segment focus
13 Appendix
- 13.1 Scope of the report
- 13.2 Inclusions and exclusions checklist
- Inclusions checklist
- Exclusions checklist
- 13.3 Currency conversion rates for US$
- Currency conversion rates for US$
- 13.4 Research methodology
- Research methodology
- 13.5 Data procurement
- Information sources
- 13.6 Data validation
- Data validation
- 13.7 Validation techniques employed for market sizing
- Validation techniques employed for market sizing
- 13.8 Data synthesis
- Data synthesis
- 13.9 360 degree market analysis
- 360 degree market analysis
- 13.10 List of abbreviations
- List of abbreviations

