|
|
市場調査レポート
商品コード
1937198
モビリティ・アズ・ア・サービスの世界市場 2026年~2030年Global Mobility-As-A-Service Market 2026-2030 |
||||||
|
|||||||
カスタマイズ可能
|
|||||||

| モビリティ・アズ・ア・サービスの世界市場 2026年~2030年 |
|
出版日: 2026年02月11日
発行: TechNavio
ページ情報: 英文 293 Pages
納期: 即納可能
|

概要
世界のモビリティ・アズ・ア・サービス市場は、2025年から2030年の間に3,732億3,070万米ドルの成長が見込まれ、予測期間中のCAGRは27.9%と予測されています。
本報告書では、世界のモビリティ・アズ・ア・サービス市場に関する包括的な分析、市場規模と予測、動向、成長要因、課題に加え、約25社のベンダー分析を提供しております。
本レポートでは、現在の市場状況、最新の市場動向と促進要因、市場環境全般に関する最新の分析を提供しております。市場の成長要因としては、スマートフォンなどのスマート接続デバイスの利用増加、業務効率化への需要拡大、資本支出モデルから運用支出モデルへの移行の進展が挙げられます。
本調査は、業界の主要関係者からの情報を含む一次情報と二次情報を客観的に組み合わせて実施されました。本レポートには、主要企業の分析に加え、包括的な市場規模データ、地域別分析を伴うセグメント、ベンダー情勢が含まれています。レポートには過去データと予測データが掲載されています。
| 市場範囲 | |
|---|---|
| 基準年 | 2026年 |
| 終了年 | 2030年 |
| 予測期間 | 2026-2030 |
| 成長モメンタム | 加速 |
| 前年比2026年 | 21.9% |
| CAGR | 27.9% |
| 増分額 | 3,732億3,070万米ドル |
本調査では、今後数年間における世界のモビリティ・アズ・ア・サービス(MaaS)市場の成長を牽引する主要要因の一つとして、ライドシェアリングプラットフォームや自動車メーカーの関心が挙げられています。また、自動運転車の開発に向けた継続的な取り組みや、運輸会社との提携関係の拡大が、市場における大幅な需要創出につながると見込まれます。
目次
第1章 エグゼクティブサマリー
第2章 Technavio分析
- 価格・ライフサイクル・顧客購入バスケット・採用率・購入基準の分析
- インプットの重要性と差別化の要因
- 混乱の要因
- 促進要因と課題の影響
第3章 市場情勢
- 市場エコシステム
- 市場の特徴
- バリューチェーン分析
第4章 市場規模
- 市場の定義
- 市場セグメント分析
- 市場規模 2025
- 市場の見通し 2025-2030
第5章 市場規模実績
- モビリティ・アズ・ア・サービスの世界市場 2020-2024
- サービスセグメント分析 2020-2024
- 車両タイプセグメント分析 2020-2024
- タイプセグメント分析 2020-2024
- 地域別セグメント分析 2020-2024
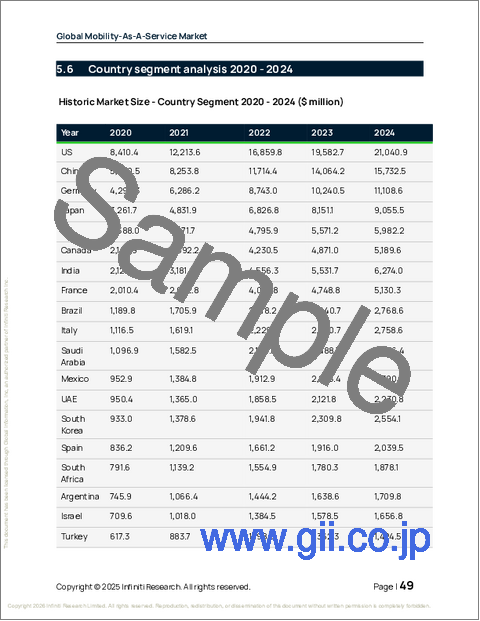
- 国別セグメント分析 2020-2024
第6章 定性分析
- AIの影響:モビリティ・アズ・ア・サービスの世界市場
第7章 ファイブフォース分析
- ファイブフォースの要約
- 買い手の交渉力
- 供給企業の交渉力
- 新規参入業者の脅威
- 代替品の脅威
- 競争の脅威
- 市況
第8章 市場セグメンテーション:サービス別
- 比較:サービス別
- ライドヘイリング
- カーシェアリング
- その他
- 市場機会:サービス別
第9章 市場セグメンテーション:車両タイプ別
- 比較:車両タイプ別
- 乗用車
- バス
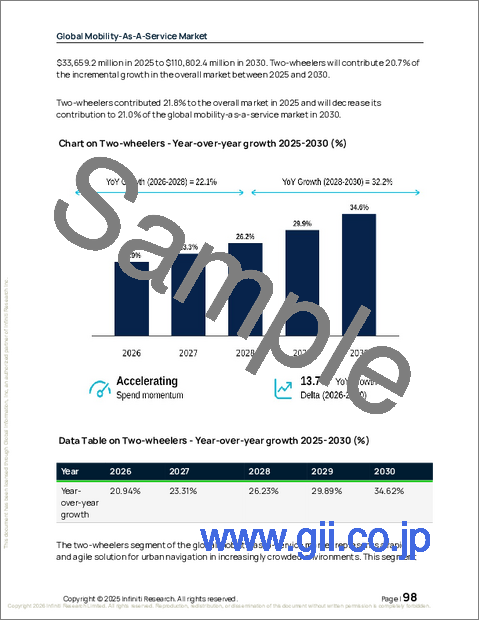
- 二輪車
- 市場機会:車両タイプ別
第10章 市場セグメンテーション:タイプ別
- 比較:タイプ別
- 公共部門
- 民間
- 市場機会:タイプ別
第11章 顧客情勢
第12章 地域別情勢
- 地域別セグメンテーション
- 地域別比較
- アジア太平洋
- 中国
- 日本
- インド
- 韓国
- オーストラリア
- インドネシア
- 欧州
- ドイツ
- 英国
- フランス
- イタリア
- スペイン
- オランダ
- 北米
- 米国
- カナダ
- メキシコ
- 中東・アフリカ
- サウジアラビア
- アラブ首長国連邦
- 南アフリカ
- イスラエル
- トルコ
- 南米
- ブラジル
- アルゼンチン
- コロンビア
- 市場機会:地域別
第13章 促進要因・課題・機会
- 市場促進要因
- 市場の課題
- 促進要因と課題の影響
- 市場機会
第14章 競合情勢
- 概要
- 競合情勢
- 混乱の状況
- 業界のリスク
第15章 競合分析
- 企業プロファイル
- 企業ランキング指標
- 企業の市場ポジショニング
- Avis Budget Group Inc.
- Bolt Technology OU
- Cabify Espana SL
- Comuto SA
- Curb Mobility LLC
- DiDi Global Inc.
- Europcar Mobility Group
- Free Now
- Gett
- Grab Holdings Ltd.
- Hertz Global Holdings Inc.
- Lyft Inc.
- Mobiko GmbH
- SIXT SE
- Uber Technologies Inc.
