|
|
市場調査レポート
商品コード
1626712
科学・技術・工学・数学(STEM)玩具の世界市場 2025~2029年Global Science, Technology, Engineering, and Mathematics (STEM) Toys Market 2025-2029 |
||||||

|
|||||||
カスタマイズ可能
|
|||||||


| 科学・技術・工学・数学(STEM)玩具の世界市場 2025~2029年 |
|
出版日: 2024年12月19日
発行: TechNavio
ページ情報: 英文 226 Pages
納期: 即納可能
|

全表示
- 概要
- 図表
- 目次
科学・技術・工学・数学(STEM)玩具市場 2025~2029年
科学・技術・工学・数学(STEM)玩具市場は2024~2029年に67億1,970万米ドル、予測期間中のCAGRは7.6%で成長すると予測されます。当レポートでは、科学・技術・工学・数学(STEM)玩具市場の全体的な分析、市場規模・予測、動向、成長促進要因、課題、約25のベンダーを網羅したベンダー分析などを掲載しています。
現在の市場シナリオ、最新動向と促進要因、市場環境全体に関する最新分析を提供しています。同市場は、幹教育の重視の高まり、幹教育におけるデジタルプラットフォームの統合、男女平等とインクルージョンへの注目の高まりなどが牽引しています。
| 市場範囲 | |
|---|---|
| 基準年 | 2025 |
| 終了年 | 2029 |
| 予測期間 | 2025-2029 |
| 成長モメンタム | 加速 |
| 前年比2025年 | 7.1% |
| CAGR | 7.6% |
| 増分額 | 67億1,970万米ドル |
本調査では、今後数年間の科学・技術・工学・数学(STEM)玩具市場の成長を促進する主な要因の1つとして、幹玩具における人工知能(AI)と機械学習(ML)技術の統合を挙げています。また、ステム教育における拡張現実(AR)やVR技術の人気の上昇、ステムトイ産業における持続可能で環境に優しい素材の採用の増加は、市場の大きな需要につながります。
目次
第1章 エグゼクティブサマリー
- 市場概要
第2章 Technavio別分析
- 価格・ライフサイクル・顧客購入バスケット・採用率・購入基準の分析
- インプットの重要性と差別化の要因
- 混乱の要因
- 促進要因と課題の影響
第3章 市場情勢
- 市場エコシステム
- 市場の特徴
- バリューチェーン分析
第4章 市場規模
- 市場の定義
- 市場セグメント分析
- 市場規模 2024年
- 市場の見通し 2024~2029年
第5章 市場規模実績
- 科学・技術・工学・数学(STEM)玩具の世界市場 2019~2023年
- 用途別セグメント分析
- 年齢層別セグメント分析
- 科目別セグメント分析
- 地域別セグメント分析
- 国別セグメント分析
第6章 定性分析
- AIの影響:世界の科学、技術、工学、数学(STEM)玩具市場
第7章 ファイブフォース分析
- ファイブフォースの要約
- 買い手の交渉力
- 供給企業の交渉力
- 新規参入業者の脅威
- 代替品の脅威
- 競争の脅威
- 市況
第8章 市場セグメンテーション:用途別
- 市場セグメント
- 比較:用途別
- 家庭内
- 学校内
- 市場機会:用途別
第9章 市場セグメンテーション:年齢層別
- 市場セグメント
- 比較:年齢層別
- 市場機会:年齢層別
第10章 市場セグメンテーション科目別
- 市場セグメント
- 比較:科目別
- 科学
- エンジニアリング
- 数学
- テクノロジー
- 市場機会:科目別
第11章 顧客情勢
- 顧客情勢の概要
第12章 地域別情勢
- 地域別セグメンテーション
- 地域別比較
- アジア太平洋
- 北米
- 欧州
- 中東・アフリカ
- 南米
- 米国
- 中国
- 日本
- ドイツ
- インド
- カナダ
- 韓国
- 英国
- フランス
- イタリア
- 市場機会:地域情勢別
第13章 促進要因・課題・機会・抑制要因
- 市場促進要因
- 市場の課題
- 促進要因と課題の影響
- 市場の機会・抑制要因
第14章 競合情勢
- 概要
- 競合情勢
- 混乱の状況
- 業界のリスク
第15章 競合分析
- 企業プロファイル
- 企業ランキング指数
- 企業の市場ポジショニング
- Franckh Kosmos Verlags GmbH and Co. KG
- Fun Express LLC
- Funvention Learning Pvt. Ltd.
- GoldieBlox Inc.
- Learning Resources Ltd.
- LEGO System AS
- Makeblock Co. Ltd.
- Mattel Inc.
- Piper Learning Inc.
- Scientifics Direct Inc.
- Smartivity Labs Pvt. Ltd.
- Sphero Inc.
- Thimble
- Tinkering Labs Inc.
- Xinxiang Alpha Manufacturing Ltd.
第16章 付録
Exhibits:
- Exhibits1: Executive Summary - Chart on Market Overview
- Exhibits2: Executive Summary - Data Table on Market Overview
- Exhibits3: Executive Summary - Chart on Global Market Characteristics
- Exhibits4: Executive Summary - Chart on Market By Geographical Landscape
- Exhibits5: Executive Summary - Chart on Market Segmentation by Application
- Exhibits6: Executive Summary - Chart on Market Segmentation by Age Group
- Exhibits7: Executive Summary - Chart on Market Segmentation by Subjects
- Exhibits8: Executive Summary - Chart on Incremental Growth
- Exhibits9: Executive Summary - Data Table on Incremental Growth
- Exhibits10: Executive Summary - Chart on Company Market Positioning
- Exhibits11: Analysis of price sensitivity, lifecycle, customer purchase basket, adoption rates, and purchase criteria
- Exhibits12: Overview on criticality of inputs and factors of differentiation
- Exhibits13: Overview on factors of disruption
- Exhibits14: Impact of drivers and challenges in 2024 and 2029
- Exhibits15: Parent Market
- Exhibits16: Data Table on - Parent Market
- Exhibits17: Market characteristics analysis
- Exhibits18: Value chain analysis
- Exhibits19: Offerings of companies included in the market definition
- Exhibits20: Market segments
- Exhibits21: Chart on Global - Market size and forecast 2024-2029 ($ million)
- Exhibits22: Data Table on Global - Market size and forecast 2024-2029 ($ million)
- Exhibits23: Chart on Global Market: Year-over-year growth 2024-2029 (%)
- Exhibits24: Data Table on Global Market: Year-over-year growth 2024-2029 (%)
- Exhibits25: Historic Market Size - Data Table on Global Science, Technology, Engineering, And Mathematics (STEM) Toys Market 2019 - 2023 ($ million)
- Exhibits26: Historic Market Size - Application Segment 2019 - 2023 ($ million)
- Exhibits27: Historic Market Size - Age Group Segment 2019 - 2023 ($ million)
- Exhibits28: Historic Market Size - Subjects Segment 2019 - 2023 ($ million)
- Exhibits29: Historic Market Size - Geography Segment 2019 - 2023 ($ million)
- Exhibits30: Historic Market Size - Country Segment 2019 - 2023 ($ million)
- Exhibits31: Five forces analysis - Comparison between 2024 and 2029
- Exhibits32: Bargaining power of buyers - Impact of key factors 2024 and 2029
- Exhibits33: Bargaining power of suppliers - Impact of key factors in 2024 and 2029
- Exhibits34: Threat of new entrants - Impact of key factors in 2024 and 2029
- Exhibits35: Threat of substitutes - Impact of key factors in 2024 and 2029
- Exhibits36: Threat of rivalry - Impact of key factors in 2024 and 2029
- Exhibits37: Chart on Market condition - Five forces 2024 and 2029
- Exhibits38: Chart on Application - Market share 2024-2029 (%)
- Exhibits39: Data Table on Application - Market share 2024-2029 (%)
- Exhibits40: Chart on Comparison by Application
- Exhibits41: Data Table on Comparison by Application
- Exhibits42: Chart on In-home - Market size and forecast 2024-2029 ($ million)
- Exhibits43: Data Table on In-home - Market size and forecast 2024-2029 ($ million)
- Exhibits44: Chart on In-home - Year-over-year growth 2024-2029 (%)
- Exhibits45: Data Table on In-home - Year-over-year growth 2024-2029 (%)
- Exhibits46: Chart on In-school - Market size and forecast 2024-2029 ($ million)
- Exhibits47: Data Table on In-school - Market size and forecast 2024-2029 ($ million)
- Exhibits48: Chart on In-school - Year-over-year growth 2024-2029 (%)
- Exhibits49: Data Table on In-school - Year-over-year growth 2024-2029 (%)
- Exhibits50: Market opportunity by Application ($ million)
- Exhibits51: Data Table on Market opportunity by Application ($ million)
- Exhibits52: Chart on Age Group - Market share 2024-2029 (%)
- Exhibits53: Data Table on Age Group - Market share 2024-2029 (%)
- Exhibits54: Chart on Comparison by Age Group
- Exhibits55: Data Table on Comparison by Age Group
- Exhibits56: Chart on 9-10 years - Market size and forecast 2024-2029 ($ million)
- Exhibits57: Data Table on 9-10 years - Market size and forecast 2024-2029 ($ million)
- Exhibits58: Chart on 9-10 years - Year-over-year growth 2024-2029 (%)
- Exhibits59: Data Table on 9-10 years - Year-over-year growth 2024-2029 (%)
- Exhibits60: Chart on 6-8 years - Market size and forecast 2024-2029 ($ million)
- Exhibits61: Data Table on 6-8 years - Market size and forecast 2024-2029 ($ million)
- Exhibits62: Chart on 6-8 years - Year-over-year growth 2024-2029 (%)
- Exhibits63: Data Table on 6-8 years - Year-over-year growth 2024-2029 (%)
- Exhibits64: Chart on 11-13 years - Market size and forecast 2024-2029 ($ million)
- Exhibits65: Data Table on 11-13 years - Market size and forecast 2024-2029 ($ million)
- Exhibits66: Chart on 11-13 years - Year-over-year growth 2024-2029 (%)
- Exhibits67: Data Table on 11-13 years - Year-over-year growth 2024-2029 (%)
- Exhibits68: Market opportunity by Age Group ($ million)
- Exhibits69: Data Table on Market opportunity by Age Group ($ million)
- Exhibits70: Chart on Subjects - Market share 2024-2029 (%)
- Exhibits71: Data Table on Subjects - Market share 2024-2029 (%)
- Exhibits72: Chart on Comparison by Subjects
- Exhibits73: Data Table on Comparison by Subjects
- Exhibits74: Chart on Science - Market size and forecast 2024-2029 ($ million)
- Exhibits75: Data Table on Science - Market size and forecast 2024-2029 ($ million)
- Exhibits76: Chart on Science - Year-over-year growth 2024-2029 (%)
- Exhibits77: Data Table on Science - Year-over-year growth 2024-2029 (%)
- Exhibits78: Chart on Engineering - Market size and forecast 2024-2029 ($ million)
- Exhibits79: Data Table on Engineering - Market size and forecast 2024-2029 ($ million)
- Exhibits80: Chart on Engineering - Year-over-year growth 2024-2029 (%)
- Exhibits81: Data Table on Engineering - Year-over-year growth 2024-2029 (%)
- Exhibits82: Chart on Mathematics - Market size and forecast 2024-2029 ($ million)
- Exhibits83: Data Table on Mathematics - Market size and forecast 2024-2029 ($ million)
- Exhibits84: Chart on Mathematics - Year-over-year growth 2024-2029 (%)
- Exhibits85: Data Table on Mathematics - Year-over-year growth 2024-2029 (%)
- Exhibits86: Chart on Technology - Market size and forecast 2024-2029 ($ million)
- Exhibits87: Data Table on Technology - Market size and forecast 2024-2029 ($ million)
- Exhibits88: Chart on Technology - Year-over-year growth 2024-2029 (%)
- Exhibits89: Data Table on Technology - Year-over-year growth 2024-2029 (%)
- Exhibits90: Market opportunity by Subjects ($ million)
- Exhibits91: Data Table on Market opportunity by Subjects ($ million)
- Exhibits92: Analysis of price sensitivity, lifecycle, customer purchase basket, adoption rates, and purchase criteria
- Exhibits93: Chart on Market share By Geographical Landscape 2024-2029 (%)
- Exhibits94: Data Table on Market share By Geographical Landscape 2024-2029 (%)
- Exhibits95: Chart on Geographic comparison
- Exhibits96: Data Table on Geographic comparison
- Exhibits97: Chart on APAC - Market size and forecast 2024-2029 ($ million)
- Exhibits98: Data Table on APAC - Market size and forecast 2024-2029 ($ million)
- Exhibits99: Chart on APAC - Year-over-year growth 2024-2029 (%)
- Exhibits100: Data Table on APAC - Year-over-year growth 2024-2029 (%)
- Exhibits101: Chart on North America - Market size and forecast 2024-2029 ($ million)
- Exhibits102: Data Table on North America - Market size and forecast 2024-2029 ($ million)
- Exhibits103: Chart on North America - Year-over-year growth 2024-2029 (%)
- Exhibits104: Data Table on North America - Year-over-year growth 2024-2029 (%)
- Exhibits105: Chart on Europe - Market size and forecast 2024-2029 ($ million)
- Exhibits106: Data Table on Europe - Market size and forecast 2024-2029 ($ million)
- Exhibits107: Chart on Europe - Year-over-year growth 2024-2029 (%)
- Exhibits108: Data Table on Europe - Year-over-year growth 2024-2029 (%)
- Exhibits109: Chart on Middle East and Africa - Market size and forecast 2024-2029 ($ million)
- Exhibits110: Data Table on Middle East and Africa - Market size and forecast 2024-2029 ($ million)
- Exhibits111: Chart on Middle East and Africa - Year-over-year growth 2024-2029 (%)
- Exhibits112: Data Table on Middle East and Africa - Year-over-year growth 2024-2029 (%)
- Exhibits113: Chart on South America - Market size and forecast 2024-2029 ($ million)
- Exhibits114: Data Table on South America - Market size and forecast 2024-2029 ($ million)
- Exhibits115: Chart on South America - Year-over-year growth 2024-2029 (%)
- Exhibits116: Data Table on South America - Year-over-year growth 2024-2029 (%)
- Exhibits117: Chart on US - Market size and forecast 2024-2029 ($ million)
- Exhibits118: Data Table on US - Market size and forecast 2024-2029 ($ million)
- Exhibits119: Chart on US - Year-over-year growth 2024-2029 (%)
- Exhibits120: Data Table on US - Year-over-year growth 2024-2029 (%)
- Exhibits121: Chart on China - Market size and forecast 2024-2029 ($ million)
- Exhibits122: Data Table on China - Market size and forecast 2024-2029 ($ million)
- Exhibits123: Chart on China - Year-over-year growth 2024-2029 (%)
- Exhibits124: Data Table on China - Year-over-year growth 2024-2029 (%)
- Exhibits125: Chart on Japan - Market size and forecast 2024-2029 ($ million)
- Exhibits126: Data Table on Japan - Market size and forecast 2024-2029 ($ million)
- Exhibits127: Chart on Japan - Year-over-year growth 2024-2029 (%)
- Exhibits128: Data Table on Japan - Year-over-year growth 2024-2029 (%)
- Exhibits129: Chart on Germany - Market size and forecast 2024-2029 ($ million)
- Exhibits130: Data Table on Germany - Market size and forecast 2024-2029 ($ million)
- Exhibits131: Chart on Germany - Year-over-year growth 2024-2029 (%)
- Exhibits132: Data Table on Germany - Year-over-year growth 2024-2029 (%)
- Exhibits133: Chart on India - Market size and forecast 2024-2029 ($ million)
- Exhibits134: Data Table on India - Market size and forecast 2024-2029 ($ million)
- Exhibits135: Chart on India - Year-over-year growth 2024-2029 (%)
- Exhibits136: Data Table on India - Year-over-year growth 2024-2029 (%)
- Exhibits137: Chart on Canada - Market size and forecast 2024-2029 ($ million)
- Exhibits138: Data Table on Canada - Market size and forecast 2024-2029 ($ million)
- Exhibits139: Chart on Canada - Year-over-year growth 2024-2029 (%)
- Exhibits140: Data Table on Canada - Year-over-year growth 2024-2029 (%)
- Exhibits141: Chart on South Korea - Market size and forecast 2024-2029 ($ million)
- Exhibits142: Data Table on South Korea - Market size and forecast 2024-2029 ($ million)
- Exhibits143: Chart on South Korea - Year-over-year growth 2024-2029 (%)
- Exhibits144: Data Table on South Korea - Year-over-year growth 2024-2029 (%)
- Exhibits145: Chart on UK - Market size and forecast 2024-2029 ($ million)
- Exhibits146: Data Table on UK - Market size and forecast 2024-2029 ($ million)
- Exhibits147: Chart on UK - Year-over-year growth 2024-2029 (%)
- Exhibits148: Data Table on UK - Year-over-year growth 2024-2029 (%)
- Exhibits149: Chart on France - Market size and forecast 2024-2029 ($ million)
- Exhibits150: Data Table on France - Market size and forecast 2024-2029 ($ million)
- Exhibits151: Chart on France - Year-over-year growth 2024-2029 (%)
- Exhibits152: Data Table on France - Year-over-year growth 2024-2029 (%)
- Exhibits153: Chart on Italy - Market size and forecast 2024-2029 ($ million)
- Exhibits154: Data Table on Italy - Market size and forecast 2024-2029 ($ million)
- Exhibits155: Chart on Italy - Year-over-year growth 2024-2029 (%)
- Exhibits156: Data Table on Italy - Year-over-year growth 2024-2029 (%)
- Exhibits157: Market opportunity By Geographical Landscape ($ million)
- Exhibits158: Data Tables on Market opportunity By Geographical Landscape ($ million)
- Exhibits159: Impact of drivers and challenges in 2024 and 2029
- Exhibits160: Overview on criticality of inputs and factors of differentiation
- Exhibits161: Overview on factors of disruption
- Exhibits162: Impact of key risks on business
- Exhibits163: Companies covered
- Exhibits164: Company ranking index
- Exhibits165: Matrix on companies position and classification
- Exhibits166: Franckh Kosmos Verlags GmbH and Co. KG - Overview
- Exhibits167: Franckh Kosmos Verlags GmbH and Co. KG - Product / Service
- Exhibits168: Franckh Kosmos Verlags GmbH and Co. KG - Key offerings
- Exhibits169: SWOT
- Exhibits170: Fun Express LLC - Overview
- Exhibits171: Fun Express LLC - Product / Service
- Exhibits172: Fun Express LLC - Key offerings
- Exhibits173: SWOT
- Exhibits174: Funvention Learning Pvt. Ltd. - Overview
- Exhibits175: Funvention Learning Pvt. Ltd. - Product / Service
- Exhibits176: Funvention Learning Pvt. Ltd. - Key offerings
- Exhibits177: SWOT
- Exhibits178: GoldieBlox Inc. - Overview
- Exhibits179: GoldieBlox Inc. - Product / Service
- Exhibits180: GoldieBlox Inc. - Key offerings
- Exhibits181: SWOT
- Exhibits182: Learning Resources Ltd. - Overview
- Exhibits183: Learning Resources Ltd. - Product / Service
- Exhibits184: Learning Resources Ltd. - Key offerings
- Exhibits185: SWOT
- Exhibits186: LEGO System AS - Overview
- Exhibits187: LEGO System AS - Product / Service
- Exhibits188: LEGO System AS - Key news
- Exhibits189: LEGO System AS - Key offerings
- Exhibits190: SWOT
- Exhibits191: Makeblock Co. Ltd. - Overview
- Exhibits192: Makeblock Co. Ltd. - Product / Service
- Exhibits193: Makeblock Co. Ltd. - Key offerings
- Exhibits194: SWOT
- Exhibits195: Mattel Inc. - Overview
- Exhibits196: Mattel Inc. - Business segments
- Exhibits197: Mattel Inc. - Key news
- Exhibits198: Mattel Inc. - Key offerings
- Exhibits199: Mattel Inc. - Segment focus
- Exhibits200: SWOT
- Exhibits201: Piper Learning Inc. - Overview
- Exhibits202: Piper Learning Inc. - Product / Service
- Exhibits203: Piper Learning Inc. - Key offerings
- Exhibits204: SWOT
- Exhibits205: Scientifics Direct Inc. - Overview
- Exhibits206: Scientifics Direct Inc. - Product / Service
- Exhibits207: Scientifics Direct Inc. - Key offerings
- Exhibits208: SWOT
- Exhibits209: Smartivity Labs Pvt. Ltd. - Overview
- Exhibits210: Smartivity Labs Pvt. Ltd. - Product / Service
- Exhibits211: Smartivity Labs Pvt. Ltd. - Key offerings
- Exhibits212: SWOT
- Exhibits213: Sphero Inc. - Overview
- Exhibits214: Sphero Inc. - Product / Service
- Exhibits215: Sphero Inc. - Key news
- Exhibits216: Sphero Inc. - Key offerings
- Exhibits217: SWOT
- Exhibits218: Thimble - Overview
- Exhibits219: Thimble - Product / Service
- Exhibits220: Thimble - Key offerings
- Exhibits221: SWOT
- Exhibits222: Tinkering Labs Inc. - Overview
- Exhibits223: Tinkering Labs Inc. - Product / Service
- Exhibits224: Tinkering Labs Inc. - Key offerings
- Exhibits225: SWOT
- Exhibits226: Xinxiang Alpha Manufacturing Ltd. - Overview
- Exhibits227: Xinxiang Alpha Manufacturing Ltd. - Product / Service
- Exhibits228: Xinxiang Alpha Manufacturing Ltd. - Key offerings
- Exhibits229: SWOT
- Exhibits230: Inclusions checklist
- Exhibits231: Exclusions checklist
- Exhibits232: Currency conversion rates for US$
- Exhibits233: Research methodology
- Exhibits234: Information sources
- Exhibits235: Data validation
Science, Technology, Engineering, And Mathematics (STEM) Toys Market 2025-2029
The science, technology, engineering, and mathematics (STEM) toys market is forecasted to grow by USD 6719.7 mn during 2024-2029, accelerating at a CAGR of 7.6% during the forecast period. The report on the science, technology, engineering, and mathematics (STEM) toys market provides a holistic analysis, market size and forecast, trends, growth drivers, and challenges, as well as vendor analysis covering around 25 vendors.
The report offers an up-to-date analysis regarding the current market scenario, the latest trends and drivers, and the overall market environment. The market is driven by growing emphasis on stem education, integration of digital platform in stem education, and growing focus on gender equality and inclusion.
| Market Scope | |
|---|---|
| Base Year | 2025 |
| End Year | 2029 |
| Series Year | 2025-2029 |
| Growth Momentum | Accelerate |
| YOY 2025 | 7.1% |
| CAGR | 7.6% |
| Incremental Value | $6719.7 mn |
Technavio's science, technology, engineering, and mathematics (STEM) toys market is segmented as below:
By Application
- In-home
- In-school
By Age Group
- 9-10 years
- 6-8 years
- 11-13 years
By Subjects
- Science
- Engineering
- Mathematics
- Technology
By Geographical Landscape
- APAC
- North America
- Europe
- Middle East and Africa
- South America
This study identifies the integration of artificial intelligence (AI) and machine learning (ML) technologies in stem toys as one of the prime reasons driving the science, technology, engineering, and mathematics (STEM) toys market growth during the next few years. Also, rise in popularity of augmented reality (AR) and vr technologies in stem education and rise in adoption of sustainable and eco-friendly materials in stem toys industry will lead to sizable demand in the market.
The report on the science, technology, engineering, and mathematics (STEM) toys market covers the following areas:
- Science, Technology, Engineering, And Mathematics (STEM) Toys Market sizing
- Science, Technology, Engineering, And Mathematics (STEM) Toys Market forecast
- Science, Technology, Engineering, And Mathematics (STEM) Toys Market industry analysis
The robust vendor analysis is designed to help clients improve their market position, and in line with this, this report provides a detailed analysis of several leading science, technology, engineering, and mathematics (STEM) toys market vendors that include Building Blocks Learning Solutions Pvt. Ltd., Fat Brain Toys LLC, Franckh Kosmos Verlags GmbH and Co. KG, Fun Express LLC, Funvention Learning Pvt. Ltd., GoldieBlox Inc., Innovation First International Inc., Learning Resources Ltd., LEGO System AS, Makeblock Co. Ltd., Makey Makey LLC., Mattel Inc., MVW Holdings Inc., Ozo EDU Inc., Piper Learning Inc., Scientifics Direct Inc., Smartivity Labs Pvt. Ltd., Sphero Inc., Spin Master Corp., Thimble, Tinkering Labs Inc., and Xinxiang Alpha Manufacturing Ltd.. Also, the science, technology, engineering, and mathematics (STEM) toys market analysis report includes information on upcoming trends and challenges that will influence market growth. This is to help companies strategize and leverage all forthcoming growth opportunities.
The study was conducted using an objective combination of primary and secondary information including inputs from key participants in the industry. The report contains a comprehensive market and vendor landscape in addition to an analysis of the key vendors.
The publisher presents a detailed picture of the market by the way of study, synthesis, and summation of data from multiple sources by an analysis of key parameters such as profit, pricing, competition, and promotions. It presents various market facets by identifying the key industry influencers. The data presented is comprehensive, reliable, and a result of extensive primary and secondary research. The market research reports provide a complete competitive landscape and an in-depth vendor selection methodology and analysis using qualitative and quantitative research to forecast accurate market growth.
Table of Contents
1 Executive Summary
- 1.1 Market overview
- Executive Summary - Chart on Market Overview
- Executive Summary - Data Table on Market Overview
- Executive Summary - Chart on Global Market Characteristics
- Executive Summary - Chart on Market By Geographical Landscape
- Executive Summary - Chart on Market Segmentation by Application
- Executive Summary - Chart on Market Segmentation by Age Group
- Executive Summary - Chart on Market Segmentation by Subjects
- Executive Summary - Chart on Incremental Growth
- Executive Summary - Data Table on Incremental Growth
- Executive Summary - Chart on Company Market Positioning
2 Technavio Analysis
- 2.1 Analysis of price sensitivity, lifecycle, customer purchase basket, adoption rates, and purchase criteria
- Analysis of price sensitivity, lifecycle, customer purchase basket, adoption rates, and purchase criteria
- 2.2 Criticality of inputs and Factors of differentiation
- Overview on criticality of inputs and factors of differentiation
- 2.3 Factors of disruption
- Overview on factors of disruption
- 2.4 Impact of drivers and challenges
- Impact of drivers and challenges in 2024 and 2029
3 Market Landscape
- 3.1 Market ecosystem
- Parent Market
- Data Table on - Parent Market
- 3.2 Market characteristics
- Market characteristics analysis
- 3.3 Value chain analysis
- Value chain analysis
4 Market Sizing
- 4.1 Market definition
- Offerings of companies included in the market definition
- 4.2 Market segment analysis
- Market segments
- 4.3 Market size 2024
- 4.4 Market outlook: Forecast for 2024-2029
- Chart on Global - Market size and forecast 2024-2029 ($ million)
- Data Table on Global - Market size and forecast 2024-2029 ($ million)
- Chart on Global Market: Year-over-year growth 2024-2029 (%)
- Data Table on Global Market: Year-over-year growth 2024-2029 (%)
5 Historic Market Size
- 5.1 Global Science, Technology, Engineering, And Mathematics (STEM) Toys Market 2019 - 2023
- Historic Market Size - Data Table on Global Science, Technology, Engineering, And Mathematics (STEM) Toys Market 2019 - 2023 ($ million)
- 5.2 Application segment analysis 2019 - 2023
- Historic Market Size - Application Segment 2019 - 2023 ($ million)
- 5.3 Age Group segment analysis 2019 - 2023
- Historic Market Size - Age Group Segment 2019 - 2023 ($ million)
- 5.4 Subjects segment analysis 2019 - 2023
- Historic Market Size - Subjects Segment 2019 - 2023 ($ million)
- 5.5 Geography segment analysis 2019 - 2023
- Historic Market Size - Geography Segment 2019 - 2023 ($ million)
- 5.6 Country segment analysis 2019 - 2023
- Historic Market Size - Country Segment 2019 - 2023 ($ million)
6 Qualitative Analysis
- 6.1 The impact of AI in Global Science, Technology, Engineering and Mathematics (STEM) Toys Market
7 Five Forces Analysis
- 7.1 Five forces summary
- Five forces analysis - Comparison between 2024 and 2029
- 7.2 Bargaining power of buyers
- Bargaining power of buyers - Impact of key factors 2024 and 2029
- 7.3 Bargaining power of suppliers
- Bargaining power of suppliers - Impact of key factors in 2024 and 2029
- 7.4 Threat of new entrants
- Threat of new entrants - Impact of key factors in 2024 and 2029
- 7.5 Threat of substitutes
- Threat of substitutes - Impact of key factors in 2024 and 2029
- 7.6 Threat of rivalry
- Threat of rivalry - Impact of key factors in 2024 and 2029
- 7.7 Market condition
- Chart on Market condition - Five forces 2024 and 2029
8 Market Segmentation by Application
- 8.1 Market segments
- Chart on Application - Market share 2024-2029 (%)
- Data Table on Application - Market share 2024-2029 (%)
- 8.2 Comparison by Application
- Chart on Comparison by Application
- Data Table on Comparison by Application
- 8.3 In-home - Market size and forecast 2024-2029
- Chart on In-home - Market size and forecast 2024-2029 ($ million)
- Data Table on In-home - Market size and forecast 2024-2029 ($ million)
- Chart on In-home - Year-over-year growth 2024-2029 (%)
- Data Table on In-home - Year-over-year growth 2024-2029 (%)
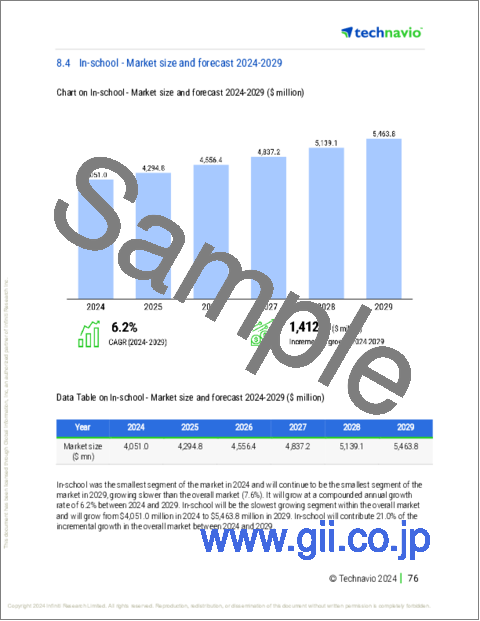
- 8.4 In-school - Market size and forecast 2024-2029
- Chart on In-school - Market size and forecast 2024-2029 ($ million)
- Data Table on In-school - Market size and forecast 2024-2029 ($ million)
- Chart on In-school - Year-over-year growth 2024-2029 (%)
- Data Table on In-school - Year-over-year growth 2024-2029 (%)
- 8.5 Market opportunity by Application
- Market opportunity by Application ($ million)
- Data Table on Market opportunity by Application ($ million)
9 Market Segmentation by Age Group
- 9.1 Market segments
- Chart on Age Group - Market share 2024-2029 (%)
- Data Table on Age Group - Market share 2024-2029 (%)
- 9.2 Comparison by Age Group
- Chart on Comparison by Age Group
- Data Table on Comparison by Age Group
- 9-10 years - Market size and forecast 2024-2029
- Chart on 9-10 years - Market size and forecast 2024-2029 ($ million)
- Data Table on 9-10 years - Market size and forecast 2024-2029 ($ million)
- Chart on 9-10 years - Year-over-year growth 2024-2029 (%)
- Data Table on 9-10 years - Year-over-year growth 2024-2029 (%)
- 6-8 years - Market size and forecast 2024-2029
- Chart on 6-8 years - Market size and forecast 2024-2029 ($ million)
- Data Table on 6-8 years - Market size and forecast 2024-2029 ($ million)
- Chart on 6-8 years - Year-over-year growth 2024-2029 (%)
- Data Table on 6-8 years - Year-over-year growth 2024-2029 (%)
- 11-13 years - Market size and forecast 2024-2029
- Chart on 11-13 years - Market size and forecast 2024-2029 ($ million)
- Data Table on 11-13 years - Market size and forecast 2024-2029 ($ million)
- Chart on 11-13 years - Year-over-year growth 2024-2029 (%)
- Data Table on 11-13 years - Year-over-year growth 2024-2029 (%)
- 9.6 Market opportunity by Age Group
- Market opportunity by Age Group ($ million)
- Data Table on Market opportunity by Age Group ($ million)
10 Market Segmentation by Subjects
- 10.1 Market segments
- Chart on Subjects - Market share 2024-2029 (%)
- Data Table on Subjects - Market share 2024-2029 (%)
- 10.2 Comparison by Subjects
- Chart on Comparison by Subjects
- Data Table on Comparison by Subjects
- 10.3 Science - Market size and forecast 2024-2029
- Chart on Science - Market size and forecast 2024-2029 ($ million)
- Data Table on Science - Market size and forecast 2024-2029 ($ million)
- Chart on Science - Year-over-year growth 2024-2029 (%)
- Data Table on Science - Year-over-year growth 2024-2029 (%)
- 10.4 Engineering - Market size and forecast 2024-2029
- Chart on Engineering - Market size and forecast 2024-2029 ($ million)
- Data Table on Engineering - Market size and forecast 2024-2029 ($ million)
- Chart on Engineering - Year-over-year growth 2024-2029 (%)
- Data Table on Engineering - Year-over-year growth 2024-2029 (%)
- 10.5 Mathematics - Market size and forecast 2024-2029
- Chart on Mathematics - Market size and forecast 2024-2029 ($ million)
- Data Table on Mathematics - Market size and forecast 2024-2029 ($ million)
- Chart on Mathematics - Year-over-year growth 2024-2029 (%)
- Data Table on Mathematics - Year-over-year growth 2024-2029 (%)
- 10.6 Technology - Market size and forecast 2024-2029
- Chart on Technology - Market size and forecast 2024-2029 ($ million)
- Data Table on Technology - Market size and forecast 2024-2029 ($ million)
- Chart on Technology - Year-over-year growth 2024-2029 (%)
- Data Table on Technology - Year-over-year growth 2024-2029 (%)
- 10.7 Market opportunity by Subjects
- Market opportunity by Subjects ($ million)
- Data Table on Market opportunity by Subjects ($ million)
11 Customer Landscape
- 11.1 Customer landscape overview
- Analysis of price sensitivity, lifecycle, customer purchase basket, adoption rates, and purchase criteria
12 Geographic Landscape
- 12.1 Geographic segmentation
- Chart on Market share By Geographical Landscape 2024-2029 (%)
- Data Table on Market share By Geographical Landscape 2024-2029 (%)
- 12.2 Geographic comparison
- Chart on Geographic comparison
- Data Table on Geographic comparison
- 12.3 APAC - Market size and forecast 2024-2029
- Chart on APAC - Market size and forecast 2024-2029 ($ million)
- Data Table on APAC - Market size and forecast 2024-2029 ($ million)
- Chart on APAC - Year-over-year growth 2024-2029 (%)
- Data Table on APAC - Year-over-year growth 2024-2029 (%)
- 12.4 North America - Market size and forecast 2024-2029
- Chart on North America - Market size and forecast 2024-2029 ($ million)
- Data Table on North America - Market size and forecast 2024-2029 ($ million)
- Chart on North America - Year-over-year growth 2024-2029 (%)
- Data Table on North America - Year-over-year growth 2024-2029 (%)
- 12.5 Europe - Market size and forecast 2024-2029
- Chart on Europe - Market size and forecast 2024-2029 ($ million)
- Data Table on Europe - Market size and forecast 2024-2029 ($ million)
- Chart on Europe - Year-over-year growth 2024-2029 (%)
- Data Table on Europe - Year-over-year growth 2024-2029 (%)
- 12.6 Middle East and Africa - Market size and forecast 2024-2029
- Chart on Middle East and Africa - Market size and forecast 2024-2029 ($ million)
- Data Table on Middle East and Africa - Market size and forecast 2024-2029 ($ million)
- Chart on Middle East and Africa - Year-over-year growth 2024-2029 (%)
- Data Table on Middle East and Africa - Year-over-year growth 2024-2029 (%)
- 12.7 South America - Market size and forecast 2024-2029
- Chart on South America - Market size and forecast 2024-2029 ($ million)
- Data Table on South America - Market size and forecast 2024-2029 ($ million)
- Chart on South America - Year-over-year growth 2024-2029 (%)
- Data Table on South America - Year-over-year growth 2024-2029 (%)
- 12.8 US - Market size and forecast 2024-2029
- Chart on US - Market size and forecast 2024-2029 ($ million)
- Data Table on US - Market size and forecast 2024-2029 ($ million)
- Chart on US - Year-over-year growth 2024-2029 (%)
- Data Table on US - Year-over-year growth 2024-2029 (%)
- 12.9 China - Market size and forecast 2024-2029
- Chart on China - Market size and forecast 2024-2029 ($ million)
- Data Table on China - Market size and forecast 2024-2029 ($ million)
- Chart on China - Year-over-year growth 2024-2029 (%)
- Data Table on China - Year-over-year growth 2024-2029 (%)
- 12.10 Japan - Market size and forecast 2024-2029
- Chart on Japan - Market size and forecast 2024-2029 ($ million)
- Data Table on Japan - Market size and forecast 2024-2029 ($ million)
- Chart on Japan - Year-over-year growth 2024-2029 (%)
- Data Table on Japan - Year-over-year growth 2024-2029 (%)
- 12.11 Germany - Market size and forecast 2024-2029
- Chart on Germany - Market size and forecast 2024-2029 ($ million)
- Data Table on Germany - Market size and forecast 2024-2029 ($ million)
- Chart on Germany - Year-over-year growth 2024-2029 (%)
- Data Table on Germany - Year-over-year growth 2024-2029 (%)
- 12.12 India - Market size and forecast 2024-2029
- Chart on India - Market size and forecast 2024-2029 ($ million)
- Data Table on India - Market size and forecast 2024-2029 ($ million)
- Chart on India - Year-over-year growth 2024-2029 (%)
- Data Table on India - Year-over-year growth 2024-2029 (%)
- 12.13 Canada - Market size and forecast 2024-2029
- Chart on Canada - Market size and forecast 2024-2029 ($ million)
- Data Table on Canada - Market size and forecast 2024-2029 ($ million)
- Chart on Canada - Year-over-year growth 2024-2029 (%)
- Data Table on Canada - Year-over-year growth 2024-2029 (%)
- 12.14 South Korea - Market size and forecast 2024-2029
- Chart on South Korea - Market size and forecast 2024-2029 ($ million)
- Data Table on South Korea - Market size and forecast 2024-2029 ($ million)
- Chart on South Korea - Year-over-year growth 2024-2029 (%)
- Data Table on South Korea - Year-over-year growth 2024-2029 (%)
- 12.15 UK - Market size and forecast 2024-2029
- Chart on UK - Market size and forecast 2024-2029 ($ million)
- Data Table on UK - Market size and forecast 2024-2029 ($ million)
- Chart on UK - Year-over-year growth 2024-2029 (%)
- Data Table on UK - Year-over-year growth 2024-2029 (%)
- 12.16 France - Market size and forecast 2024-2029
- Chart on France - Market size and forecast 2024-2029 ($ million)
- Data Table on France - Market size and forecast 2024-2029 ($ million)
- Chart on France - Year-over-year growth 2024-2029 (%)
- Data Table on France - Year-over-year growth 2024-2029 (%)
- 12.17 Italy - Market size and forecast 2024-2029
- Chart on Italy - Market size and forecast 2024-2029 ($ million)
- Data Table on Italy - Market size and forecast 2024-2029 ($ million)
- Chart on Italy - Year-over-year growth 2024-2029 (%)
- Data Table on Italy - Year-over-year growth 2024-2029 (%)
- 12.18 Market opportunity By Geographical Landscape
- Market opportunity By Geographical Landscape ($ million)
- Data Tables on Market opportunity By Geographical Landscape ($ million)
13 Drivers, Challenges, and Opportunity/Restraints
- 13.1 Market drivers
- 13.2 Market challenges
- 13.3 Impact of drivers and challenges
- Impact of drivers and challenges in 2024 and 2029
- 13.4 Market opportunities/restraints
14 Competitive Landscape
- 14.1 Overview
- 14.2 Competitive Landscape
- Overview on criticality of inputs and factors of differentiation
- 14.3 Landscape disruption
- Overview on factors of disruption
- 14.4 Industry risks
- Impact of key risks on business
15 Competitive Analysis
- 15.1 Companies profiled
- Companies covered
- 15.2 Company ranking index
- Company ranking index
- 15.3 Market positioning of companies
- Matrix on companies position and classification
- 15.4 Franckh Kosmos Verlags GmbH and Co. KG
- Franckh Kosmos Verlags GmbH and Co. KG - Overview
- Franckh Kosmos Verlags GmbH and Co. KG - Product / Service
- Franckh Kosmos Verlags GmbH and Co. KG - Key offerings
- SWOT
- 15.5 Fun Express LLC
- Fun Express LLC - Overview
- Fun Express LLC - Product / Service
- Fun Express LLC - Key offerings
- SWOT
- 15.6 Funvention Learning Pvt. Ltd.
- Funvention Learning Pvt. Ltd. - Overview
- Funvention Learning Pvt. Ltd. - Product / Service
- Funvention Learning Pvt. Ltd. - Key offerings
- SWOT
- 15.7 GoldieBlox Inc.
- GoldieBlox Inc. - Overview
- GoldieBlox Inc. - Product / Service
- GoldieBlox Inc. - Key offerings
- SWOT
- 15.8 Learning Resources Ltd.
- Learning Resources Ltd. - Overview
- Learning Resources Ltd. - Product / Service
- Learning Resources Ltd. - Key offerings
- SWOT
- 15.9 LEGO System AS
- LEGO System AS - Overview
- LEGO System AS - Product / Service
- LEGO System AS - Key news
- LEGO System AS - Key offerings
- SWOT
- 15.10 Makeblock Co. Ltd.
- Makeblock Co. Ltd. - Overview
- Makeblock Co. Ltd. - Product / Service
- Makeblock Co. Ltd. - Key offerings
- SWOT
- 15.11 Mattel Inc.
- Mattel Inc. - Overview
- Mattel Inc. - Business segments
- Mattel Inc. - Key news
- Mattel Inc. - Key offerings
- Mattel Inc. - Segment focus
- SWOT
- 15.12 Piper Learning Inc.
- Piper Learning Inc. - Overview
- Piper Learning Inc. - Product / Service
- Piper Learning Inc. - Key offerings
- SWOT
- 15.13 Scientifics Direct Inc.
- Scientifics Direct Inc. - Overview
- Scientifics Direct Inc. - Product / Service
- Scientifics Direct Inc. - Key offerings
- SWOT
- 15.14 Smartivity Labs Pvt. Ltd.
- Smartivity Labs Pvt. Ltd. - Overview
- Smartivity Labs Pvt. Ltd. - Product / Service
- Smartivity Labs Pvt. Ltd. - Key offerings
- SWOT
- 15.15 Sphero Inc.
- Sphero Inc. - Overview
- Sphero Inc. - Product / Service
- Sphero Inc. - Key news
- Sphero Inc. - Key offerings
- SWOT
- 15.16 Thimble
- Thimble - Overview
- Thimble - Product / Service
- Thimble - Key offerings
- SWOT
- 15.17 Tinkering Labs Inc.
- Tinkering Labs Inc. - Overview
- Tinkering Labs Inc. - Product / Service
- Tinkering Labs Inc. - Key offerings
- SWOT
- 15.18 Xinxiang Alpha Manufacturing Ltd.
- Xinxiang Alpha Manufacturing Ltd. - Overview
- Xinxiang Alpha Manufacturing Ltd. - Product / Service
- Xinxiang Alpha Manufacturing Ltd. - Key offerings
- SWOT
16 Appendix
- 16.1 Scope of the report
- 16.2 Inclusions and exclusions checklist
- Inclusions checklist
- Exclusions checklist
- 16.3 Currency conversion rates for US$
- Currency conversion rates for US$
- 16.4 Research methodology
- Research methodology
- 16.5 Data procurement
- Information sources
- 16.6 Data validation
- Data validation
- 16.7 Validation techniques employed for market sizing
- Validation techniques employed for market sizing
- 16.8 Data synthesis
- Data synthesis
- 16.9 360 degree market analysis
- 360 degree market analysis
- 16.10 List of abbreviations
- List of abbreviations
- o Strong financial performance
