|
|
市場調査レポート
商品コード
1937196
商用航空機リースの世界市場 2026年~2030年Global Commercial Aircraft Leasing Market 2026-2030 |
||||||
|
|||||||
カスタマイズ可能
|
|||||||

| 商用航空機リースの世界市場 2026年~2030年 |
|
出版日: 2026年02月11日
発行: TechNavio
ページ情報: 英文 298 Pages
納期: 即納可能
|

概要
世界の商用航空機リース市場は、2025年から2030年にかけて283億8,190万米ドルの成長が見込まれており、予測期間中のCAGRは11.3%と予測されています。
本レポートでは、世界の商用航空機リース市場に関する包括的な分析、市場規模と予測、動向、成長要因、課題に加え、約25社のベンダー分析を提供しております。
本レポートは、現在の市場状況、最新の動向と促進要因、市場環境全般に関する最新の分析を提供します。市場は、長距離路線回復に向けたワイドボディ機リースへの戦略的シフトの拡大、財務流動性とSLBブーム、加速する機材近代化、環境規制対応によって牽引されています。
本調査は、業界の主要関係者からの情報を含む一次情報と二次情報を客観的に組み合わせて実施されました。本レポートには、主要企業の分析に加え、包括的な市場規模データ、地域別分析を伴うセグメント、ベンダー情勢が含まれています。レポートには過去データと予測データが掲載されています。
| 市場範囲 | |
|---|---|
| 基準年 | 2026年 |
| 終了年 | 2030年 |
| 予測期間 | 2026年~2030年 |
| 成長モメンタム | 加速 |
| 前年比2026年 | 9.4% |
| CAGR | 11.3% |
| 増分額 | 283億8,190万米ドル |
本調査では、今後数年間における世界の商用航空機リース市場成長の主要な促進要因の一つとして、ワイドボディ機資産取得の戦略的復活を特定しております。また、サステナビリティ連動型ファイナンスの制度化とP2F(プッシュ・トゥ・フライ)転換の加速が、市場において相当な需要を生み出すものと見込まれます。
目次
第1章 エグゼクティブサマリー
第2章 Technavio分析
- 価格・ライフサイクル・顧客購入バスケット・採用率・購入基準の分析
- インプットの重要性と差別化の要因
- 混乱の要因
- 促進要因と課題の影響
第3章 市場情勢
- 市場エコシステム
- 市場の特徴
- バリューチェーン分析
第4章 市場規模
- 市場の定義
- 市場セグメント分析
- 市場規模、2025年
- 市場の見通し、2025年~2030年
第5章 市場規模実績
- 商用航空機リースの世界市場、2020年~2024年
- 製品セグメント分析、2020年~2024年
- タイプセグメント分析、2020年~2024年
- 用途セグメント分析、2020年~2024年
- 使用セグメント分析、2020年~2024年
- 地域別セグメント分析、2020年~2024年
- 国別セグメント分析、2020年~2024年
第6章 定性分析
- AIの影響:商用航空機リースの世界市場
第7章 ファイブフォース分析
- ファイブフォースの要約
- 買い手の交渉力
- 供給企業の交渉力
- 新規参入業者の脅威
- 代替品の脅威
- 競争の脅威
- 市況
第8章 市場セグメンテーション:製品別
- 比較:製品別
- ナローボディ機
- ワイドボディ機
- リージョナル機
- 市場機会:製品別
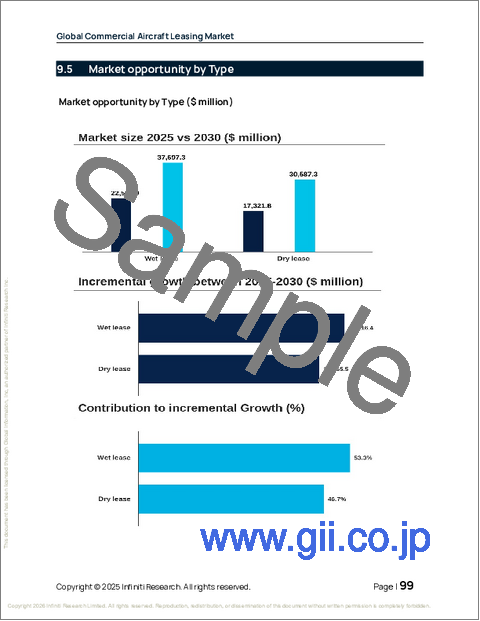
第9章 市場セグメンテーション:タイプ別
- 比較:タイプ別
- ウェットリース
- ドライリース
- 市場機会:タイプ別
第10章 市場セグメンテーション:用途別
- 比較:用途別
- 旅客
- 貨物輸送
- 市場機会:用途別
第11章 市場セグメンテーション:使用別
- 比較:使用別
- 短期
- 長期
- 市場機会:使用別
第12章 顧客情勢
第13章 地域別情勢
- 地域別セグメンテーション
- 地域別比較
- アジア太平洋
- 中国
- インド
- 日本
- シンガポール
- オーストラリア
- インドネシア
- 欧州
- アイルランド
- ドイツ
- 英国
- フランス
- オランダ
- スペイン
- 北米
- 米国
- カナダ
- メキシコ
- 南米
- ブラジル
- アルゼンチン
- チリ
- 中東・アフリカ
- アラブ首長国連邦
- サウジアラビア
- 南アフリカ
- エジプト
- トルコ
- 市場機会:地域別
第14章 促進要因・課題・機会
- 市場促進要因
- 市場の課題
- 促進要因と課題の影響
- 市場機会
第15章 競合情勢
- 概要
- 競合情勢
- 混乱の状況
- 業界のリスク
第16章 競合分析
- 企業プロファイル
- 企業ランキング指標
- 企業の市場ポジショニング
- AerCap Holdings N.V.
- Air Lease Corp.
- Aircastle Ltd.
- Aviation Capital Group
- Avolon Aerospace Leasing Ltd.
- Azorra Aviation Holdings LLC
- BBAM US LP
- BOC Aviation Ltd.
- CDB Aviation
- Deucalion Aviation Ltd.
- Jackson Square Aviation LLC
- Macquarie Group Ltd.
- SMBC Aviation Capital Ltd.
- The Carlyle Group Inc.
- TrueNoord
