|
|
市場調査レポート
商品コード
1626702
半導体先進パッケージングの世界市場 2025-2029年Global Semiconductor Advanced Packaging Market 2025-2029 |
||||||

|
|||||||
カスタマイズ可能
|
|||||||


| 半導体先進パッケージングの世界市場 2025-2029年 |
|
出版日: 2024年12月18日
発行: TechNavio
ページ情報: 英文 214 Pages
納期: 即納可能
|

全表示
- 概要
- 図表
- 目次
半導体先進パッケージング市場 2025-2029年
半導体先進パッケージング市場は2024-2029年に293億3,000万米ドル、予測期間中のCAGRは9.8%で成長すると予測されます。当レポートでは、半導体先進パッケージング市場の全体的な分析、市場規模・予測、動向、成長促進要因、課題、約25のベンダーを網羅したベンダー分析などを掲載しています。
現在の市場シナリオ、最新動向と促進要因、市場環境全体に関する最新分析を提供しています。市場は、複雑な半導体IC設計、3DチップパッケージングとFOWLP技術の開発、小型電子機器への需要の高まりによって牽引されています。
| 市場範囲 | |
|---|---|
| 基準年 | 2025 |
| 終了年 | 2029 |
| 予測期間 | 2025-2029 |
| 成長モメンタム | 加速 |
| 前年比2025年 | 8.7% |
| CAGR | 9.8% |
| 増分額 | 293億3,000万米ドル |
本調査では、今後数年間の半導体先進パッケージング市場成長を牽引する主な要因の一つとして、自動車への半導体部品の搭載を挙げています。また、モバイルデバイスの製品ライフサイクルの短さと、OSATベンダーの増加が市場の大きな需要につながります。
目次
第1章 エグゼクティブサマリー
- 市場概要
第2章 Technavio別分析
- 価格・ライフサイクル・顧客購入バスケット・採用率・購入基準の分析
- インプットの重要性と差別化の要因
- 混乱の要因
- 促進要因と課題の影響
第3章 市場情勢
- 市場エコシステム
- 市場の特徴
- バリューチェーン分析
第4章 市場規模
- 市場の定義
- 市場セグメント分析
- 市場規模 2024
- 市場の見通し 2024-2029
第5章 市場規模実績
- 半導体先進パッケージングの世界市場 2019-2023
- デバイス別セグメント分析 2019-2023
- 技術別セグメント分析 2019-2023
- 地域別セグメント分析 2019-2023
- 国別セグメント分析 2019-2023
第6章 定性分析
- AIの影響半導体先進パッケージングの世界市場
第7章 ファイブフォース分析
- ファイブフォースの要約
- 買い手の交渉力
- 供給企業の交渉力
- 新規参入業者の脅威
- 代替品の脅威
- 競争の脅威
- 市況
第8章 市場セグメンテーション:デバイス別
- 市場セグメント
- 比較:デバイス別
- アナログとミックスIC:市場規模と予測 2024-2029
- MEMSとセンサー:市場規模と予測 2024-2029
- ロジックとメモリデバイス:市場規模と予測 2024-2029
- ワイヤレス接続デバイス:市場規模と予測 2024-2029
- CMOSイメージセンサー:市場規模と予測 2024-2029
- 市場機会:デバイス別
第9章 市場セグメンテーション:技術別
- 市場セグメント
- 比較:技術別
- フリップチップ:市場規模と予測 2024-2029
- FIWLP:市場規模と予測 2024-2029
- 3D:市場規模と予測 2024-2029
- FOWLP:市場規模と予測 2024-2029
- 市場機会:技術別
第10章 顧客情勢
- 顧客情勢の概要
第11章 地域別情勢
- 地域別セグメンテーション
- 地域別比較
- アジア太平洋:市場規模と予測 2024-2029
- 北米:市場規模と予測 2024-2029
- 欧州:市場規模と予測 2024-2029
- 南米:市場規模と予測 2024-2029
- 中東・アフリカ:市場規模と予測 2024-2029
- 米国:市場規模と予測 2024-2029
- 日本:市場規模と予測 2024-2029
- 中国:市場規模と予測 2024-2029
- ドイツ:市場規模と予測 2024-2029
- フランス:市場規模と予測 2024-2029
- インド:市場規模と予測 2024-2029
- カナダ:市場規模と予測 2024-2029
- ブラジル:市場規模と予測 2024-2029
- 英国:市場規模と予測 2024-2029
- スペイン:市場規模と予測 2024-2029
- 市場機会:地域情勢別
第12章 促進要因・課題・機会・抑制要因
- 市場促進要因
- 市場の課題
- 促進要因と課題の影響
- 市場の機会・抑制要因
第13章 競合情勢
- 概要
- 競合情勢
- 混乱の状況
- 業界のリスク
第14章 競合分析
- 企業プロファイル
- 企業ランキング指数
- 企業の市場ポジショニング
- Amkor Technology Inc.
- ASE Technology Holding Co. Ltd.
- Cactus Materials Inc.
- China Wafer Level CSP Co. Ltd.
- ChipMOS TECHNOLOGIES INC.
- HANA Micron Co. Ltd.
- Jiangsu Changdian Technology Co. Ltd.
- King Yuan Electronics Co. Ltd.
- nepes Corp.
- Powertech Technology Inc.
- Samsung Electronics Co. Ltd.
- SIGNETICS Corp.
- Taiwan Semiconductor Manufacturing Co. Ltd.
- UTAC Holdings Ltd.
- Veeco Instruments Inc.
第15章 付録
Exhibits:
- Exhibits1: Executive Summary - Chart on Market Overview
- Exhibits2: Executive Summary - Data Table on Market Overview
- Exhibits3: Executive Summary - Chart on Global Market Characteristics
- Exhibits4: Executive Summary - Chart on Market By Geographical Landscape
- Exhibits5: Executive Summary - Chart on Market Segmentation by Device
- Exhibits6: Executive Summary - Chart on Market Segmentation by Technology
- Exhibits7: Executive Summary - Chart on Incremental Growth
- Exhibits8: Executive Summary - Data Table on Incremental Growth
- Exhibits9: Executive Summary - Chart on Company Market Positioning
- Exhibits10: Analysis of price sensitivity, lifecycle, customer purchase basket, adoption rates, and purchase criteria
- Exhibits11: Overview on criticality of inputs and factors of differentiation
- Exhibits12: Overview on factors of disruption
- Exhibits13: Impact of drivers and challenges in 2024 and 2029
- Exhibits14: Parent Market
- Exhibits15: Data Table on - Parent Market
- Exhibits16: Market characteristics analysis
- Exhibits17: Value chain analysis
- Exhibits18: Offerings of companies included in the market definition
- Exhibits19: Market segments
- Exhibits20: Chart on Global - Market size and forecast 2024-2029 ($ billion)
- Exhibits21: Data Table on Global - Market size and forecast 2024-2029 ($ billion)
- Exhibits22: Chart on Global Market: Year-over-year growth 2024-2029 (%)
- Exhibits23: Data Table on Global Market: Year-over-year growth 2024-2029 (%)
- Exhibits24: Historic Market Size - Data Table on Global Semiconductor Advanced Packaging Market 2019 - 2023 ($ billion)
- Exhibits25: Historic Market Size - Device Segment 2019 - 2023 ($ billion)
- Exhibits26: Historic Market Size - Technology Segment 2019 - 2023 ($ billion)
- Exhibits27: Historic Market Size - Geography Segment 2019 - 2023 ($ billion)
- Exhibits28: Historic Market Size - Country Segment 2019 - 2023 ($ billion)
- Exhibits29: Five forces analysis - Comparison between 2024 and 2029
- Exhibits30: Bargaining power of buyers - Impact of key factors 2024 and 2029
- Exhibits31: Bargaining power of suppliers - Impact of key factors in 2024 and 2029
- Exhibits32: Threat of new entrants - Impact of key factors in 2024 and 2029
- Exhibits33: Threat of substitutes - Impact of key factors in 2024 and 2029
- Exhibits34: Threat of rivalry - Impact of key factors in 2024 and 2029
- Exhibits35: Chart on Market condition - Five forces 2024 and 2029
- Exhibits36: Chart on Device - Market share 2024-2029 (%)
- Exhibits37: Data Table on Device - Market share 2024-2029 (%)
- Exhibits38: Chart on Comparison by Device
- Exhibits39: Data Table on Comparison by Device
- Exhibits40: Chart on Analog and mixed ICs - Market size and forecast 2024-2029 ($ billion)
- Exhibits41: Data Table on Analog and mixed ICs - Market size and forecast 2024-2029 ($ billion)
- Exhibits42: Chart on Analog and mixed ICs - Year-over-year growth 2024-2029 (%)
- Exhibits43: Data Table on Analog and mixed ICs - Year-over-year growth 2024-2029 (%)
- Exhibits44: Chart on MEMS and sensors - Market size and forecast 2024-2029 ($ billion)
- Exhibits45: Data Table on MEMS and sensors - Market size and forecast 2024-2029 ($ billion)
- Exhibits46: Chart on MEMS and sensors - Year-over-year growth 2024-2029 (%)
- Exhibits47: Data Table on MEMS and sensors - Year-over-year growth 2024-2029 (%)
- Exhibits48: Chart on Logic and memory devices - Market size and forecast 2024-2029 ($ billion)
- Exhibits49: Data Table on Logic and memory devices - Market size and forecast 2024-2029 ($ billion)
- Exhibits50: Chart on Logic and memory devices - Year-over-year growth 2024-2029 (%)
- Exhibits51: Data Table on Logic and memory devices - Year-over-year growth 2024-2029 (%)
- Exhibits52: Chart on Wireless connectivity devices - Market size and forecast 2024-2029 ($ billion)
- Exhibits53: Data Table on Wireless connectivity devices - Market size and forecast 2024-2029 ($ billion)
- Exhibits54: Chart on Wireless connectivity devices - Year-over-year growth 2024-2029 (%)
- Exhibits55: Data Table on Wireless connectivity devices - Year-over-year growth 2024-2029 (%)
- Exhibits56: Chart on CMOS image sensors - Market size and forecast 2024-2029 ($ billion)
- Exhibits57: Data Table on CMOS image sensors - Market size and forecast 2024-2029 ($ billion)
- Exhibits58: Chart on CMOS image sensors - Year-over-year growth 2024-2029 (%)
- Exhibits59: Data Table on CMOS image sensors - Year-over-year growth 2024-2029 (%)
- Exhibits60: Market opportunity by Device ($ billion)
- Exhibits61: Data Table on Market opportunity by Device ($ billion)
- Exhibits62: Chart on Technology - Market share 2024-2029 (%)
- Exhibits63: Data Table on Technology - Market share 2024-2029 (%)
- Exhibits64: Chart on Comparison by Technology
- Exhibits65: Data Table on Comparison by Technology
- Exhibits66: Chart on Flip chip - Market size and forecast 2024-2029 ($ billion)
- Exhibits67: Data Table on Flip chip - Market size and forecast 2024-2029 ($ billion)
- Exhibits68: Chart on Flip chip - Year-over-year growth 2024-2029 (%)
- Exhibits69: Data Table on Flip chip - Year-over-year growth 2024-2029 (%)
- Exhibits70: Chart on FI WLP - Market size and forecast 2024-2029 ($ billion)
- Exhibits71: Data Table on FI WLP - Market size and forecast 2024-2029 ($ billion)
- Exhibits72: Chart on FI WLP - Year-over-year growth 2024-2029 (%)
- Exhibits73: Data Table on FI WLP - Year-over-year growth 2024-2029 (%)
- Exhibits74: Chart on 2.5D/3D - Market size and forecast 2024-2029 ($ billion)
- Exhibits75: Data Table on 2.5D/3D - Market size and forecast 2024-2029 ($ billion)
- Exhibits76: Chart on 2.5D/3D - Year-over-year growth 2024-2029 (%)
- Exhibits77: Data Table on 2.5D/3D - Year-over-year growth 2024-2029 (%)
- Exhibits78: Chart on FO WLP - Market size and forecast 2024-2029 ($ billion)
- Exhibits79: Data Table on FO WLP - Market size and forecast 2024-2029 ($ billion)
- Exhibits80: Chart on FO WLP - Year-over-year growth 2024-2029 (%)
- Exhibits81: Data Table on FO WLP - Year-over-year growth 2024-2029 (%)
- Exhibits82: Market opportunity by Technology ($ billion)
- Exhibits83: Data Table on Market opportunity by Technology ($ billion)
- Exhibits84: Analysis of price sensitivity, lifecycle, customer purchase basket, adoption rates, and purchase criteria
- Exhibits85: Chart on Market share By Geographical Landscape 2024-2029 (%)
- Exhibits86: Data Table on Market share By Geographical Landscape 2024-2029 (%)
- Exhibits87: Chart on Geographic comparison
- Exhibits88: Data Table on Geographic comparison
- Exhibits89: Chart on APAC - Market size and forecast 2024-2029 ($ billion)
- Exhibits90: Data Table on APAC - Market size and forecast 2024-2029 ($ billion)
- Exhibits91: Chart on APAC - Year-over-year growth 2024-2029 (%)
- Exhibits92: Data Table on APAC - Year-over-year growth 2024-2029 (%)
- Exhibits93: Chart on North America - Market size and forecast 2024-2029 ($ billion)
- Exhibits94: Data Table on North America - Market size and forecast 2024-2029 ($ billion)
- Exhibits95: Chart on North America - Year-over-year growth 2024-2029 (%)
- Exhibits96: Data Table on North America - Year-over-year growth 2024-2029 (%)
- Exhibits97: Chart on Europe - Market size and forecast 2024-2029 ($ billion)
- Exhibits98: Data Table on Europe - Market size and forecast 2024-2029 ($ billion)
- Exhibits99: Chart on Europe - Year-over-year growth 2024-2029 (%)
- Exhibits100: Data Table on Europe - Year-over-year growth 2024-2029 (%)
- Exhibits101: Chart on South America - Market size and forecast 2024-2029 ($ billion)
- Exhibits102: Data Table on South America - Market size and forecast 2024-2029 ($ billion)
- Exhibits103: Chart on South America - Year-over-year growth 2024-2029 (%)
- Exhibits104: Data Table on South America - Year-over-year growth 2024-2029 (%)
- Exhibits105: Chart on Middle East and Africa - Market size and forecast 2024-2029 ($ billion)
- Exhibits106: Data Table on Middle East and Africa - Market size and forecast 2024-2029 ($ billion)
- Exhibits107: Chart on Middle East and Africa - Year-over-year growth 2024-2029 (%)
- Exhibits108: Data Table on Middle East and Africa - Year-over-year growth 2024-2029 (%)
- Exhibits109: Chart on US - Market size and forecast 2024-2029 ($ billion)
- Exhibits110: Data Table on US - Market size and forecast 2024-2029 ($ billion)
- Exhibits111: Chart on US - Year-over-year growth 2024-2029 (%)
- Exhibits112: Data Table on US - Year-over-year growth 2024-2029 (%)
- Exhibits113: Chart on Japan - Market size and forecast 2024-2029 ($ billion)
- Exhibits114: Data Table on Japan - Market size and forecast 2024-2029 ($ billion)
- Exhibits115: Chart on Japan - Year-over-year growth 2024-2029 (%)
- Exhibits116: Data Table on Japan - Year-over-year growth 2024-2029 (%)
- Exhibits117: Chart on China - Market size and forecast 2024-2029 ($ billion)
- Exhibits118: Data Table on China - Market size and forecast 2024-2029 ($ billion)
- Exhibits119: Chart on China - Year-over-year growth 2024-2029 (%)
- Exhibits120: Data Table on China - Year-over-year growth 2024-2029 (%)
- Exhibits121: Chart on Germany - Market size and forecast 2024-2029 ($ billion)
- Exhibits122: Data Table on Germany - Market size and forecast 2024-2029 ($ billion)
- Exhibits123: Chart on Germany - Year-over-year growth 2024-2029 (%)
- Exhibits124: Data Table on Germany - Year-over-year growth 2024-2029 (%)
- Exhibits125: Chart on France - Market size and forecast 2024-2029 ($ billion)
- Exhibits126: Data Table on France - Market size and forecast 2024-2029 ($ billion)
- Exhibits127: Chart on France - Year-over-year growth 2024-2029 (%)
- Exhibits128: Data Table on France - Year-over-year growth 2024-2029 (%)
- Exhibits129: Chart on India - Market size and forecast 2024-2029 ($ billion)
- Exhibits130: Data Table on India - Market size and forecast 2024-2029 ($ billion)
- Exhibits131: Chart on India - Year-over-year growth 2024-2029 (%)
- Exhibits132: Data Table on India - Year-over-year growth 2024-2029 (%)
- Exhibits133: Chart on Canada - Market size and forecast 2024-2029 ($ billion)
- Exhibits134: Data Table on Canada - Market size and forecast 2024-2029 ($ billion)
- Exhibits135: Chart on Canada - Year-over-year growth 2024-2029 (%)
- Exhibits136: Data Table on Canada - Year-over-year growth 2024-2029 (%)
- Exhibits137: Chart on Brazil - Market size and forecast 2024-2029 ($ billion)
- Exhibits138: Data Table on Brazil - Market size and forecast 2024-2029 ($ billion)
- Exhibits139: Chart on Brazil - Year-over-year growth 2024-2029 (%)
- Exhibits140: Data Table on Brazil - Year-over-year growth 2024-2029 (%)
- Exhibits141: Chart on UK - Market size and forecast 2024-2029 ($ billion)
- Exhibits142: Data Table on UK - Market size and forecast 2024-2029 ($ billion)
- Exhibits143: Chart on UK - Year-over-year growth 2024-2029 (%)
- Exhibits144: Data Table on UK - Year-over-year growth 2024-2029 (%)
- Exhibits145: Chart on Spain - Market size and forecast 2024-2029 ($ billion)
- Exhibits146: Data Table on Spain - Market size and forecast 2024-2029 ($ billion)
- Exhibits147: Chart on Spain - Year-over-year growth 2024-2029 (%)
- Exhibits148: Data Table on Spain - Year-over-year growth 2024-2029 (%)
- Exhibits149: Market opportunity By Geographical Landscape ($ billion)
- Exhibits150: Data Tables on Market opportunity By Geographical Landscape ($ billion)
- Exhibits151: Impact of drivers and challenges in 2024 and 2029
- Exhibits152: Overview on criticality of inputs and factors of differentiation
- Exhibits153: Overview on factors of disruption
- Exhibits154: Impact of key risks on business
- Exhibits155: Companies covered
- Exhibits156: Company ranking index
- Exhibits157: Matrix on companies position and classification
- Exhibits158: Amkor Technology Inc. - Overview
- Exhibits159: Amkor Technology Inc. - Business segments
- Exhibits160: Amkor Technology Inc. - Key news
- Exhibits161: Amkor Technology Inc. - Key offerings
- Exhibits162: Amkor Technology Inc. - Segment focus
- Exhibits163: SWOT
- Exhibits164: ASE Technology Holding Co. Ltd. - Overview
- Exhibits165: ASE Technology Holding Co. Ltd. - Business segments
- Exhibits166: ASE Technology Holding Co. Ltd. - Key offerings
- Exhibits167: ASE Technology Holding Co. Ltd. - Segment focus
- Exhibits168: SWOT
- Exhibits169: Cactus Materials Inc. - Overview
- Exhibits170: Cactus Materials Inc. - Product / Service
- Exhibits171: Cactus Materials Inc. - Key offerings
- Exhibits172: SWOT
- Exhibits173: China Wafer Level CSP Co. Ltd. - Overview
- Exhibits174: China Wafer Level CSP Co. Ltd. - Product / Service
- Exhibits175: China Wafer Level CSP Co. Ltd. - Key offerings
- Exhibits176: SWOT
- Exhibits177: ChipMOS TECHNOLOGIES INC. - Overview
- Exhibits178: ChipMOS TECHNOLOGIES INC. - Business segments
- Exhibits179: ChipMOS TECHNOLOGIES INC. - Key offerings
- Exhibits180: ChipMOS TECHNOLOGIES INC. - Segment focus
- Exhibits181: SWOT
- Exhibits182: HANA Micron Co. Ltd. - Overview
- Exhibits183: HANA Micron Co. Ltd. - Product / Service
- Exhibits184: HANA Micron Co. Ltd. - Key offerings
- Exhibits185: SWOT
- Exhibits186: Jiangsu Changdian Technology Co. Ltd. - Overview
- Exhibits187: Jiangsu Changdian Technology Co. Ltd. - Product / Service
- Exhibits188: Jiangsu Changdian Technology Co. Ltd. - Key offerings
- Exhibits189: SWOT
- Exhibits190: King Yuan Electronics Co. Ltd. - Overview
- Exhibits191: King Yuan Electronics Co. Ltd. - Product / Service
- Exhibits192: King Yuan Electronics Co. Ltd. - Key offerings
- Exhibits193: SWOT
- Exhibits194: nepes Corp. - Overview
- Exhibits195: nepes Corp. - Product / Service
- Exhibits196: nepes Corp. - Key offerings
- Exhibits197: SWOT
- Exhibits198: Powertech Technology Inc. - Overview
- Exhibits199: Powertech Technology Inc. - Business segments
- Exhibits200: Powertech Technology Inc. - Key offerings
- Exhibits201: Powertech Technology Inc. - Segment focus
- Exhibits202: SWOT
- Exhibits203: Samsung Electronics Co. Ltd. - Overview
- Exhibits204: Samsung Electronics Co. Ltd. - Business segments
- Exhibits205: Samsung Electronics Co. Ltd. - Key news
- Exhibits206: Samsung Electronics Co. Ltd. - Key offerings
- Exhibits207: Samsung Electronics Co. Ltd. - Segment focus
- Exhibits208: SWOT
- Exhibits209: SIGNETICS Corp. - Overview
- Exhibits210: SIGNETICS Corp. - Product / Service
- Exhibits211: SIGNETICS Corp. - Key offerings
- Exhibits212: SWOT
- Exhibits213: Taiwan Semiconductor Manufacturing Co. Ltd. - Overview
- Exhibits214: Taiwan Semiconductor Manufacturing Co. Ltd. - Product / Service
- Exhibits215: Taiwan Semiconductor Manufacturing Co. Ltd. - Key news
- Exhibits216: Taiwan Semiconductor Manufacturing Co. Ltd. - Key offerings
- Exhibits217: SWOT
- Exhibits218: UTAC Holdings Ltd. - Overview
- Exhibits219: UTAC Holdings Ltd. - Product / Service
- Exhibits220: UTAC Holdings Ltd. - Key offerings
- Exhibits221: SWOT
- Exhibits222: Veeco Instruments Inc. - Overview
- Exhibits223: Veeco Instruments Inc. - Product / Service
- Exhibits224: Veeco Instruments Inc. - Key offerings
- Exhibits225: SWOT
- Exhibits226: Inclusions checklist
- Exhibits227: Exclusions che
Semiconductor Advanced Packaging Market 2025-2029
The semiconductor advanced packaging market is forecasted to grow by USD 29.33 bn during 2024-2029, accelerating at a CAGR of 9.8% during the forecast period. The report on the semiconductor advanced packaging market provides a holistic analysis, market size and forecast, trends, growth drivers, and challenges, as well as vendor analysis covering around 25 vendors.
The report offers an up-to-date analysis regarding the current market scenario, the latest trends and drivers, and the overall market environment. The market is driven by complex semiconductor ic designs, development of 3d chip packaging and fo wlp technology, and growing demand for compact electronic devices.
| Market Scope | |
|---|---|
| Base Year | 2025 |
| End Year | 2029 |
| Series Year | 2025-2029 |
| Growth Momentum | Accelerate |
| YOY 2025 | 8.7% |
| CAGR | 9.8% |
| Incremental Value | $29.33 bn |
Technavio's semiconductor advanced packaging market is segmented as below:
By Device
- Analog and mixed ICs
- MEMS and sensors
- Logic and memory devices
- Wireless connectivity devices
- CMOS image sensors
By Technology
- Flip chip
- FI WLP
- 2.5D/3D
- FO WLP
By Geographical Landscape
- APAC
- North America
- Europe
- South America
- Middle East and Africa
This study identifies the integration of semiconductor components in vehicles as one of the prime reasons driving the semiconductor advanced packaging market growth during the next few years. Also, short product lifecycle of mobile devices and increase in number of osat vendors will lead to sizable demand in the market.
The report on the semiconductor advanced packaging market covers the following areas:
- Semiconductor Advanced Packaging Market sizing
- Semiconductor Advanced Packaging Market forecast
- Semiconductor Advanced Packaging Market industry analysis
The robust vendor analysis is designed to help clients improve their market position, and in line with this, this report provides a detailed analysis of several leading semiconductor advanced packaging market vendors that include Amkor Technology Inc., ASE Technology Holding Co. Ltd., Cactus Materials Inc., China Wafer Level CSP Co. Ltd., ChipMOS TECHNOLOGIES INC., HANA Micron Co. Ltd., Intel Corp., Jiangsu Changdian Technology Co. Ltd., King Yuan Electronics Co. Ltd., Microchip Technology Inc., nepes Corp., Powertech Technology Inc., Renesas Electronics Corp., Samsung Electronics Co. Ltd., SIGNETICS Corp., Taiwan Semiconductor Manufacturing Co. Ltd., Tongfu Microelectronics Co., Toshiba Corp., UTAC Holdings Ltd., and Veeco Instruments Inc.. Also, the semiconductor advanced packaging market analysis report includes information on upcoming trends and challenges that will influence market growth. This is to help companies strategize and leverage all forthcoming growth opportunities.
The study was conducted using an objective combination of primary and secondary information including inputs from key participants in the industry. The report contains a comprehensive market and vendor landscape in addition to an analysis of the key vendors.
The publisher presents a detailed picture of the market by the way of study, synthesis, and summation of data from multiple sources by an analysis of key parameters such as profit, pricing, competition, and promotions. It presents various market facets by identifying the key industry influencers. The data presented is comprehensive, reliable, and a result of extensive primary and secondary research. The market research reports provide a complete competitive landscape and an in-depth vendor selection methodology and analysis using qualitative and quantitative research to forecast accurate market growth.
Table of Contents
1 Executive Summary
- 1.1 Market overview
- Executive Summary - Chart on Market Overview
- Executive Summary - Data Table on Market Overview
- Executive Summary - Chart on Global Market Characteristics
- Executive Summary - Chart on Market By Geographical Landscape
- Executive Summary - Chart on Market Segmentation by Device
- Executive Summary - Chart on Market Segmentation by Technology
- Executive Summary - Chart on Incremental Growth
- Executive Summary - Data Table on Incremental Growth
- Executive Summary - Chart on Company Market Positioning
2 Technavio Analysis
- 2.1 Analysis of price sensitivity, lifecycle, customer purchase basket, adoption rates, and purchase criteria
- Analysis of price sensitivity, lifecycle, customer purchase basket, adoption rates, and purchase criteria
- 2.2 Criticality of inputs and Factors of differentiation
- Overview on criticality of inputs and factors of differentiation
- 2.3 Factors of disruption
- Overview on factors of disruption
- 2.4 Impact of drivers and challenges
- Impact of drivers and challenges in 2024 and 2029
3 Market Landscape
- 3.1 Market ecosystem
- Parent Market
- Data Table on - Parent Market
- 3.2 Market characteristics
- Market characteristics analysis
- 3.3 Value chain analysis
- Value chain analysis
4 Market Sizing
- 4.1 Market definition
- Offerings of companies included in the market definition
- 4.2 Market segment analysis
- Market segments
- 4.3 Market size 2024
- 4.4 Market outlook: Forecast for 2024-2029
- Chart on Global - Market size and forecast 2024-2029 ($ billion)
- Data Table on Global - Market size and forecast 2024-2029 ($ billion)
- Chart on Global Market: Year-over-year growth 2024-2029 (%)
- Data Table on Global Market: Year-over-year growth 2024-2029 (%)
5 Historic Market Size
- 5.1 Global Semiconductor Advanced Packaging Market 2019 - 2023
- Historic Market Size - Data Table on Global Semiconductor Advanced Packaging Market 2019 - 2023 ($ billion)
- 5.2 Device segment analysis 2019 - 2023
- Historic Market Size - Device Segment 2019 - 2023 ($ billion)
- 5.3 Technology segment analysis 2019 - 2023
- Historic Market Size - Technology Segment 2019 - 2023 ($ billion)
- 5.4 Geography segment analysis 2019 - 2023
- Historic Market Size - Geography Segment 2019 - 2023 ($ billion)
- 5.5 Country segment analysis 2019 - 2023
- Historic Market Size - Country Segment 2019 - 2023 ($ billion)
6 Qualitative Analysis
- 6.1 Impact of AI in global semiconductor advanced packaging market
7 Five Forces Analysis
- 7.1 Five forces summary
- Five forces analysis - Comparison between 2024 and 2029
- 7.2 Bargaining power of buyers
- Bargaining power of buyers - Impact of key factors 2024 and 2029
- 7.3 Bargaining power of suppliers
- Bargaining power of suppliers - Impact of key factors in 2024 and 2029
- 7.4 Threat of new entrants
- Threat of new entrants - Impact of key factors in 2024 and 2029
- 7.5 Threat of substitutes
- Threat of substitutes - Impact of key factors in 2024 and 2029
- 7.6 Threat of rivalry
- Threat of rivalry - Impact of key factors in 2024 and 2029
- 7.7 Market condition
- Chart on Market condition - Five forces 2024 and 2029
8 Market Segmentation by Device
- 8.1 Market segments
- Chart on Device - Market share 2024-2029 (%)
- Data Table on Device - Market share 2024-2029 (%)
- 8.2 Comparison by Device
- Chart on Comparison by Device
- Data Table on Comparison by Device
- 8.3 Analog and mixed ICs - Market size and forecast 2024-2029
- Chart on Analog and mixed ICs - Market size and forecast 2024-2029 ($ billion)
- Data Table on Analog and mixed ICs - Market size and forecast 2024-2029 ($ billion)
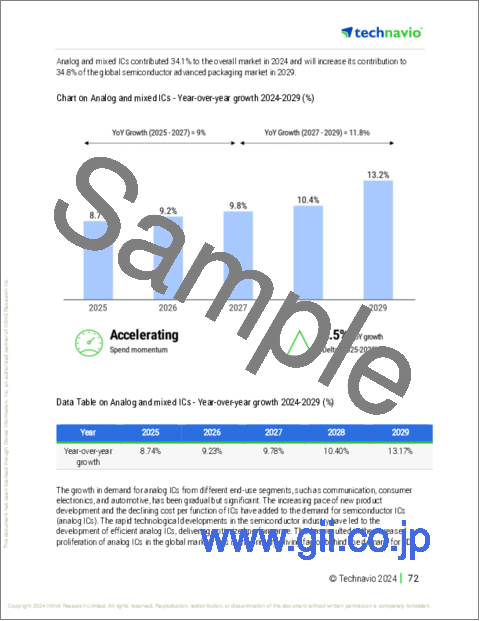
- Chart on Analog and mixed ICs - Year-over-year growth 2024-2029 (%)
- Data Table on Analog and mixed ICs - Year-over-year growth 2024-2029 (%)
- 8.4 MEMS and sensors - Market size and forecast 2024-2029
- Chart on MEMS and sensors - Market size and forecast 2024-2029 ($ billion)
- Data Table on MEMS and sensors - Market size and forecast 2024-2029 ($ billion)
- Chart on MEMS and sensors - Year-over-year growth 2024-2029 (%)
- Data Table on MEMS and sensors - Year-over-year growth 2024-2029 (%)
- 8.5 Logic and memory devices - Market size and forecast 2024-2029
- Chart on Logic and memory devices - Market size and forecast 2024-2029 ($ billion)
- Data Table on Logic and memory devices - Market size and forecast 2024-2029 ($ billion)
- Chart on Logic and memory devices - Year-over-year growth 2024-2029 (%)
- Data Table on Logic and memory devices - Year-over-year growth 2024-2029 (%)
- 8.6 Wireless connectivity devices - Market size and forecast 2024-2029
- Chart on Wireless connectivity devices - Market size and forecast 2024-2029 ($ billion)
- Data Table on Wireless connectivity devices - Market size and forecast 2024-2029 ($ billion)
- Chart on Wireless connectivity devices - Year-over-year growth 2024-2029 (%)
- Data Table on Wireless connectivity devices - Year-over-year growth 2024-2029 (%)
- 8.7 CMOS image sensors - Market size and forecast 2024-2029
- Chart on CMOS image sensors - Market size and forecast 2024-2029 ($ billion)
- Data Table on CMOS image sensors - Market size and forecast 2024-2029 ($ billion)
- Chart on CMOS image sensors - Year-over-year growth 2024-2029 (%)
- Data Table on CMOS image sensors - Year-over-year growth 2024-2029 (%)
- 8.8 Market opportunity by Device
- Market opportunity by Device ($ billion)
- Data Table on Market opportunity by Device ($ billion)
9 Market Segmentation by Technology
- 9.1 Market segments
- Chart on Technology - Market share 2024-2029 (%)
- Data Table on Technology - Market share 2024-2029 (%)
- 9.2 Comparison by Technology
- Chart on Comparison by Technology
- Data Table on Comparison by Technology
- 9.3 Flip chip - Market size and forecast 2024-2029
- Chart on Flip chip - Market size and forecast 2024-2029 ($ billion)
- Data Table on Flip chip - Market size and forecast 2024-2029 ($ billion)
- Chart on Flip chip - Year-over-year growth 2024-2029 (%)
- Data Table on Flip chip - Year-over-year growth 2024-2029 (%)
- 9.4 FI WLP - Market size and forecast 2024-2029
- Chart on FI WLP - Market size and forecast 2024-2029 ($ billion)
- Data Table on FI WLP - Market size and forecast 2024-2029 ($ billion)
- Chart on FI WLP - Year-over-year growth 2024-2029 (%)
- Data Table on FI WLP - Year-over-year growth 2024-2029 (%)
- 2.5D/3D - Market size and forecast 2024-2029
- Chart on 2.5D/3D - Market size and forecast 2024-2029 ($ billion)
- Data Table on 2.5D/3D - Market size and forecast 2024-2029 ($ billion)
- Chart on 2.5D/3D - Year-over-year growth 2024-2029 (%)
- Data Table on 2.5D/3D - Year-over-year growth 2024-2029 (%)
- 9.6 FO WLP - Market size and forecast 2024-2029
- Chart on FO WLP - Market size and forecast 2024-2029 ($ billion)
- Data Table on FO WLP - Market size and forecast 2024-2029 ($ billion)
- Chart on FO WLP - Year-over-year growth 2024-2029 (%)
- Data Table on FO WLP - Year-over-year growth 2024-2029 (%)
- 9.7 Market opportunity by Technology
- Market opportunity by Technology ($ billion)
- Data Table on Market opportunity by Technology ($ billion)
10 Customer Landscape
- 10.1 Customer landscape overview
- Analysis of price sensitivity, lifecycle, customer purchase basket, adoption rates, and purchase criteria
11 Geographic Landscape
- 11.1 Geographic segmentation
- Chart on Market share By Geographical Landscape 2024-2029 (%)
- Data Table on Market share By Geographical Landscape 2024-2029 (%)
- 11.2 Geographic comparison
- Chart on Geographic comparison
- Data Table on Geographic comparison
- 11.3 APAC - Market size and forecast 2024-2029
- Chart on APAC - Market size and forecast 2024-2029 ($ billion)
- Data Table on APAC - Market size and forecast 2024-2029 ($ billion)
- Chart on APAC - Year-over-year growth 2024-2029 (%)
- Data Table on APAC - Year-over-year growth 2024-2029 (%)
- 11.4 North America - Market size and forecast 2024-2029
- Chart on North America - Market size and forecast 2024-2029 ($ billion)
- Data Table on North America - Market size and forecast 2024-2029 ($ billion)
- Chart on North America - Year-over-year growth 2024-2029 (%)
- Data Table on North America - Year-over-year growth 2024-2029 (%)
- 11.5 Europe - Market size and forecast 2024-2029
- Chart on Europe - Market size and forecast 2024-2029 ($ billion)
- Data Table on Europe - Market size and forecast 2024-2029 ($ billion)
- Chart on Europe - Year-over-year growth 2024-2029 (%)
- Data Table on Europe - Year-over-year growth 2024-2029 (%)
- 11.6 South America - Market size and forecast 2024-2029
- Chart on South America - Market size and forecast 2024-2029 ($ billion)
- Data Table on South America - Market size and forecast 2024-2029 ($ billion)
- Chart on South America - Year-over-year growth 2024-2029 (%)
- Data Table on South America - Year-over-year growth 2024-2029 (%)
- 11.7 Middle East and Africa - Market size and forecast 2024-2029
- Chart on Middle East and Africa - Market size and forecast 2024-2029 ($ billion)
- Data Table on Middle East and Africa - Market size and forecast 2024-2029 ($ billion)
- Chart on Middle East and Africa - Year-over-year growth 2024-2029 (%)
- Data Table on Middle East and Africa - Year-over-year growth 2024-2029 (%)
- 11.8 US - Market size and forecast 2024-2029
- Chart on US - Market size and forecast 2024-2029 ($ billion)
- Data Table on US - Market size and forecast 2024-2029 ($ billion)
- Chart on US - Year-over-year growth 2024-2029 (%)
- Data Table on US - Year-over-year growth 2024-2029 (%)
- 11.9 Japan - Market size and forecast 2024-2029
- Chart on Japan - Market size and forecast 2024-2029 ($ billion)
- Data Table on Japan - Market size and forecast 2024-2029 ($ billion)
- Chart on Japan - Year-over-year growth 2024-2029 (%)
- Data Table on Japan - Year-over-year growth 2024-2029 (%)
- 11.10 China - Market size and forecast 2024-2029
- Chart on China - Market size and forecast 2024-2029 ($ billion)
- Data Table on China - Market size and forecast 2024-2029 ($ billion)
- Chart on China - Year-over-year growth 2024-2029 (%)
- Data Table on China - Year-over-year growth 2024-2029 (%)
- 11.11 Germany - Market size and forecast 2024-2029
- Chart on Germany - Market size and forecast 2024-2029 ($ billion)
- Data Table on Germany - Market size and forecast 2024-2029 ($ billion)
- Chart on Germany - Year-over-year growth 2024-2029 (%)
- Data Table on Germany - Year-over-year growth 2024-2029 (%)
- 11.12 France - Market size and forecast 2024-2029
- Chart on France - Market size and forecast 2024-2029 ($ billion)
- Data Table on France - Market size and forecast 2024-2029 ($ billion)
- Chart on France - Year-over-year growth 2024-2029 (%)
- Data Table on France - Year-over-year growth 2024-2029 (%)
- 11.13 India - Market size and forecast 2024-2029
- Chart on India - Market size and forecast 2024-2029 ($ billion)
- Data Table on India - Market size and forecast 2024-2029 ($ billion)
- Chart on India - Year-over-year growth 2024-2029 (%)
- Data Table on India - Year-over-year growth 2024-2029 (%)
- 11.14 Canada - Market size and forecast 2024-2029
- Chart on Canada - Market size and forecast 2024-2029 ($ billion)
- Data Table on Canada - Market size and forecast 2024-2029 ($ billion)
- Chart on Canada - Year-over-year growth 2024-2029 (%)
- Data Table on Canada - Year-over-year growth 2024-2029 (%)
- 11.15 Brazil - Market size and forecast 2024-2029
- Chart on Brazil - Market size and forecast 2024-2029 ($ billion)
- Data Table on Brazil - Market size and forecast 2024-2029 ($ billion)
- Chart on Brazil - Year-over-year growth 2024-2029 (%)
- Data Table on Brazil - Year-over-year growth 2024-2029 (%)
- 11.16 UK - Market size and forecast 2024-2029
- Chart on UK - Market size and forecast 2024-2029 ($ billion)
- Data Table on UK - Market size and forecast 2024-2029 ($ billion)
- Chart on UK - Year-over-year growth 2024-2029 (%)
- Data Table on UK - Year-over-year growth 2024-2029 (%)
- 11.17 Spain - Market size and forecast 2024-2029
- Chart on Spain - Market size and forecast 2024-2029 ($ billion)
- Data Table on Spain - Market size and forecast 2024-2029 ($ billion)
- Chart on Spain - Year-over-year growth 2024-2029 (%)
- Data Table on Spain - Year-over-year growth 2024-2029 (%)
- 11.18 Market opportunity By Geographical Landscape
- Market opportunity By Geographical Landscape ($ billion)
- Data Tables on Market opportunity By Geographical Landscape ($ billion)
12 Drivers, Challenges, and Opportunity/Restraints
- 12.1 Market drivers
- 12.2 Market challenges
- 12.3 Impact of drivers and challenges
- Impact of drivers and challenges in 2024 and 2029
- 12.4 Market opportunities/restraints
13 Competitive Landscape
- 13.1 Overview
- 13.2 Competitive Landscape
- Overview on criticality of inputs and factors of differentiation
- 13.3 Landscape disruption
- Overview on factors of disruption
- 13.4 Industry risks
- Impact of key risks on business
14 Competitive Analysis
- 14.1 Companies profiled
- Companies covered
- 14.2 Company ranking index
- Company ranking index
- 14.3 Market positioning of companies
- Matrix on companies position and classification
- 14.4 Amkor Technology Inc.
- Amkor Technology Inc. - Overview
- Amkor Technology Inc. - Business segments
- Amkor Technology Inc. - Key news
- Amkor Technology Inc. - Key offerings
- Amkor Technology Inc. - Segment focus
- SWOT
- 14.5 ASE Technology Holding Co. Ltd.
- ASE Technology Holding Co. Ltd. - Overview
- ASE Technology Holding Co. Ltd. - Business segments
- ASE Technology Holding Co. Ltd. - Key offerings
- ASE Technology Holding Co. Ltd. - Segment focus
- SWOT
- 14.6 Cactus Materials Inc.
- Cactus Materials Inc. - Overview
- Cactus Materials Inc. - Product / Service
- Cactus Materials Inc. - Key offerings
- SWOT
- 14.7 China Wafer Level CSP Co. Ltd.
- China Wafer Level CSP Co. Ltd. - Overview
- China Wafer Level CSP Co. Ltd. - Product / Service
- China Wafer Level CSP Co. Ltd. - Key offerings
- SWOT
- 14.8 ChipMOS TECHNOLOGIES INC.
- ChipMOS TECHNOLOGIES INC. - Overview
- ChipMOS TECHNOLOGIES INC. - Business segments
- ChipMOS TECHNOLOGIES INC. - Key offerings
- ChipMOS TECHNOLOGIES INC. - Segment focus
- SWOT
- 14.9 HANA Micron Co. Ltd.
- HANA Micron Co. Ltd. - Overview
- HANA Micron Co. Ltd. - Product / Service
- HANA Micron Co. Ltd. - Key offerings
- SWOT
- 14.10 Jiangsu Changdian Technology Co. Ltd.
- Jiangsu Changdian Technology Co. Ltd. - Overview
- Jiangsu Changdian Technology Co. Ltd. - Product / Service
- Jiangsu Changdian Technology Co. Ltd. - Key offerings
- SWOT
- 14.11 King Yuan Electronics Co. Ltd.
- King Yuan Electronics Co. Ltd. - Overview
- King Yuan Electronics Co. Ltd. - Product / Service
- King Yuan Electronics Co. Ltd. - Key offerings
- SWOT
- 14.12 nepes Corp.
- nepes Corp. - Overview
- nepes Corp. - Product / Service
- nepes Corp. - Key offerings
- SWOT
- 14.13 Powertech Technology Inc.
- Powertech Technology Inc. - Overview
- Powertech Technology Inc. - Business segments
- Powertech Technology Inc. - Key offerings
- Powertech Technology Inc. - Segment focus
- SWOT
- 14.14 Samsung Electronics Co. Ltd.
- Samsung Electronics Co. Ltd. - Overview
- Samsung Electronics Co. Ltd. - Business segments
- Samsung Electronics Co. Ltd. - Key news
- Samsung Electronics Co. Ltd. - Key offerings
- Samsung Electronics Co. Ltd. - Segment focus
- SWOT
- 14.15 SIGNETICS Corp.
- SIGNETICS Corp. - Overview
- SIGNETICS Corp. - Product / Service
- SIGNETICS Corp. - Key offerings
- SWOT
- 14.16 Taiwan Semiconductor Manufacturing Co. Ltd.
- Taiwan Semiconductor Manufacturing Co. Ltd. - Overview
- Taiwan Semiconductor Manufacturing Co. Ltd. - Product / Service
- Taiwan Semiconductor Manufacturing Co. Ltd. - Key news
- Taiwan Semiconductor Manufacturing Co. Ltd. - Key offerings
- SWOT
- 14.17 UTAC Holdings Ltd.
- UTAC Holdings Ltd. - Overview
- UTAC Holdings Ltd. - Product / Service
- UTAC Holdings Ltd. - Key offerings
- SWOT
- 14.18 Veeco Instruments Inc.
- Veeco Instruments Inc. - Overview
- Veeco Instruments Inc. - Product / Service
- Veeco Instruments Inc. - Key offerings
- SWOT
15 Appendix
- 15.1 Scope of the report
- 15.2 Inclusions and exclusions checklist
- Inclusions checklist
- Exclusions checklist
- 15.3 Currency conversion rates for US$
- Currency conversion rates for US$
- 15.4 Research methodology
- Research methodology
- 15.5 Data procurement
- Information sources
- 15.6 Data validation
- Data validation
- 15.7 Validation techniques employed for market sizing
- Validation techniques employed for market sizing
- 15.8 Data synthesis
- Data synthesis
- 15.9 360 degree market analysis
- 360 degree market analysis
- 15.10 List of abbreviations
- List of abbreviations
