|
|
市場調査レポート
商品コード
1581759
世界のMラーニング市場 (2024~2028年)Global M-learning Market 2024-2028 |
||||||

|
|||||||
カスタマイズ可能
|
|||||||

| 世界のMラーニング市場 (2024~2028年) |
|
出版日: 2024年08月14日
発行: TechNavio
ページ情報: 英文 142 Pages
納期: 即納可能
|

全表示
- 概要
- 図表
- 目次
Mラーニング市場 (2024~2028年)
Mラーニング市場は2023年から2028年に1,036億1,520万米ドル分拡大し、予測期間中に26.35%のCAGRで成長すると予測されます。当レポートでは、Mラーニング市場の全体的な分析、市場規模・予測、動向、成長促進要因、課題、約25社のベンダーを網羅したベンダー分析などを掲載しています。
当レポートでは、現在の市場シナリオ、最新動向と促進要因、市場環境全体に関する最新分析を提供しています。この市場は、利用の柔軟性、デバイス間の互換性、学習者のエンゲージメントレベルの高さによって牽引されています。
| 市場範囲 | |
|---|---|
| 基準年 | 2024年 |
| 終了年 | 2028年 |
| 予測期間 | 2024~2028年 |
| 成長モメンタム | 加速 |
| 前年比 (2024年) | 20.49% |
| CAGR | 26.35% |
| 増分額 | 1,036億1,520万米ドル |
当レポートでは、ビッグデータ分析によるMラーニングの改善が、今後数年間のMラーニング市場成長を牽引する主要因の1つであると分析しています。また、ゲームベースの学習による多様化や、html5の実装による強化も、市場の大きな需要につながると思われます。
目次
第1章 エグゼクティブサマリー
- 市場概要
第2章 市場情勢
- 市場エコシステム
- 市場の特徴
- バリューチェーン分析
第3章 市場規模の評価
- 市場の定義
- 市場セグメント分析
- 市場規模 (2023年)
- 市場の見通し (2023~2028年)
第4章 市場規模実績
- 世界のMラーニング市場 (2018~2022年)
- エンドユーザー別分析 (2018~2022年)
- 地域別分析 (2018~2022年)
- 国別分析 (2018~2022年)
第5章 ファイブフォース分析
- ファイブフォースの要約
- 買い手の交渉力
- 供給企業の交渉力
- 新規参入業者の脅威
- 代替品の脅威
- 競争の脅威
- 市況
第6章 市場セグメンテーション:エンドユーザー別
- 市場セグメンテーション
- 比較:エンドユーザー別
- 高等教育:市場規模と予測 (2023~2028年)
- 企業:市場規模と予測 (2023~2028年)
- K-12:市場規模と予測 (2023~2028年)
- エンドユーザー別の市場機会
第7章 顧客情勢
- 顧客情勢の概要
第8章 地域別情勢
- 地域別セグメンテーション
- 地域別比較
- 北米:市場規模と予測 (2023~2028年)
- アジア太平洋:市場規模と予測 (2023~2028年)
- 欧州:市場規模と予測 (2023~2028年)
- 南米:市場規模と予測 (2023~2028年)
- 中東・アフリカ:市場規模と予測 (2023~2028年)
- 米国:市場規模と予測 (2023~2028年)
- 中国:市場規模と予測 (2023~2028年)
- インド:市場規模と予測 (2023~2028年)
- 英国:市場規模と予測 (2023~2028年)
- ドイツ:市場規模と予測 (2023~2028年)
- 地域別の市場機会
第9章 促進要因・課題・機会・抑制要因
- 市場促進要因
- 市場の課題
- 促進要因と課題の影響
- 市場の機会・抑制要因
第10章 競合情勢
- 概要
- 競合情勢
- 混乱の状況
- 業界のリスク
第11章 競合分析
- 企業プロファイル
- 企業の市場ポジショニング
- Adobe Inc.
- Allen Interactions Inc.
- Aptara Inc.
- Articulate Global Inc.
- Blackboard Inc.
- Cross Knowledge
- D2L Inc.
- Docebo Inc.
- dominKnow Inc.
- WizIQ Inc.
第12章 付録
Exhibits:
- Exhibits1: Executive Summary - Chart on Market Overview
- Exhibits2: Executive Summary - Data Table on Market Overview
- Exhibits3: Executive Summary - Chart on Global Market Characteristics
- Exhibits4: Executive Summary - Chart on Market By Geographical Landscape
- Exhibits5: Executive Summary - Chart on Market Segmentation by End-user
- Exhibits6: Executive Summary - Chart on Incremental Growth
- Exhibits7: Executive Summary - Data Table on Incremental Growth
- Exhibits8: Executive Summary - Chart on Company Market Positioning
- Exhibits9: Parent Market
- Exhibits10: Data Table on - Parent Market
- Exhibits11: Market characteristics analysis
- Exhibits12: Value Chain Analysis
- Exhibits13: Offerings of companies included in the market definition
- Exhibits14: Market segments
- Exhibits15: Chart on Global - Market size and forecast 2023-2028 ($ million)
- Exhibits16: Data Table on Global - Market size and forecast 2023-2028 ($ million)
- Exhibits17: Chart on Global Market: Year-over-year growth 2023-2028 (%)
- Exhibits18: Data Table on Global Market: Year-over-year growth 2023-2028 (%)
- Exhibits19: Historic Market Size - Data Table on Global M-Learning Market 2018 - 2022 ($ million)
- Exhibits20: Historic Market Size - End-user Segment 2018 - 2022 ($ million)
- Exhibits21: Historic Market Size - Geography Segment 2018 - 2022 ($ million)
- Exhibits22: Historic Market Size - Country Segment 2018 - 2022 ($ million)
- Exhibits23: Five forces analysis - Comparison between 2023 and 2028
- Exhibits24: Bargaining power of buyers - Impact of key factors 2023 and 2028
- Exhibits25: Bargaining power of suppliers - Impact of key factors in 2023 and 2028
- Exhibits26: Threat of new entrants - Impact of key factors in 2023 and 2028
- Exhibits27: Threat of substitutes - Impact of key factors in 2023 and 2028
- Exhibits28: Threat of rivalry - Impact of key factors in 2023 and 2028
- Exhibits29: Chart on Market condition - Five forces 2023 and 2028
- Exhibits30: Chart on End-user - Market share 2023-2028 (%)
- Exhibits31: Data Table on End-user - Market share 2023-2028 (%)
- Exhibits32: Chart on Comparison by End-user
- Exhibits33: Data Table on Comparison by End-user
- Exhibits34: Chart on Higher education - Market size and forecast 2023-2028 ($ million)
- Exhibits35: Data Table on Higher education - Market size and forecast 2023-2028 ($ million)
- Exhibits36: Chart on Higher education - Year-over-year growth 2023-2028 (%)
- Exhibits37: Data Table on Higher education - Year-over-year growth 2023-2028 (%)
- Exhibits38: Chart on Corporate - Market size and forecast 2023-2028 ($ million)
- Exhibits39: Data Table on Corporate - Market size and forecast 2023-2028 ($ million)
- Exhibits40: Chart on Corporate - Year-over-year growth 2023-2028 (%)
- Exhibits41: Data Table on Corporate - Year-over-year growth 2023-2028 (%)
- Exhibits42: Chart on K-12 - Market size and forecast 2023-2028 ($ million)
- Exhibits43: Data Table on K-12 - Market size and forecast 2023-2028 ($ million)
- Exhibits44: Chart on K-12 - Year-over-year growth 2023-2028 (%)
- Exhibits45: Data Table on K-12 - Year-over-year growth 2023-2028 (%)
- Exhibits46: Market opportunity by End-user ($ million)
- Exhibits47: Data Table on Market opportunity by End-user ($ million)
- Exhibits48: Analysis of price sensitivity, lifecycle, customer purchase basket, adoption rates, and purchase criteria
- Exhibits49: Chart on Market share By Geographical Landscape 2023-2028 (%)
- Exhibits50: Data Table on Market share By Geographical Landscape 2023-2028 (%)
- Exhibits51: Chart on Geographic comparison
- Exhibits52: Data Table on Geographic comparison
- Exhibits53: Chart on North America - Market size and forecast 2023-2028 ($ million)
- Exhibits54: Data Table on North America - Market size and forecast 2023-2028 ($ million)
- Exhibits55: Chart on North America - Year-over-year growth 2023-2028 (%)
- Exhibits56: Data Table on North America - Year-over-year growth 2023-2028 (%)
- Exhibits57: Chart on APAC - Market size and forecast 2023-2028 ($ million)
- Exhibits58: Data Table on APAC - Market size and forecast 2023-2028 ($ million)
- Exhibits59: Chart on APAC - Year-over-year growth 2023-2028 (%)
- Exhibits60: Data Table on APAC - Year-over-year growth 2023-2028 (%)
- Exhibits61: Chart on Europe - Market size and forecast 2023-2028 ($ million)
- Exhibits62: Data Table on Europe - Market size and forecast 2023-2028 ($ million)
- Exhibits63: Chart on Europe - Year-over-year growth 2023-2028 (%)
- Exhibits64: Data Table on Europe - Year-over-year growth 2023-2028 (%)
- Exhibits65: Chart on South America - Market size and forecast 2023-2028 ($ million)
- Exhibits66: Data Table on South America - Market size and forecast 2023-2028 ($ million)
- Exhibits67: Chart on South America - Year-over-year growth 2023-2028 (%)
- Exhibits68: Data Table on South America - Year-over-year growth 2023-2028 (%)
- Exhibits69: Chart on Middle East and Africa - Market size and forecast 2023-2028 ($ million)
- Exhibits70: Data Table on Middle East and Africa - Market size and forecast 2023-2028 ($ million)
- Exhibits71: Chart on Middle East and Africa - Year-over-year growth 2023-2028 (%)
- Exhibits72: Data Table on Middle East and Africa - Year-over-year growth 2023-2028 (%)
- Exhibits73: Chart on US - Market size and forecast 2023-2028 ($ million)
- Exhibits74: Data Table on US - Market size and forecast 2023-2028 ($ million)
- Exhibits75: Chart on US - Year-over-year growth 2023-2028 (%)
- Exhibits76: Data Table on US - Year-over-year growth 2023-2028 (%)
- Exhibits77: Chart on China - Market size and forecast 2023-2028 ($ million)
- Exhibits78: Data Table on China - Market size and forecast 2023-2028 ($ million)
- Exhibits79: Chart on China - Year-over-year growth 2023-2028 (%)
- Exhibits80: Data Table on China - Year-over-year growth 2023-2028 (%)
- Exhibits81: Chart on India - Market size and forecast 2023-2028 ($ million)
- Exhibits82: Data Table on India - Market size and forecast 2023-2028 ($ million)
- Exhibits83: Chart on India - Year-over-year growth 2023-2028 (%)
- Exhibits84: Data Table on India - Year-over-year growth 2023-2028 (%)
- Exhibits85: Chart on UK - Market size and forecast 2023-2028 ($ million)
- Exhibits86: Data Table on UK - Market size and forecast 2023-2028 ($ million)
- Exhibits87: Chart on UK - Year-over-year growth 2023-2028 (%)
- Exhibits88: Data Table on UK - Year-over-year growth 2023-2028 (%)
- Exhibits89: Chart on Germany - Market size and forecast 2023-2028 ($ million)
- Exhibits90: Data Table on Germany - Market size and forecast 2023-2028 ($ million)
- Exhibits91: Chart on Germany - Year-over-year growth 2023-2028 (%)
- Exhibits92: Data Table on Germany - Year-over-year growth 2023-2028 (%)
- Exhibits93: Market opportunity By Geographical Landscape ($ million)
- Exhibits94: Data Tables on Market opportunity By Geographical Landscape ($ million)
- Exhibits95: Impact of drivers and challenges in 2023 and 2028
- Exhibits96: Overview on criticality of inputs and factors of differentiation
- Exhibits97: Overview on factors of disruption
- Exhibits98: Impact of key risks on business
- Exhibits99: Companies covered
- Exhibits100: Matrix on companies position and classification
- Exhibits101: Adobe Inc. - Overview
- Exhibits102: Adobe Inc. - Business segments
- Exhibits103: Adobe Inc. - Key news
- Exhibits104: Adobe Inc. - Key offerings
- Exhibits105: Adobe Inc. - Segment focus
- Exhibits106: Allen Interactions Inc. - Overview
- Exhibits107: Allen Interactions Inc. - Product / Service
- Exhibits108: Allen Interactions Inc. - Key offerings
- Exhibits109: Aptara Inc. - Overview
- Exhibits110: Aptara Inc. - Product / Service
- Exhibits111: Aptara Inc. - Key offerings
- Exhibits112: Articulate Global Inc. - Overview
- Exhibits113: Articulate Global Inc. - Product / Service
- Exhibits114: Articulate Global Inc. - Key offerings
- Exhibits115: Blackboard Inc. - Overview
- Exhibits116: Blackboard Inc. - Product / Service
- Exhibits117: Blackboard Inc. - Key offerings
- Exhibits118: Cross Knowledge - Overview
- Exhibits119: Cross Knowledge - Product / Service
- Exhibits120: Cross Knowledge - Key offerings
- Exhibits121: D2L Inc. - Overview
- Exhibits122: D2L Inc. - Product / Service
- Exhibits123: D2L Inc. - Key news
- Exhibits124: D2L Inc. - Key offerings
- Exhibits125: Docebo Inc. - Overview
- Exhibits126: Docebo Inc. - Product / Service
- Exhibits127: Docebo Inc. - Key news
- Exhibits128: Docebo Inc. - Key offerings
- Exhibits129: dominKnow Inc. - Overview
- Exhibits130: dominKnow Inc. - Product / Service
- Exhibits131: dominKnow Inc. - Key offerings
- Exhibits132: WizIQ Inc. - Overview
- Exhibits133: WizIQ Inc. - Product / Service
- Exhibits134: WizIQ Inc. - Key offerings
- Exhibits135: Inclusions checklist
- Exhibits136: Exclusions checklist
- Exhibits137: Currency conversion rates for US$
- Exhibits138: Research methodology
- Exhibits139: Information sources
- Exhibits140: Data validation
- Exhibits141: Validation techniques employed for market sizing
- Exhibits142: Data synthesis
- Exhibits143: 360 degree market analysis
- Exhibits144: List of abbreviations
M-Learning Market 2024-2028
The M-Learning market is forecasted to grow by USD 103615.2 mn during 2023-2028, accelerating at a CAGR of 26.35% during the forecast period. The report on the M-Learning market provides a holistic analysis, market size and forecast, trends, growth drivers, and challenges, as well as vendor analysis covering around 25 vendors.
The report offers an up-to-date analysis regarding the current market scenario, the latest trends and drivers, and the overall market environment. The market is driven by flexibility of use, cross-device compatibility, and greater level of learner engagement.
| Market Scope | |
|---|---|
| Base Year | 2024 |
| End Year | 2028 |
| Series Year | 2024-2028 |
| Growth Momentum | Accelerate |
| YOY 2024 | 20.49% |
| CAGR | 26.35% |
| Incremental Value | $103615.2 mn |
Technavio's M-Learning market is segmented as below:
By End-user
- Higher education
- Corporate
- K-12
By Geographical Landscape
- North America
- APAC
- Europe
- South America
- Middle East and Africa
This study identifies the improvements in M-Learning through big data analytics as one of the prime reasons driving the M-Learning market growth during the next few years. Also, diversification through game-based learning and enhancements from implementation of html5 will lead to sizable demand in the market.
The report on the M-Learning market covers the following areas:
- M-Learning market sizing
- M-Learning market forecast
- M-Learning market industry analysis
The robust vendor analysis is designed to help clients improve their market position, and in line with this, this report provides a detailed analysis of several leading M-Learning market vendors that include Adobe Inc., Allen Interactions Inc., Aptara Inc., Articulate Inc., Blackboard Inc., Cisco Systems Inc., Citrix Systems Inc., Cross Knowledge, D2L Inc., Dell Technologies Inc., Docebo Inc., dominKnow Inc., LEO Learning Inc, Oxagile, Saba Software Inc., Schoology Inc., Skillsoft Corp., SumTotal Systems LLC, Upside Learning Solutions Pvt. Ltd., and WizIQ Inc.. Also, the M-Learning market analysis report includes information on upcoming trends and challenges that will influence market growth. This is to help companies strategize and leverage all forthcoming growth opportunities.
The study was conducted using an objective combination of primary and secondary information including inputs from key participants in the industry. The report contains a comprehensive market and vendor landscape in addition to an analysis of the key vendors.
The publisher presents a detailed picture of the market by the way of study, synthesis, and summation of data from multiple sources by an analysis of key parameters such as profit, pricing, competition, and promotions. It presents various market facets by identifying the key industry influencers. The data presented is comprehensive, reliable, and a result of extensive research - both primary and secondary. The market research reports provide a complete competitive landscape and an in-depth vendor selection methodology and analysis using qualitative and quantitative research to forecast the accurate market growth.
Table of Contents
1 Executive Summary
- 1.1 Market overview
- Executive Summary - Chart on Market Overview
- Executive Summary - Data Table on Market Overview
- Executive Summary - Chart on Global Market Characteristics
- Executive Summary - Chart on Market By Geographical Landscape
- Executive Summary - Chart on Market Segmentation by End-user
- Executive Summary - Chart on Incremental Growth
- Executive Summary - Data Table on Incremental Growth
- Executive Summary - Chart on Company Market Positioning
2 Market Landscape
- 2.1 Market ecosystem
- Parent Market
- Data Table on - Parent Market
- 2.2 Market characteristics
- Market characteristics analysis
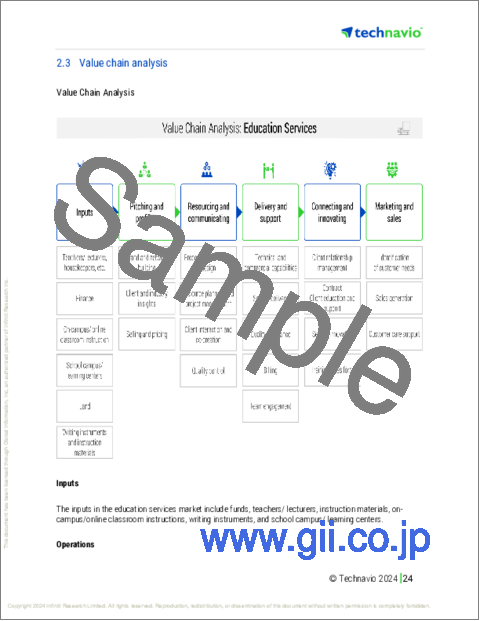
- 2.3 Value chain analysis
- Value Chain Analysis
3 Market Sizing
- 3.1 Market definition
- Offerings of companies included in the market definition
- 3.2 Market segment analysis
- Market segments
- 3.3 Market size 2023
- 3.4 Market outlook: Forecast for 2023-2028
- Chart on Global - Market size and forecast 2023-2028 ($ million)
- Data Table on Global - Market size and forecast 2023-2028 ($ million)
- Chart on Global Market: Year-over-year growth 2023-2028 (%)
- Data Table on Global Market: Year-over-year growth 2023-2028 (%)
4 Historic Market Size
- 4.1 Global M-Learning Market 2018 - 2022
- Historic Market Size - Data Table on Global M-Learning Market 2018 - 2022 ($ million)
- 4.2 End-user segment analysis 2018 - 2022
- Historic Market Size - End-user Segment 2018 - 2022 ($ million)
- 4.3 Geography segment analysis 2018 - 2022
- Historic Market Size - Geography Segment 2018 - 2022 ($ million)
- 4.4 Country segment analysis 2018 - 2022
- Historic Market Size - Country Segment 2018 - 2022 ($ million)
5 Five Forces Analysis
- 5.1 Five forces summary
- Five forces analysis - Comparison between 2023 and 2028
- 5.2 Bargaining power of buyers
- Bargaining power of buyers - Impact of key factors 2023 and 2028
- 5.3 Bargaining power of suppliers
- Bargaining power of suppliers - Impact of key factors in 2023 and 2028
- 5.4 Threat of new entrants
- Threat of new entrants - Impact of key factors in 2023 and 2028
- 5.5 Threat of substitutes
- Threat of substitutes - Impact of key factors in 2023 and 2028
- 5.6 Threat of rivalry
- Threat of rivalry - Impact of key factors in 2023 and 2028
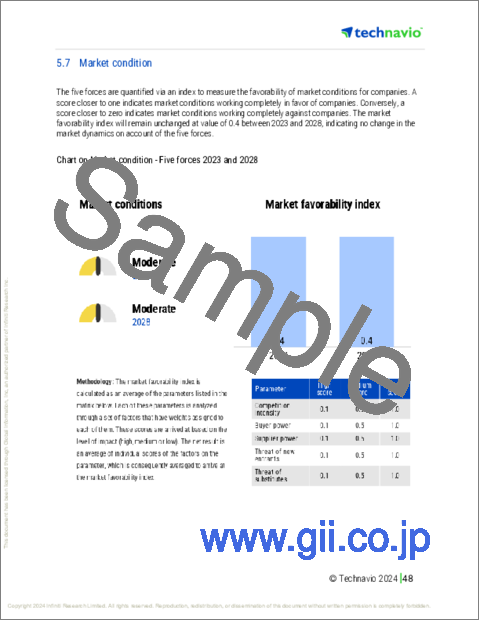
- 5.7 Market condition
- Chart on Market condition - Five forces 2023 and 2028
6 Market Segmentation by End-user
- 6.1 Market segments
- Chart on End-user - Market share 2023-2028 (%)
- Data Table on End-user - Market share 2023-2028 (%)
- 6.2 Comparison by End-user
- Chart on Comparison by End-user
- Data Table on Comparison by End-user
- 6.3 Higher education - Market size and forecast 2023-2028
- Chart on Higher education - Market size and forecast 2023-2028 ($ million)
- Data Table on Higher education - Market size and forecast 2023-2028 ($ million)
- Chart on Higher education - Year-over-year growth 2023-2028 (%)
- Data Table on Higher education - Year-over-year growth 2023-2028 (%)
- 6.4 Corporate - Market size and forecast 2023-2028
- Chart on Corporate - Market size and forecast 2023-2028 ($ million)
- Data Table on Corporate - Market size and forecast 2023-2028 ($ million)
- Chart on Corporate - Year-over-year growth 2023-2028 (%)
- Data Table on Corporate - Year-over-year growth 2023-2028 (%)
- 6.5 K-12 - Market size and forecast 2023-2028
- Chart on K-12 - Market size and forecast 2023-2028 ($ million)
- Data Table on K-12 - Market size and forecast 2023-2028 ($ million)
- Chart on K-12 - Year-over-year growth 2023-2028 (%)
- Data Table on K-12 - Year-over-year growth 2023-2028 (%)
- 6.6 Market opportunity by End-user
- Market opportunity by End-user ($ million)
- Data Table on Market opportunity by End-user ($ million)
7 Customer Landscape
- 7.1 Customer landscape overview
- Analysis of price sensitivity, lifecycle, customer purchase basket, adoption rates, and purchase criteria
8 Geographic Landscape
- 8.1 Geographic segmentation
- Chart on Market share By Geographical Landscape 2023-2028 (%)
- Data Table on Market share By Geographical Landscape 2023-2028 (%)
- 8.2 Geographic comparison
- Chart on Geographic comparison
- Data Table on Geographic comparison
- 8.3 North America - Market size and forecast 2023-2028
- Chart on North America - Market size and forecast 2023-2028 ($ million)
- Data Table on North America - Market size and forecast 2023-2028 ($ million)
- Chart on North America - Year-over-year growth 2023-2028 (%)
- Data Table on North America - Year-over-year growth 2023-2028 (%)
- 8.4 APAC - Market size and forecast 2023-2028
- Chart on APAC - Market size and forecast 2023-2028 ($ million)
- Data Table on APAC - Market size and forecast 2023-2028 ($ million)
- Chart on APAC - Year-over-year growth 2023-2028 (%)
- Data Table on APAC - Year-over-year growth 2023-2028 (%)
- 8.5 Europe - Market size and forecast 2023-2028
- Chart on Europe - Market size and forecast 2023-2028 ($ million)
- Data Table on Europe - Market size and forecast 2023-2028 ($ million)
- Chart on Europe - Year-over-year growth 2023-2028 (%)
- Data Table on Europe - Year-over-year growth 2023-2028 (%)
- 8.6 South America - Market size and forecast 2023-2028
- Chart on South America - Market size and forecast 2023-2028 ($ million)
- Data Table on South America - Market size and forecast 2023-2028 ($ million)
- Chart on South America - Year-over-year growth 2023-2028 (%)
- Data Table on South America - Year-over-year growth 2023-2028 (%)
- 8.7 Middle East and Africa - Market size and forecast 2023-2028
- Chart on Middle East and Africa - Market size and forecast 2023-2028 ($ million)
- Data Table on Middle East and Africa - Market size and forecast 2023-2028 ($ million)
- Chart on Middle East and Africa - Year-over-year growth 2023-2028 (%)
- Data Table on Middle East and Africa - Year-over-year growth 2023-2028 (%)
- 8.8 US - Market size and forecast 2023-2028
- Chart on US - Market size and forecast 2023-2028 ($ million)
- Data Table on US - Market size and forecast 2023-2028 ($ million)
- Chart on US - Year-over-year growth 2023-2028 (%)
- Data Table on US - Year-over-year growth 2023-2028 (%)
- 8.9 China - Market size and forecast 2023-2028
- Chart on China - Market size and forecast 2023-2028 ($ million)
- Data Table on China - Market size and forecast 2023-2028 ($ million)
- Chart on China - Year-over-year growth 2023-2028 (%)
- Data Table on China - Year-over-year growth 2023-2028 (%)
- 8.10 India - Market size and forecast 2023-2028
- Chart on India - Market size and forecast 2023-2028 ($ million)
- Data Table on India - Market size and forecast 2023-2028 ($ million)
- Chart on India - Year-over-year growth 2023-2028 (%)
- Data Table on India - Year-over-year growth 2023-2028 (%)
- 8.11 UK - Market size and forecast 2023-2028
- Chart on UK - Market size and forecast 2023-2028 ($ million)
- Data Table on UK - Market size and forecast 2023-2028 ($ million)
- Chart on UK - Year-over-year growth 2023-2028 (%)
- Data Table on UK - Year-over-year growth 2023-2028 (%)
- 8.12 Germany - Market size and forecast 2023-2028
- Chart on Germany - Market size and forecast 2023-2028 ($ million)
- Data Table on Germany - Market size and forecast 2023-2028 ($ million)
- Chart on Germany - Year-over-year growth 2023-2028 (%)
- Data Table on Germany - Year-over-year growth 2023-2028 (%)
- 8.13 Market opportunity By Geographical Landscape
- Market opportunity By Geographical Landscape ($ million)
- Data Tables on Market opportunity By Geographical Landscape ($ million)
9 Drivers, Challenges, and Opportunity/Restraints
- 9.1 Market drivers
- 9.2 Market challenges
- 9.3 Impact of drivers and challenges
- Impact of drivers and challenges in 2023 and 2028
- 9.4 Market opportunities/restraints
10 Competitive Landscape
- 10.1 Overview
- 10.2 Competitive Landscape
- Overview on criticality of inputs and factors of differentiation
- 10.3 Landscape disruption
- Overview on factors of disruption
- 10.4 Industry risks
- Impact of key risks on business
11 Competitive Analysis
- 11.1 Companies profiled
- Companies covered
- 11.2 Market positioning of companies
- Matrix on companies position and classification
- 11.3 Adobe Inc.
- Adobe Inc. - Overview
- Adobe Inc. - Business segments
- Adobe Inc. - Key news
- Adobe Inc. - Key offerings
- Adobe Inc. - Segment focus
- 11.4 Allen Interactions Inc.
- Allen Interactions Inc. - Overview
- Allen Interactions Inc. - Product / Service
- Allen Interactions Inc. - Key offerings
- 11.5 Aptara Inc.
- Aptara Inc. - Overview
- Aptara Inc. - Product / Service
- Aptara Inc. - Key offerings
- 11.6 Articulate Global Inc.
- Articulate Global Inc. - Overview
- Articulate Global Inc. - Product / Service
- Articulate Global Inc. - Key offerings
- 11.7 Blackboard Inc.
- Blackboard Inc. - Overview
- Blackboard Inc. - Product / Service
- Blackboard Inc. - Key offerings
- 11.8 Cross Knowledge
- Cross Knowledge - Overview
- Cross Knowledge - Product / Service
- Cross Knowledge - Key offerings
- 11.9 D2L Inc.
- D2L Inc. - Overview
- D2L Inc. - Product / Service
- D2L Inc. - Key news
- D2L Inc. - Key offerings
- 11.10 Docebo Inc.
- Docebo Inc. - Overview
- Docebo Inc. - Product / Service
- Docebo Inc. - Key news
- Docebo Inc. - Key offerings
- 11.11 dominKnow Inc.
- dominKnow Inc. - Overview
- dominKnow Inc. - Product / Service
- dominKnow Inc. - Key offerings
- 11.12 WizIQ Inc.
- WizIQ Inc. - Overview
- WizIQ Inc. - Product / Service
- WizIQ Inc. - Key offerings
12 Appendix
- 12.1 Scope of the report
- 12.2 Inclusions and exclusions checklist
- Inclusions checklist
- Exclusions checklist
- 12.3 Currency conversion rates for US$
- Currency conversion rates for US$
- 12.4 Research methodology
- Research methodology
- 12.5 Data procurement
- Information sources
- 12.6 Data validation
- Data validation
- 12.7 Validation techniques employed for market sizing
- Validation techniques employed for market sizing
- 12.8 Data synthesis
- Data synthesis
- 360 degree market analysis
- 360 degree market analysis
- 12.10 List of abbreviations
- List of abbreviations
