|
|
市場調査レポート
商品コード
1915534
世界のセラミック基板市場2025-2029年Global Ceramic Substrate Market 2025-2029 |
||||||
|
|||||||
カスタマイズ可能
|
|||||||

| 世界のセラミック基板市場2025-2029年 |
|
出版日: 2026年01月19日
発行: TechNavio
ページ情報: 英文 320 Pages
納期: 即納可能
|

概要
世界のセラミック基板市場は、2024年から2029年の予測期間において、CAGR 7.3%で成長し、28億7,510万米ドル規模に拡大すると予測されております。
本報告書では、世界のセラミック基板市場に関する包括的な分析、市場規模と予測、動向、成長要因、課題に加え、約25社のベンダー分析を提供しております。
本レポートは、現在の市場状況、最新の動向と促進要因、市場環境全般に関する最新の分析を提供します。市場は、電気自動車(EV)および関連パワーエレクトロニクスの普及、5G通信インフラとレーダーシステムの拡大、半導体パッケージング技術とLED技術の進歩によって牽引されています。
本調査は、業界の主要関係者からの情報を含む一次情報と二次情報を客観的に組み合わせて実施されました。本レポートには、主要企業の分析に加え、包括的な市場規模データ、地域別分析を伴うセグメント、ベンダー情勢が含まれています。レポートには過去データと予測データが掲載されています。
| 市場範囲 | |
|---|---|
| 基準年 | 2025年 |
| 終了年 | 2029年 |
| 予測期間 | 2025-2029 |
| 成長モメンタム | 加速 |
| 前年比 | 6.7% |
| CAGR | 7.3% |
| 増分額 | 28億7,510万米ドル |
本調査では、今後数年間における世界のセラミック基板市場の成長を牽引する主要要因の一つとして、ワイドバンドギャップ半導体および互換性のある基板の採用加速を特定しております。また、積層造形技術や先進的な構造化技術の統合、ならびにサプライチェーンのレジリエンスと地域化への戦略的焦点が、市場における相当な需要を生み出すものと見込まれます。
目次
第1章 エグゼクティブサマリー
第2章 Technavio分析
- 価格・ライフサイクル・顧客購入バスケット・採用率・購入基準の分析
- インプットの重要性と差別化の要因
- 混乱の要因
- 促進要因と課題の影響
第3章 市場情勢
- 市場エコシステム
- 市場の特徴
- バリューチェーン分析
第4章 市場規模
- 市場の定義
- 市場セグメント分析
- 市場規模 2024
- 市場の見通し 2024-2029
第5章 市場規模実績
- 世界のセラミック基板市場 2019-2023
- 製品タイプセグメント分析 2019-2023
- エンドユーザーセグメント分析 2019-2023
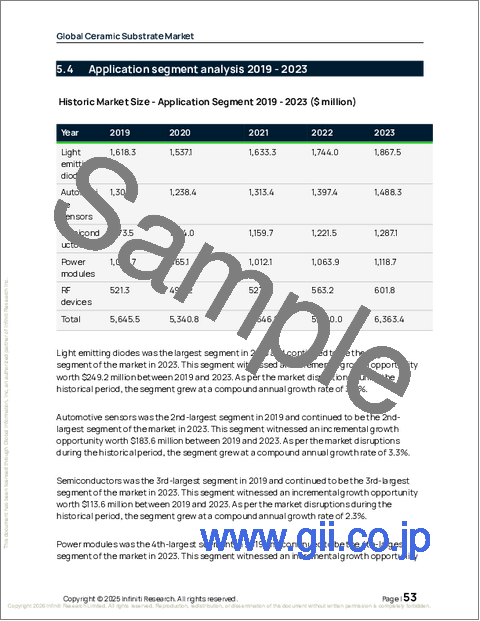
- 用途別セグメント分析 2019-2023
- 地域別セグメント分析 2019-2023
- 国別セグメント分析 2019-2023
第6章 定性分析
- AIが世界のセラミック基板市場
第7章 ファイブフォース分析
- ファイブフォースの要約
- 買い手の交渉力
- 供給企業の交渉力
- 新規参入業者の脅威
- 代替品の脅威
- 競争の脅威
- 市況
第8章 市場セグメンテーション:製品タイプ別
- 比較:製品タイプ別
- アルミナ基板
- 窒化アルミニウム基板
- 酸化ベリリウム基板
- 窒化ケイ素基板
- その他
- 市場機会:製品タイプ別
第9章 市場セグメンテーション:エンドユーザー別
- 比較:エンドユーザー別
- 民生用電子機器
- 自動車
- 通信
- その他
- 市場機会:エンドユーザー別
第10章 市場セグメンテーション:用途別
- 比較:用途別
- 発光ダイオード
- 自動車用センサー
- 半導体
- パワーモジュール
- RFデバイス
- 市場機会:用途別
第11章 顧客情勢
第12章 地域別情勢
- 地域別セグメンテーション
- 地域別比較
- アジア太平洋
- 中国
- 日本
- インド
- 韓国
- インドネシア
- オーストラリア
- 欧州
- ドイツ
- 英国
- フランス
- イタリア
- スペイン
- オランダ
- 北米
- 米国
- カナダ
- メキシコ
- 南米
- ブラジル
- アルゼンチン
- コロンビア
- 中東・アフリカ
- サウジアラビア
- アラブ首長国連邦
- 南アフリカ
- イスラエル
- トルコ
- 市場機会:地域別
第13章 促進要因・課題・機会
- 市場促進要因
- 市場の課題
- 促進要因と課題の影響
- 市場機会
第14章 競合情勢
- 概要
- 競合情勢
- 混乱の状況
- 業界のリスク
第15章 競合分析
- 企業プロファイル
- 企業ランキング指標
- 企業の市場ポジショニング
- Advanced Substrate Microtechnology Corp.
- AGC Inc.
- Cepheus Technology Ltd.
- CeramTec GmbH
- CoorsTek Inc.
- Koa Corp.
- KYOCERA Corp.
- LEATEC Fine Ceramics Co., Ltd.
- MARUWA CO. LTD.
- Murata Manufacturing Co. Ltd.
- NGK Insulators Ltd
- NIKKO CO.
- Nippon Carbide Industries Co. Ltd.
- NTK CERAMIC CO.,LTD.
- Ortech Advanced Ceramics

