|
|
市場調査レポート
商品コード
1525385
PMSと月経健康サプリメントの世界市場 2024-2028Global PMS And Menstrual Health Supplements Market 2024-2028 |
||||||
|
|||||||
カスタマイズ可能
|
|||||||


| PMSと月経健康サプリメントの世界市場 2024-2028 |
|
出版日: 2024年07月09日
発行: TechNavio
ページ情報: 英文 150 Pages
納期: 即納可能
|

全表示
- 概要
- 図表
- 目次
PMSと月経健康サプリメント市場は2023-2028年に57億350万米ドル、予測期間中のCAGRは4.36%で成長すると予測されます。
当レポートでは、PMSと月経健康サプリメント市場の全体的な分析、市場規模・予測、動向、成長促進要因、課題、約25のベンダーを網羅したベンダー分析などを掲載しています。
現在の市場シナリオ、最新動向と促進要因、市場環境全体に関する最新分析を提供しています。市場は、女性の健康問題や月経に関する認識や教育の高まり、自然療法への需要の高まり、現代的なライフスタイルやストレス、食生活のアンバランスの蔓延によって牽引されています。
| 市場範囲 | |
|---|---|
| 基準年 | 2024 |
| 終了年 | 2028 |
| 予測期間 | 2024-2028 |
| 成長モメンタム | 加速 |
| 前年比2024年 | 4.11% |
| CAGR | 4.36% |
| 増分額 | 57億350万米ドル |
本調査では、技術の進歩が今後数年間のPMSと月経健康サプリメント市場成長を牽引する主要因の1つであるとしています。また、持続可能で倫理的なPMSと月経健康サプリメント、モバイルアプリやデジタルプラットフォームの増加は、市場の大きな需要につながります。
目次
第1章 エグゼクティブサマリー
- 市場概要
第2章 市場情勢
- 市場エコシステム
- 市場の特徴
- バリューチェーン分析
第3章 市場規模の評価
- 市場の定義
- 市場セグメント分析
- 市場規模 2023
- 市場の見通し 2023-2028
第4章 市場規模実績
- PMSと月経健康サプリメントの世界市場 2018-2022
- 年齢層別セグメント分析 2018-2022
- 製品別セグメント分析 2018-2022
- 地域別セグメント分析 2018-2022
- 国別セグメント分析 2018-2022
第5章 ファイブフォース分析
- ファイブフォースの要約
- 買い手の交渉力
- 供給企業の交渉力
- 新規参入業者の脅威
- 代替品の脅威
- 競争の脅威
- 市況
第6章 市場セグメンテーション:年齢層別
- 市場セグメンテーション
- 比較:年齢層別
- 月経前症候群:市場規模と予測 2023-2028
- 更年期障害:市場規模と予測 2023-2028
- 市場機会:年齢層別
第7章 市場セグメンテーション:製品別
- 市場セグメンテーション
- 比較:製品別
- 複合栄養補助食品:市場規模と予測 2023-2028
- 単品栄養補助食品:市場規模と予測 2023-2028
- 市場機会:製品別
第8章 顧客情勢
- 顧客情勢の概要
第9章 地域別情勢
- 地域別セグメンテーション
- 地域別比較
- アジア:市場規模と予測 2023-2028
- 北米:市場規模と予測 2023-2028
- 欧州:市場規模と予測 2023-2028
- 世界のその他の地域:市場規模と予測 2023-2028
- 米国:市場規模と予測 2023-2028
- 中国:市場規模と予測 2023-2028
- 日本:市場規模と予測 2023-2028
- ドイツ:市場規模と予測 2023-2028
- 英国:市場規模と予測 2023-2028
- 市場機会:地域情勢別
第10章 促進要因・課題・機会・抑制要因
- 市場促進要因
- 市場の課題
- 促進要因と課題の影響
- 市場の機会・抑制要因
第11章 競合情勢
- 概要
- 競合情勢
- 混乱の状況
- 業界のリスク
第12章 競合分析
- 企業プロファイル
- 企業の市場ポジショニング
- Abbott Laboratories
- Aesthetic Nutrition
- Amway Corp.
- Archer Daniels Midland Co.
- DM Pharma Marketing Pvt. Ltd.
- GNC Holdings LLC
- Herbalife International of America Inc.
- My Willo Inc.
- Nestle SA
- Novartis AG
- Otsuka Pharmaceutical Co. Ltd.
- USANA Health Science Inc.
第13章 付録
Exhibits:
- Exhibits1: Executive Summary - Chart on Market Overview
- Exhibits2: Executive Summary - Data Table on Market Overview
- Exhibits3: Executive Summary - Chart on Global Market Characteristics
- Exhibits4: Executive Summary - Chart on Market By Geographical Landscape
- Exhibits5: Executive Summary - Chart on Market Segmentation by Age Group
- Exhibits6: Executive Summary - Chart on Market Segmentation by Product
- Exhibits7: Executive Summary - Chart on Incremental Growth
- Exhibits8: Executive Summary - Data Table on Incremental Growth
- Exhibits9: Executive Summary - Chart on Company Market Positioning
- Exhibits10: Parent Market
- Exhibits11: Data Table on - Parent Market
- Exhibits12: Market characteristics analysis
- Exhibits13: Value Chain Analysis
- Exhibits14: Offerings of companies included in the market definition
- Exhibits15: Market segments
- Exhibits16: Chart on Global - Market size and forecast 2023-2028 ($ million)
- Exhibits17: Data Table on Global - Market size and forecast 2023-2028 ($ million)
- Exhibits18: Chart on Global Market: Year-over-year growth 2023-2028 (%)
- Exhibits19: Data Table on Global Market: Year-over-year growth 2023-2028 (%)
- Exhibits20: Historic Market Size - Data Table on Global PMS And Menstrual Health Supplements Market 2018 - 2022 ($ million)
- Exhibits21: Historic Market Size - Age Group Segment 2018 - 2022 ($ million)
- Exhibits22: Historic Market Size - Product Segment 2018 - 2022 ($ million)
- Exhibits23: Historic Market Size - Geography Segment 2018 - 2022 ($ million)
- Exhibits24: Historic Market Size - Country Segment 2018 - 2022 ($ million)
- Exhibits25: Five forces analysis - Comparison between 2023 and 2028
- Exhibits26: Bargaining power of buyers - Impact of key factors 2023 and 2028
- Exhibits27: Bargaining power of suppliers - Impact of key factors in 2023 and 2028
- Exhibits28: Threat of new entrants - Impact of key factors in 2023 and 2028
- Exhibits29: Threat of substitutes - Impact of key factors in 2023 and 2028
- Exhibits30: Threat of rivalry - Impact of key factors in 2023 and 2028
- Exhibits31: Chart on Market condition - Five forces 2023 and 2028
- Exhibits32: Chart on Age Group - Market share 2023-2028 (%)
- Exhibits33: Data Table on Age Group - Market share 2023-2028 (%)
- Exhibits34: Chart on Comparison by Age Group
- Exhibits35: Data Table on Comparison by Age Group
- Exhibits36: Chart on Premenstrual syndrome - Market size and forecast 2023-2028 ($ million)
- Exhibits37: Data Table on Premenstrual syndrome - Market size and forecast 2023-2028 ($ million)
- Exhibits38: Chart on Premenstrual syndrome - Year-over-year growth 2023-2028 (%)
- Exhibits39: Data Table on Premenstrual syndrome - Year-over-year growth 2023-2028 (%)
- Exhibits40: Chart on Perimenopause - Market size and forecast 2023-2028 ($ million)
- Exhibits41: Data Table on Perimenopause - Market size and forecast 2023-2028 ($ million)
- Exhibits42: Chart on Perimenopause - Year-over-year growth 2023-2028 (%)
- Exhibits43: Data Table on Perimenopause - Year-over-year growth 2023-2028 (%)
- Exhibits44: Market opportunity by Age Group ($ million)
- Exhibits45: Data Table on Market opportunity by Age Group ($ million)
- Exhibits46: Chart on Product - Market share 2023-2028 (%)
- Exhibits47: Data Table on Product - Market share 2023-2028 (%)
- Exhibits48: Chart on Comparison by Product
- Exhibits49: Data Table on Comparison by Product
- Exhibits50: Chart on Combined nutritional supplements - Market size and forecast 2023-2028 ($ million)
- Exhibits51: Data Table on Combined nutritional supplements - Market size and forecast 2023-2028 ($ million)
- Exhibits52: Chart on Combined nutritional supplements - Year-over-year growth 2023-2028 (%)
- Exhibits53: Data Table on Combined nutritional supplements - Year-over-year growth 2023-2028 (%)
- Exhibits54: Chart on Single nutritional supplements - Market size and forecast 2023-2028 ($ million)
- Exhibits55: Data Table on Single nutritional supplements - Market size and forecast 2023-2028 ($ million)
- Exhibits56: Chart on Single nutritional supplements - Year-over-year growth 2023-2028 (%)
- Exhibits57: Data Table on Single nutritional supplements - Year-over-year growth 2023-2028 (%)
- Exhibits58: Market opportunity by Product ($ million)
- Exhibits59: Data Table on Market opportunity by Product ($ million)
- Exhibits60: Analysis of price sensitivity, lifecycle, customer purchase basket, adoption rates, and purchase criteria
- Exhibits61: Chart on Market share By Geographical Landscape 2023-2028 (%)
- Exhibits62: Data Table on Market share By Geographical Landscape 2023-2028 (%)
- Exhibits63: Chart on Geographic comparison
- Exhibits64: Data Table on Geographic comparison
- Exhibits65: Chart on Asia - Market size and forecast 2023-2028 ($ million)
- Exhibits66: Data Table on Asia - Market size and forecast 2023-2028 ($ million)
- Exhibits67: Chart on Asia - Year-over-year growth 2023-2028 (%)
- Exhibits68: Data Table on Asia - Year-over-year growth 2023-2028 (%)
- Exhibits69: Chart on North America - Market size and forecast 2023-2028 ($ million)
- Exhibits70: Data Table on North America - Market size and forecast 2023-2028 ($ million)
- Exhibits71: Chart on North America - Year-over-year growth 2023-2028 (%)
- Exhibits72: Data Table on North America - Year-over-year growth 2023-2028 (%)
- Exhibits73: Chart on Europe - Market size and forecast 2023-2028 ($ million)
- Exhibits74: Data Table on Europe - Market size and forecast 2023-2028 ($ million)
- Exhibits75: Chart on Europe - Year-over-year growth 2023-2028 (%)
- Exhibits76: Data Table on Europe - Year-over-year growth 2023-2028 (%)
- Exhibits77: Chart on Rest of World (ROW) - Market size and forecast 2023-2028 ($ million)
- Exhibits78: Data Table on Rest of World (ROW) - Market size and forecast 2023-2028 ($ million)
- Exhibits79: Chart on Rest of World (ROW) - Year-over-year growth 2023-2028 (%)
- Exhibits80: Data Table on Rest of World (ROW) - Year-over-year growth 2023-2028 (%)
- Exhibits81: Chart on US - Market size and forecast 2023-2028 ($ million)
- Exhibits82: Data Table on US - Market size and forecast 2023-2028 ($ million)
- Exhibits83: Chart on US - Year-over-year growth 2023-2028 (%)
- Exhibits84: Data Table on US - Year-over-year growth 2023-2028 (%)
- Exhibits85: Chart on China - Market size and forecast 2023-2028 ($ million)
- Exhibits86: Data Table on China - Market size and forecast 2023-2028 ($ million)
- Exhibits87: Chart on China - Year-over-year growth 2023-2028 (%)
- Exhibits88: Data Table on China - Year-over-year growth 2023-2028 (%)
- Exhibits89: Chart on Japan - Market size and forecast 2023-2028 ($ million)
- Exhibits90: Data Table on Japan - Market size and forecast 2023-2028 ($ million)
- Exhibits91: Chart on Japan - Year-over-year growth 2023-2028 (%)
- Exhibits92: Data Table on Japan - Year-over-year growth 2023-2028 (%)
- Exhibits93: Chart on Germany - Market size and forecast 2023-2028 ($ million)
- Exhibits94: Data Table on Germany - Market size and forecast 2023-2028 ($ million)
- Exhibits95: Chart on Germany - Year-over-year growth 2023-2028 (%)
- Exhibits96: Data Table on Germany - Year-over-year growth 2023-2028 (%)
- Exhibits97: Chart on UK - Market size and forecast 2023-2028 ($ million)
- Exhibits98: Data Table on UK - Market size and forecast 2023-2028 ($ million)
- Exhibits99: Chart on UK - Year-over-year growth 2023-2028 (%)
- Exhibits100: Data Table on UK - Year-over-year growth 2023-2028 (%)
- Exhibits101: Market opportunity By Geographical Landscape ($ million)
- Exhibits102: Data Tables on Market opportunity By Geographical Landscape ($ million)
- Exhibits103: Impact of drivers and challenges in 2023 and 2028
- Exhibits104: Overview on criticality of inputs and factors of differentiation
- Exhibits105: Overview on factors of disruption
- Exhibits106: Impact of key risks on business
- Exhibits107: Companies covered
- Exhibits108: Matrix on companies position and classification
- Exhibits109: Abbott Laboratories - Overview
- Exhibits110: Abbott Laboratories - Business segments
- Exhibits111: Abbott Laboratories - Key news
- Exhibits112: Abbott Laboratories - Key offerings
- Exhibits113: Abbott Laboratories - Segment focus
- Exhibits114: Aesthetic Nutrition - Overview
- Exhibits115: Aesthetic Nutrition - Product / Service
- Exhibits116: Aesthetic Nutrition - Key offerings
- Exhibits117: Amway Corp. - Overview
- Exhibits118: Amway Corp. - Product / Service
- Exhibits119: Amway Corp. - Key news
- Exhibits120: Amway Corp. - Key offerings
- Exhibits121: Archer Daniels Midland Co. - Overview
- Exhibits122: Archer Daniels Midland Co. - Business segments
- Exhibits123: Archer Daniels Midland Co. - Key news
- Exhibits124: Archer Daniels Midland Co. - Key offerings
- Exhibits125: Archer Daniels Midland Co. - Segment focus
- Exhibits126: DM Pharma Marketing Pvt. Ltd. - Overview
- Exhibits127: DM Pharma Marketing Pvt. Ltd. - Product / Service
- Exhibits128: DM Pharma Marketing Pvt. Ltd. - Key offerings
- Exhibits129: GNC Holdings LLC - Overview
- Exhibits130: GNC Holdings LLC - Product / Service
- Exhibits131: GNC Holdings LLC - Key news
- Exhibits132: GNC Holdings LLC - Key offerings
- Exhibits133: Herbalife International of America Inc. - Overview
- Exhibits134: Herbalife International of America Inc. - Product / Service
- Exhibits135: Herbalife International of America Inc. - Key news
- Exhibits136: Herbalife International of America Inc. - Key offerings
- Exhibits137: My Willo Inc. - Overview
- Exhibits138: My Willo Inc. - Product / Service
- Exhibits139: My Willo Inc. - Key offerings
- Exhibits140: Nestle SA - Overview
- Exhibits141: Nestle SA - Business segments
- Exhibits142: Nestle SA - Key news
- Exhibits143: Nestle SA - Key offerings
- Exhibits144: Nestle SA - Segment focus
- Exhibits145: Novartis AG - Overview
- Exhibits146: Novartis AG - Business segments
- Exhibits147: Novartis AG - Key news
- Exhibits148: Novartis AG - Key offerings
- Exhibits149: Novartis AG - Segment focus
- Exhibits150: Otsuka Pharmaceutical Co. Ltd. - Overview
- Exhibits151: Otsuka Pharmaceutical Co. Ltd. - Product / Service
- Exhibits152: Otsuka Pharmaceutical Co. Ltd. - Key offerings
- Exhibits153: USANA Health Science Inc. - Overview
- Exhibits154: USANA Health Science Inc. - Product / Service
- Exhibits155: USANA Health Science Inc. - Key offerings
- Exhibits156: Inclusions checklist
- Exhibits157: Exclusions checklist
- Exhibits158: Currency conversion rates for US$
- Exhibits159: Research methodology
- Exhibits160: Information sources
- Exhibits161: Data validation
- Exhibits162: Validation techniques employed for market sizing
- Exhibits163: Data synthesis
- Exhibits164: 360 degree market analysis
- Exhibits165: List of abbreviations
The pms and menstrual health supplements market is forecasted to grow by USD 5703.5 mn during 2023-2028, accelerating at a CAGR of 4.36% during the forecast period. The report on the pms and menstrual health supplements market provides a holistic analysis, market size and forecast, trends, growth drivers, and challenges, as well as vendor analysis covering around 25 vendors.
The report offers an up-to-date analysis regarding the current market scenario, the latest trends and drivers, and the overall market environment. The market is driven by growing awareness and education regarding womens health issues and menstruation, rising demand for natural remedies, and increasing prevalence of modern lifestyles, stress, and dietary imbalances.
Technavio's pms and menstrual health supplements market is segmented as below:
| Market Scope | |
|---|---|
| Base Year | 2024 |
| End Year | 2028 |
| Series Year | 2024-2028 |
| Growth Momentum | Accelerate |
| YOY 2024 | 4.11% |
| CAGR | 4.36% |
| Incremental Value | $5703.5mn |
By Age Group
- Premenstrual syndrome
- Perimenopause
By Product
- Combined nutritional supplements
- Single nutritional supplements
By Geographical Landscape
- Asia
- North America
- Europe
- Rest of World (ROW)
This study identifies the advancements in technology as one of the prime reasons driving the pms and menstrual health supplements market growth during the next few years. Also, sustainable and ethical pms and menstrual health supplements and increasing mobile apps and digital platforms will lead to sizable demand in the market.
The report on the pms and menstrual health supplements market covers the following areas:
- Pms and menstrual health supplements market sizing
- Pms and menstrual health supplements market forecast
- Pms and menstrual health supplements market industry analysis
The robust vendor analysis is designed to help clients improve their market position, and in line with this, this report provides a detailed analysis of several leading pms and menstrual health supplements market vendors that include Abbott Laboratories, Aesthetic Nutrition, Amway Corp., Archer Daniels Midland Co., DM Pharma Marketing Pvt. Ltd., GNC Holdings LLC, Herbalife International of America Inc., My Willo Inc., Nestle SA, Novartis AG, Otsuka Pharmaceutical Co. Ltd., and USANA Health Science Inc.. Also, the pms and menstrual health supplements market analysis report includes information on upcoming trends and challenges that will influence market growth. This is to help companies strategize and leverage all forthcoming growth opportunities.
The study was conducted using an objective combination of primary and secondary information including inputs from key participants in the industry. The report contains a comprehensive market and vendor landscape in addition to an analysis of the key vendors.
The publisher presents a detailed picture of the market by the way of study, synthesis, and summation of data from multiple sources by an analysis of key parameters such as profit, pricing, competition, and promotions. It presents various market facets by identifying the key industry influencers. The data presented is comprehensive, reliable, and a result of extensive research - both primary and secondary. The market research reports provide a complete competitive landscape and an in-depth vendor selection methodology and analysis using qualitative and quantitative research to forecast the accurate market growth.
Table of Contents
1 Executive Summary
- 1.1 Market overview
- Executive Summary - Chart on Market Overview
- Executive Summary - Data Table on Market Overview
- Executive Summary - Chart on Global Market Characteristics
- Executive Summary - Chart on Market By Geographical Landscape
- Executive Summary - Chart on Market Segmentation by Age Group
- Executive Summary - Chart on Market Segmentation by Product
- Executive Summary - Chart on Incremental Growth
- Executive Summary - Data Table on Incremental Growth
- Executive Summary - Chart on Company Market Positioning
2 Market Landscape
- 2.1 Market ecosystem
- Parent Market
- Data Table on - Parent Market
- 2.2 Market characteristics
- Market characteristics analysis
- 2.3 Value chain analysis
- Value Chain Analysis
3 Market Sizing
- 3.1 Market definition
- Offerings of companies included in the market definition
- 3.2 Market segment analysis
- Market segments
- 3.3 Market size 2023
- 3.4 Market outlook: Forecast for 2023-2028
- Chart on Global - Market size and forecast 2023-2028 ($ million)
- Data Table on Global - Market size and forecast 2023-2028 ($ million)
- Chart on Global Market: Year-over-year growth 2023-2028 (%)
- Data Table on Global Market: Year-over-year growth 2023-2028 (%)
4 Historic Market Size
- 4.1 Global PMS And Menstrual Health Supplements Market 2018 - 2022
- Historic Market Size - Data Table on Global PMS And Menstrual Health Supplements Market 2018 - 2022 ($ million)
- 4.2 Age Group segment analysis 2018 - 2022
- Historic Market Size - Age Group Segment 2018 - 2022 ($ million)
- 4.3 Product segment analysis 2018 - 2022
- Historic Market Size - Product Segment 2018 - 2022 ($ million)
- 4.4 Geography segment analysis 2018 - 2022
- Historic Market Size - Geography Segment 2018 - 2022 ($ million)
- 4.5 Country segment analysis 2018 - 2022
- Historic Market Size - Country Segment 2018 - 2022 ($ million)
5 Five Forces Analysis
- 5.1 Five forces summary
- Five forces analysis - Comparison between 2023 and 2028
- 5.2 Bargaining power of buyers
- Bargaining power of buyers - Impact of key factors 2023 and 2028
- 5.3 Bargaining power of suppliers
- Bargaining power of suppliers - Impact of key factors in 2023 and 2028
- 5.4 Threat of new entrants
- Threat of new entrants - Impact of key factors in 2023 and 2028
- 5.5 Threat of substitutes
- Threat of substitutes - Impact of key factors in 2023 and 2028
- 5.6 Threat of rivalry
- Threat of rivalry - Impact of key factors in 2023 and 2028
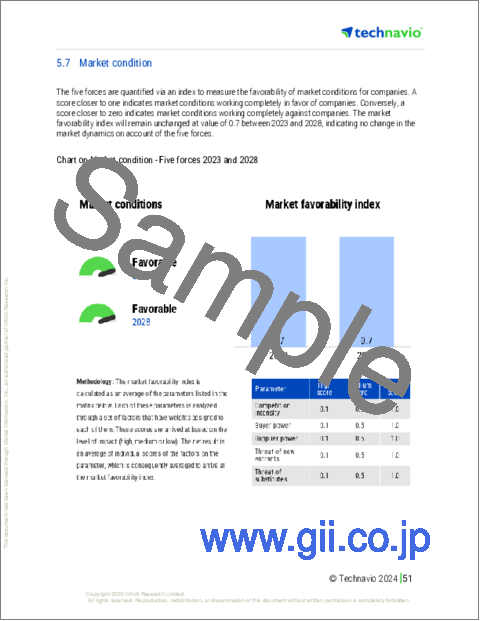
- 5.7 Market condition
- Chart on Market condition - Five forces 2023 and 2028
6 Market Segmentation by Age Group
- 6.1 Market segments
- Chart on Age Group - Market share 2023-2028 (%)
- Data Table on Age Group - Market share 2023-2028 (%)
- 6.2 Comparison by Age Group
- Chart on Comparison by Age Group
- Data Table on Comparison by Age Group
- 6.3 Premenstrual syndrome - Market size and forecast 2023-2028
- Chart on Premenstrual syndrome - Market size and forecast 2023-2028 ($ million)
- Data Table on Premenstrual syndrome - Market size and forecast 2023-2028 ($ million)
- Chart on Premenstrual syndrome - Year-over-year growth 2023-2028 (%)
- Data Table on Premenstrual syndrome - Year-over-year growth 2023-2028 (%)
- 6.4 Perimenopause - Market size and forecast 2023-2028
- Chart on Perimenopause - Market size and forecast 2023-2028 ($ million)
- Data Table on Perimenopause - Market size and forecast 2023-2028 ($ million)
- Chart on Perimenopause - Year-over-year growth 2023-2028 (%)
- Data Table on Perimenopause - Year-over-year growth 2023-2028 (%)
- 6.5 Market opportunity by Age Group
- Market opportunity by Age Group ($ million)
- Data Table on Market opportunity by Age Group ($ million)
7 Market Segmentation by Product
- 7.1 Market segments
- Chart on Product - Market share 2023-2028 (%)
- Data Table on Product - Market share 2023-2028 (%)
- 7.2 Comparison by Product
- Chart on Comparison by Product
- Data Table on Comparison by Product
- 7.3 Combined nutritional supplements - Market size and forecast 2023-2028
- Chart on Combined nutritional supplements - Market size and forecast 2023-2028 ($ million)
- Data Table on Combined nutritional supplements - Market size and forecast 2023-2028 ($ million)
- Chart on Combined nutritional supplements - Year-over-year growth 2023-2028 (%)
- Data Table on Combined nutritional supplements - Year-over-year growth 2023-2028 (%)
- 7.4 Single nutritional supplements - Market size and forecast 2023-2028
- Chart on Single nutritional supplements - Market size and forecast 2023-2028 ($ million)
- Data Table on Single nutritional supplements - Market size and forecast 2023-2028 ($ million)
- Chart on Single nutritional supplements - Year-over-year growth 2023-2028 (%)
- Data Table on Single nutritional supplements - Year-over-year growth 2023-2028 (%)
- 7.5 Market opportunity by Product
- Market opportunity by Product ($ million)
- Data Table on Market opportunity by Product ($ million)
8 Customer Landscape
- 8.1 Customer landscape overview
- Analysis of price sensitivity, lifecycle, customer purchase basket, adoption rates, and purchase criteria
9 Geographic Landscape
- 9.1 Geographic segmentation
- Chart on Market share By Geographical Landscape 2023-2028 (%)
- Data Table on Market share By Geographical Landscape 2023-2028 (%)
- 9.2 Geographic comparison
- Chart on Geographic comparison
- Data Table on Geographic comparison
- 9.3 Asia - Market size and forecast 2023-2028
- Chart on Asia - Market size and forecast 2023-2028 ($ million)
- Data Table on Asia - Market size and forecast 2023-2028 ($ million)
- Chart on Asia - Year-over-year growth 2023-2028 (%)
- Data Table on Asia - Year-over-year growth 2023-2028 (%)
- 9.4 North America - Market size and forecast 2023-2028
- Chart on North America - Market size and forecast 2023-2028 ($ million)
- Data Table on North America - Market size and forecast 2023-2028 ($ million)
- Chart on North America - Year-over-year growth 2023-2028 (%)
- Data Table on North America - Year-over-year growth 2023-2028 (%)
- 9.5 Europe - Market size and forecast 2023-2028
- Chart on Europe - Market size and forecast 2023-2028 ($ million)
- Data Table on Europe - Market size and forecast 2023-2028 ($ million)
- Chart on Europe - Year-over-year growth 2023-2028 (%)
- Data Table on Europe - Year-over-year growth 2023-2028 (%)
- 9.6 Rest of World (ROW) - Market size and forecast 2023-2028
- Chart on Rest of World (ROW) - Market size and forecast 2023-2028 ($ million)
- Data Table on Rest of World (ROW) - Market size and forecast 2023-2028 ($ million)
- Chart on Rest of World (ROW) - Year-over-year growth 2023-2028 (%)
- Data Table on Rest of World (ROW) - Year-over-year growth 2023-2028 (%)
- 9.7 US - Market size and forecast 2023-2028
- Chart on US - Market size and forecast 2023-2028 ($ million)
- Data Table on US - Market size and forecast 2023-2028 ($ million)
- Chart on US - Year-over-year growth 2023-2028 (%)
- Data Table on US - Year-over-year growth 2023-2028 (%)
- 9.8 China - Market size and forecast 2023-2028
- Chart on China - Market size and forecast 2023-2028 ($ million)
- Data Table on China - Market size and forecast 2023-2028 ($ million)
- Chart on China - Year-over-year growth 2023-2028 (%)
- Data Table on China - Year-over-year growth 2023-2028 (%)
- 9.9 Japan - Market size and forecast 2023-2028
- Chart on Japan - Market size and forecast 2023-2028 ($ million)
- Data Table on Japan - Market size and forecast 2023-2028 ($ million)
- Chart on Japan - Year-over-year growth 2023-2028 (%)
- Data Table on Japan - Year-over-year growth 2023-2028 (%)
- 9.10 Germany - Market size and forecast 2023-2028
- Chart on Germany - Market size and forecast 2023-2028 ($ million)
- Data Table on Germany - Market size and forecast 2023-2028 ($ million)
- Chart on Germany - Year-over-year growth 2023-2028 (%)
- Data Table on Germany - Year-over-year growth 2023-2028 (%)
- 9.11 UK - Market size and forecast 2023-2028
- Chart on UK - Market size and forecast 2023-2028 ($ million)
- Data Table on UK - Market size and forecast 2023-2028 ($ million)
- Chart on UK - Year-over-year growth 2023-2028 (%)
- Data Table on UK - Year-over-year growth 2023-2028 (%)
- 9.12 Market opportunity By Geographical Landscape
- Market opportunity By Geographical Landscape ($ million)
- Data Tables on Market opportunity By Geographical Landscape ($ million)
10 Drivers, Challenges, and Opportunity/Restraints
- 10.1 Market drivers
- 10.2 Market challenges
- 10.3 Impact of drivers and challenges
- Impact of drivers and challenges in 2023 and 2028
- 10.4 Market opportunities/restraints
11 Competitive Landscape
- 11.1 Overview
- 11.2 Competitive Landscape
- Overview on criticality of inputs and factors of differentiation
- 11.3 Landscape disruption
- Overview on factors of disruption
- 11.4 Industry risks
- Impact of key risks on business
12 Competitive Analysis
- 12.1 Companies profiled
- Companies covered
- 12.2 Market positioning of companies
- Matrix on companies position and classification
- 12.3 Abbott Laboratories
- Abbott Laboratories - Overview
- Abbott Laboratories - Business segments
- Abbott Laboratories - Key news
- Abbott Laboratories - Key offerings
- Abbott Laboratories - Segment focus
- 12.4 Aesthetic Nutrition
- Aesthetic Nutrition - Overview
- Aesthetic Nutrition - Product / Service
- Aesthetic Nutrition - Key offerings
- 12.5 Amway Corp.
- Amway Corp. - Overview
- Amway Corp. - Product / Service
- Amway Corp. - Key news
- Amway Corp. - Key offerings
- 12.6 Archer Daniels Midland Co.
- Archer Daniels Midland Co. - Overview
- Archer Daniels Midland Co. - Business segments
- Archer Daniels Midland Co. - Key news
- Archer Daniels Midland Co. - Key offerings
- Archer Daniels Midland Co. - Segment focus
- 12.7 DM Pharma Marketing Pvt. Ltd.
- DM Pharma Marketing Pvt. Ltd. - Overview
- DM Pharma Marketing Pvt. Ltd. - Product / Service
- DM Pharma Marketing Pvt. Ltd. - Key offerings
- 12.8 GNC Holdings LLC
- GNC Holdings LLC - Overview
- GNC Holdings LLC - Product / Service
- GNC Holdings LLC - Key news
- GNC Holdings LLC - Key offerings
- 12.9 Herbalife International of America Inc.
- Herbalife International of America Inc. - Overview
- Herbalife International of America Inc. - Product / Service
- Herbalife International of America Inc. - Key news
- Herbalife International of America Inc. - Key offerings
- 12.10 My Willo Inc.
- My Willo Inc. - Overview
- My Willo Inc. - Product / Service
- My Willo Inc. - Key offerings
- 12.11 Nestle SA
- Nestle SA - Overview
- Nestle SA - Business segments
- Nestle SA - Key news
- Nestle SA - Key offerings
- Nestle SA - Segment focus
- 12.12 Novartis AG
- Novartis AG - Overview
- Novartis AG - Business segments
- Novartis AG - Key news
- Novartis AG - Key offerings
- Novartis AG - Segment focus
- 12.13 Otsuka Pharmaceutical Co. Ltd.
- Otsuka Pharmaceutical Co. Ltd. - Overview
- Otsuka Pharmaceutical Co. Ltd. - Product / Service
- Otsuka Pharmaceutical Co. Ltd. - Key offerings
- 12.14 USANA Health Science Inc.
- USANA Health Science Inc. - Overview
- USANA Health Science Inc. - Product / Service
- USANA Health Science Inc. - Key offerings
13 Appendix
- 13.1 Scope of the report
- 13.2 Inclusions and exclusions checklist
- Inclusions checklist
- Exclusions checklist
- 13.3 Currency conversion rates for US$
- Currency conversion rates for US$
- 13.4 Research methodology
- Research methodology
- 13.5 Data procurement
- Information sources
- 13.6 Data validation
- Data validation
- 13.7 Validation techniques employed for market sizing
- Validation techniques employed for market sizing
- 13.8 Data synthesis
- Data synthesis
- 13.9 360 degree market analysis
- 360 degree market analysis
- 13.10 List of abbreviations
- List of abbreviations

