|
|
市場調査レポート
商品コード
1502401
牛ゼラチンの世界市場 2024-2028Global bovine gelatin market 2024-2028 |
||||||

|
|||||||
カスタマイズ可能
|
|||||||

| 牛ゼラチンの世界市場 2024-2028 |
|
出版日: 2024年05月21日
発行: TechNavio
ページ情報: 英文 167 Pages
納期: 即納可能
|

全表示
- 概要
- 図表
- 目次
牛ゼラチン市場は2023-2028年に11億9,920万米ドル、予測期間中のCAGRは9.45%で成長すると予測されます。
当レポートでは、牛ゼラチン市場の全体的な分析、市場規模・予測、動向、成長促進要因、課題、約25のベンダーを網羅したベンダー分析などを掲載しています。
現在の市場シナリオ、最新動向と促進要因、市場環境全体に関する最新分析を提供しています。牛ゼラチン市場は、様々な産業からの牛ゼラチンに対する需要の高まり、食品加工産業における機能性成分としての牛コラーゲンに対する需要の高まり、牛ゼラチンベースのドラッグデリバリーシステムの商業化の高まりによって牽引されています。
| 市場範囲 | |
|---|---|
| 基準年 | 2024 |
| 終了年 | 2028 |
| 予測期間 | 2024-2028 |
| 成長モメンタム | 加速 |
| 前年比2024年 | 8.41% |
| CAGR | 9.45% |
| 増分額 | 11億9,920万米ドル |
本調査では、今後数年間の牛ゼラチン市場成長を牽引する主な要因の一つとして、有機栽培された牛ゼラチンに対する需要の高まりを挙げています。また、植物由来のゲル化剤の出現や、強化菓子類やスポーツ栄養における牛ゼラチンの利用は、市場の大きな需要につながるであろう。
目次
第1章 エグゼクティブサマリー
- 市場概要
第2章 市場情勢
- 市場エコシステム
- 市場の特徴
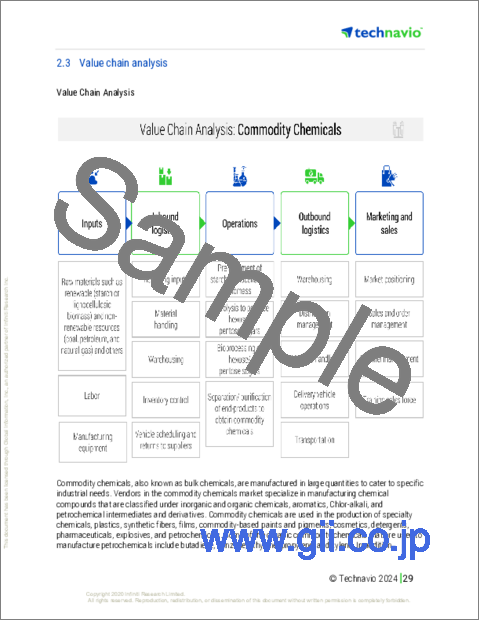
- バリューチェーン分析
第3章 市場規模の評価
- 市場の定義
- 市場セグメント分析
- 市場規模 2023
- 市場の見通し 2023-2028
第4章 市場規模実績
- 世界牛ゼラチン市場 2018-2022
- タイプ別セグメント分析 2018-2022
- 製品別タイプセグメント分析 2018-2022
- 地域別セグメント分析 2018-2022
- 国別セグメント分析 2018-2022
第5章 ファイブフォース分析
- ファイブフォースの要約
- 買い手の交渉力
- 供給企業の交渉力
- 新規参入業者の脅威
- 代替品の脅威
- 競争の脅威
- 市況
第6章 市場セグメンテーション:タイプ別
- 市場セグメンテーション
- 比較:タイプ別
- タイプA:市場規模と予測 2023-2028
- タイプB:市場規模と予測 2023-2028
- 市場機会:タイプ別
第7章 市場セグメンテーション:製品タイプ別
- 市場セグメンテーション
- 比較:製品タイプ別
- カプセルと錠剤:市場規模と予測 2023-2028
- 粉:市場規模と予測 2023-2028
- 液体:市場規模と予測 2023-2028
- 市場機会:製品タイプ別
第8章 顧客情勢
- 顧客情勢の概要
第9章 地域別情勢
- 地域別セグメンテーション
- 地域別比較
- アジア太平洋:市場規模と予測 2023-2028
- 北米:市場規模と予測 2023-2028
- 欧州:市場規模と予測 2023-2028
- 中東・アフリカ:市場規模と予測 2023-2028
- 南米:市場規模と予測 2023-2028
- 米国:市場規模と予測 2023-2028
- 中国:市場規模と予測 2023-2028
- ドイツ:市場規模と予測 2023-2028
- カナダ:市場規模と予測 2023-2028
- フランス:市場規模と予測 2023-2028
- 市場機会:地域別
第10章 促進要因・課題・機会・抑制要因
- 市場促進要因
- 市場の課題
- 促進要因と課題の影響
- 市場の機会・抑制要因
第11章 競合情勢
- 概要
- 競合情勢
- 混乱の状況
- 業界のリスク
第12章 競合分析
- 企業プロファイル
- 企業の市場ポジショニング
- Bernard Jansen Products
- Darling Ingredients Inc.
- El Nasr Gelatin Co.
- Gelita AG
- Great Lakes Wellness Co. LLC
- India Gelatine and Chemicals Ltd.
- Italgel S.r.l.
- Junca Gelatines SL
- Lapi Gelatine Spa
- Merck KGaA
- Nitta Gelatin Inc.
- Sandesara Group of Companies
- SAS Gelatines Weishardt
- Tessenderlo Group NV
- Trobas Gelatine BV
第13章 付録
Exhibits:
- Exhibits1: Executive Summary - Chart on Market Overview
- Exhibits2: Executive Summary - Data Table on Market Overview
- Exhibits3: Executive Summary - Chart on Global Market Characteristics
- Exhibits4: Executive Summary - Chart on Market by Geography
- Exhibits5: Executive Summary - Chart on Market Segmentation by Type
- Exhibits6: Executive Summary - Chart on Market Segmentation by Product Type
- Exhibits7: Executive Summary - Chart on Incremental Growth
- Exhibits8: Executive Summary - Data Table on Incremental Growth
- Exhibits9: Executive Summary - Chart on Company Market Positioning
- Exhibits10: Parent Market
- Exhibits11: Data Table on - Parent Market
- Exhibits12: Market characteristics analysis
- Exhibits13: Value Chain Analysis
- Exhibits14: Offerings of companies included in the market definition
- Exhibits15: Market segments
- Exhibits16: Chart on Global - Market size and forecast 2023-2028 ($ million)
- Exhibits17: Data Table on Global - Market size and forecast 2023-2028 ($ million)
- Exhibits18: Chart on Global Market: Year-over-year growth 2023-2028 (%)
- Exhibits19: Data Table on Global Market: Year-over-year growth 2023-2028 (%)
- Exhibits20: Historic Market Size - Data Table on Global Bovine Gelatin Market 2018 - 2022 ($ million)
- Exhibits21: Historic Market Size - Type Segment 2018 - 2022 ($ million)
- Exhibits22: Historic Market Size - Product Type Segment 2018 - 2022 ($ million)
- Exhibits23: Historic Market Size - Geography Segment 2018 - 2022 ($ million)
- Exhibits24: Historic Market Size - Country Segment 2018 - 2022 ($ million)
- Exhibits25: Five forces analysis - Comparison between 2023 and 2028
- Exhibits26: Bargaining power of buyers - Impact of key factors 2023 and 2028
- Exhibits27: Bargaining power of suppliers - Impact of key factors in 2023 and 2028
- Exhibits28: Threat of new entrants - Impact of key factors in 2023 and 2028
- Exhibits29: Threat of substitutes - Impact of key factors in 2023 and 2028
- Exhibits30: Threat of rivalry - Impact of key factors in 2023 and 2028
- Exhibits31: Chart on Market condition - Five forces 2023 and 2028
- Exhibits32: Chart on Type - Market share 2023-2028 (%)
- Exhibits33: Data Table on Type - Market share 2023-2028 (%)
- Exhibits34: Chart on Comparison by Type
- Exhibits35: Data Table on Comparison by Type
- Exhibits36: Chart on Type A - Market size and forecast 2023-2028 ($ million)
- Exhibits37: Data Table on Type A - Market size and forecast 2023-2028 ($ million)
- Exhibits38: Chart on Type A - Year-over-year growth 2023-2028 (%)
- Exhibits39: Data Table on Type A - Year-over-year growth 2023-2028 (%)
- Exhibits40: Chart on Type B - Market size and forecast 2023-2028 ($ million)
- Exhibits41: Data Table on Type B - Market size and forecast 2023-2028 ($ million)
- Exhibits42: Chart on Type B - Year-over-year growth 2023-2028 (%)
- Exhibits43: Data Table on Type B - Year-over-year growth 2023-2028 (%)
- Exhibits44: Market opportunity by Type ($ million)
- Exhibits45: Data Table on Market opportunity by Type ($ million)
- Exhibits46: Chart on Product Type - Market share 2023-2028 (%)
- Exhibits47: Data Table on Product Type - Market share 2023-2028 (%)
- Exhibits48: Chart on Comparison by Product Type
- Exhibits49: Data Table on Comparison by Product Type
- Exhibits50: Chart on Capsules and tablets - Market size and forecast 2023-2028 ($ million)
- Exhibits51: Data Table on Capsules and tablets - Market size and forecast 2023-2028 ($ million)
- Exhibits52: Chart on Capsules and tablets - Year-over-year growth 2023-2028 (%)
- Exhibits53: Data Table on Capsules and tablets - Year-over-year growth 2023-2028 (%)
- Exhibits54: Chart on Powder - Market size and forecast 2023-2028 ($ million)
- Exhibits55: Data Table on Powder - Market size and forecast 2023-2028 ($ million)
- Exhibits56: Chart on Powder - Year-over-year growth 2023-2028 (%)
- Exhibits57: Data Table on Powder - Year-over-year growth 2023-2028 (%)
- Exhibits58: Chart on Liquid - Market size and forecast 2023-2028 ($ million)
- Exhibits59: Data Table on Liquid - Market size and forecast 2023-2028 ($ million)
- Exhibits60: Chart on Liquid - Year-over-year growth 2023-2028 (%)
- Exhibits61: Data Table on Liquid - Year-over-year growth 2023-2028 (%)
- Exhibits62: Market opportunity by Product Type ($ million)
- Exhibits63: Data Table on Market opportunity by Product Type ($ million)
- Exhibits64: Analysis of price sensitivity, lifecycle, customer purchase basket, adoption rates, and purchase criteria
- Exhibits65: Chart on Market share By Geographical Landscape2023-2028 (%)
- Exhibits66: Data Table on Market share By Geographical Landscape2023-2028 (%)
- Exhibits67: Chart on Geographic comparison
- Exhibits68: Data Table on Geographic comparison
- Exhibits69: Chart on APAC - Market size and forecast 2023-2028 ($ million)
- Exhibits70: Data Table on APAC - Market size and forecast 2023-2028 ($ million)
- Exhibits71: Chart on APAC - Year-over-year growth 2023-2028 (%)
- Exhibits72: Data Table on APAC - Year-over-year growth 2023-2028 (%)
- Exhibits73: Chart on North America - Market size and forecast 2023-2028 ($ million)
- Exhibits74: Data Table on North America - Market size and forecast 2023-2028 ($ million)
- Exhibits75: Chart on North America - Year-over-year growth 2023-2028 (%)
- Exhibits76: Data Table on North America - Year-over-year growth 2023-2028 (%)
- Exhibits77: Chart on Europe - Market size and forecast 2023-2028 ($ million)
- Exhibits78: Data Table on Europe - Market size and forecast 2023-2028 ($ million)
- Exhibits79: Chart on Europe - Year-over-year growth 2023-2028 (%)
- Exhibits80: Data Table on Europe - Year-over-year growth 2023-2028 (%)
- Exhibits81: Chart on Middle East and Africa - Market size and forecast 2023-2028 ($ million)
- Exhibits82: Data Table on Middle East and Africa - Market size and forecast 2023-2028 ($ million)
- Exhibits83: Chart on Middle East and Africa - Year-over-year growth 2023-2028 (%)
- Exhibits84: Data Table on Middle East and Africa - Year-over-year growth 2023-2028 (%)
- Exhibits85: Chart on South America - Market size and forecast 2023-2028 ($ million)
- Exhibits86: Data Table on South America - Market size and forecast 2023-2028 ($ million)
- Exhibits87: Chart on South America - Year-over-year growth 2023-2028 (%)
- Exhibits88: Data Table on South America - Year-over-year growth 2023-2028 (%)
- Exhibits89: Chart on US - Market size and forecast 2023-2028 ($ million)
- Exhibits90: Data Table on US - Market size and forecast 2023-2028 ($ million)
- Exhibits91: Chart on US - Year-over-year growth 2023-2028 (%)
- Exhibits92: Data Table on US - Year-over-year growth 2023-2028 (%)
- Exhibits93: Chart on China - Market size and forecast 2023-2028 ($ million)
- Exhibits94: Data Table on China - Market size and forecast 2023-2028 ($ million)
- Exhibits95: Chart on China - Year-over-year growth 2023-2028 (%)
- Exhibits96: Data Table on China - Year-over-year growth 2023-2028 (%)
- Exhibits97: Chart on Germany - Market size and forecast 2023-2028 ($ million)
- Exhibits98: Data Table on Germany - Market size and forecast 2023-2028 ($ million)
- Exhibits99: Chart on Germany - Year-over-year growth 2023-2028 (%)
- Exhibits100: Data Table on Germany - Year-over-year growth 2023-2028 (%)
- Exhibits101: Chart on Canada - Market size and forecast 2023-2028 ($ million)
- Exhibits102: Data Table on Canada - Market size and forecast 2023-2028 ($ million)
- Exhibits103: Chart on Canada - Year-over-year growth 2023-2028 (%)
- Exhibits104: Data Table on Canada - Year-over-year growth 2023-2028 (%)
- Exhibits105: Chart on France - Market size and forecast 2023-2028 ($ million)
- Exhibits106: Data Table on France - Market size and forecast 2023-2028 ($ million)
- Exhibits107: Chart on France - Year-over-year growth 2023-2028 (%)
- Exhibits108: Data Table on France - Year-over-year growth 2023-2028 (%)
- Exhibits109: Market opportunity By Geographical Landscape($ million)
- Exhibits110: Data Tables on Market opportunity By Geographical Landscape($ million)
- Exhibits111: Impact of drivers and challenges in 2023 and 2028
- Exhibits112: Overview on criticality of inputs and factors of differentiation
- Exhibits113: Overview on factors of disruption
- Exhibits114: Impact of key risks on business
- Exhibits115: Companies covered
- Exhibits116: Matrix on companies position and classification
- Exhibits117: Bernard Jansen Products - Overview
- Exhibits118: Bernard Jansen Products - Product / Service
- Exhibits119: Bernard Jansen Products - Key offerings
- Exhibits120: Darling Ingredients Inc. - Overview
- Exhibits121: Darling Ingredients Inc. - Business segments
- Exhibits122: Darling Ingredients Inc. - Key news
- Exhibits123: Darling Ingredients Inc. - Key offerings
- Exhibits124: Darling Ingredients Inc. - Segment focus
- Exhibits125: El Nasr Gelatin Co. - Overview
- Exhibits126: El Nasr Gelatin Co. - Product / Service
- Exhibits127: El Nasr Gelatin Co. - Key offerings
- Exhibits128: Gelita AG - Overview
- Exhibits129: Gelita AG - Product / Service
- Exhibits130: Gelita AG - Key offerings
- Exhibits131: Great Lakes Wellness Co. LLC - Overview
- Exhibits132: Great Lakes Wellness Co. LLC - Product / Service
- Exhibits133: Great Lakes Wellness Co. LLC - Key offerings
- Exhibits134: India Gelatine and Chemicals Ltd. - Overview
- Exhibits135: India Gelatine and Chemicals Ltd. - Product / Service
- Exhibits136: India Gelatine and Chemicals Ltd. - Key offerings
- Exhibits137: Italgel S.r.l. - Overview
- Exhibits138: Italgel S.r.l. - Product / Service
- Exhibits139: Italgel S.r.l. - Key offerings
- Exhibits140: Junca Gelatines SL - Overview
- Exhibits141: Junca Gelatines SL - Product / Service
- Exhibits142: Junca Gelatines SL - Key offerings
- Exhibits143: Lapi Gelatine Spa - Overview
- Exhibits144: Lapi Gelatine Spa - Product / Service
- Exhibits145: Lapi Gelatine Spa - Key offerings
- Exhibits146: Merck KGaA - Overview
- Exhibits147: Merck KGaA - Business segments
- Exhibits148: Merck KGaA - Key news
- Exhibits149: Merck KGaA - Key offerings
- Exhibits150: Merck KGaA - Segment focus
- Exhibits151: Nitta Gelatin Inc. - Overview
- Exhibits152: Nitta Gelatin Inc. - Product / Service
- Exhibits153: Nitta Gelatin Inc. - Key offerings
- Exhibits154: Sandesara Group of Companies - Overview
- Exhibits155: Sandesara Group of Companies - Product / Service
- Exhibits156: Sandesara Group of Companies - Key offerings
- Exhibits157: SAS Gelatines Weishardt - Overview
- Exhibits158: SAS Gelatines Weishardt - Product / Service
- Exhibits159: SAS Gelatines Weishardt - Key offerings
- Exhibits160: Tessenderlo Group NV - Overview
- Exhibits161: Tessenderlo Group NV - Business segments
- Exhibits162: Tessenderlo Group NV - Key offerings
- Exhibits163: Tessenderlo Group NV - Segment focus
- Exhibits164: Trobas Gelatine BV - Overview
- Exhibits165: Trobas Gelatine BV - Product / Service
- Exhibits166: Trobas Gelatine BV - Key offerings
- Exhibits167: Inclusions checklist
- Exhibits168: Exclusions checklist
- Exhibits169: Currency conversion rates for US$
- Exhibits170: Research methodology
- Exhibits171: Information sources
- Exhibits172: Data validation
- Exhibits173: Validation techniques employed for market sizing
- Exhibits174: Data synthesis
- Exhibits175: 360 degree market analysis
- Exhibits176: List of abbreviations
The bovine gelatin market is forecasted to grow by USD 1199.2 mn during 2023-2028, accelerating at a CAGR of 9.45% during the forecast period. The report on the bovine gelatin market provides a holistic analysis, market size and forecast, trends, growth drivers, and challenges, as well as vendor analysis covering around 25 vendors.
The report offers an up-to-date analysis regarding the current market scenario, the latest trends and drivers, and the overall market environment. The market is driven by rising demand for bovine gelatin from various industries, increasing demand for bovine collagen as functional ingredient in food processing industry, and rising commercialization of bovine gelatin-based drug delivery system.
Technavio's bovine gelatin market is segmented as below:
| Market Scope | |
|---|---|
| Base Year | 2024 |
| End Year | 2028 |
| Series Year | 2024-2028 |
| Growth Momentum | Accelerate |
| YOY 2024 | 8.41% |
| CAGR | 9.45% |
| Incremental Value | $1199.2mn |
By Type
- Type A
- Type B
By Product Type
- Capsules and tablets
- Powder
- Liquid
By Geography
- APAC
- North America
- Europe
- Middle East and Africa
- South America
This study identifies the growing demand for organically sourced bovine gelatin as one of the prime reasons driving the bovine gelatin market growth during the next few years. Also, emergence of plant-based gelling agents and utilization of bovine gelatin in fortified confectionery and sports nutrition will lead to sizable demand in the market.
The report on the bovine gelatin market covers the following areas:
- Bovine gelatin market sizing
- Bovine gelatin market forecast
- Bovine gelatin market industry analysis
The robust vendor analysis is designed to help clients improve their market position, and in line with this, this report provides a detailed analysis of several leading bovine gelatin market vendors that include Bernard Jansen Products, Darling Ingredients Inc., El Nasr Gelatin Co., Gelita AG, Great Lakes Wellness Co. LLC, India Gelatine and Chemicals Ltd., Italgel S.r.l., Jellice Pioneer Europe B.V., Junca Gelatines SL, Lapi Gelatine Spa, Merck KGaA, Nitta Gelatin Inc., NOW Health Group Inc., Organika Health Products Inc., Sandesara Group of Companies, SAS Gelatines Weishardt, Suheung Co. Ltd., Tessenderlo Group NV, Trobas Gelatine BV, and Zint LLC. Also, the bovine gelatin market analysis report includes information on upcoming trends and challenges that will influence market growth. This is to help companies strategize and leverage all forthcoming growth opportunities.
The study was conducted using an objective combination of primary and secondary information including inputs from key participants in the industry. The report contains a comprehensive market and vendor landscape in addition to an analysis of the key vendors.
The publisher presents a detailed picture of the market by the way of study, synthesis, and summation of data from multiple sources by an analysis of key parameters such as profit, pricing, competition, and promotions. It presents various market facets by identifying the key industry influencers. The data presented is comprehensive, reliable, and a result of extensive research - both primary and secondary. The market research reports provide a complete competitive landscape and an in-depth vendor selection methodology and analysis using qualitative and quantitative research to forecast the accurate market growth.
Table of Contents
1 Executive Summary
- 1.1 Market overview
- Executive Summary - Chart on Market Overview
- Executive Summary - Data Table on Market Overview
- Executive Summary - Chart on Global Market Characteristics
- Executive Summary - Chart on Market by Geography
- Executive Summary - Chart on Market Segmentation by Type
- Executive Summary - Chart on Market Segmentation by Product Type
- Executive Summary - Chart on Incremental Growth
- Executive Summary - Data Table on Incremental Growth
- Executive Summary - Chart on Company Market Positioning
2 Market Landscape
- 2.1 Market ecosystem
- Parent Market
- Data Table on - Parent Market
- 2.2 Market characteristics
- Market characteristics analysis
- 2.3 Value chain analysis
- Value Chain Analysis
3 Market Sizing
- 3.1 Market definition
- Offerings of companies included in the market definition
- 3.2 Market segment analysis
- Market segments
- 3.3 Market size 2023
- 3.4 Market outlook: Forecast for 2023-2028
- Chart on Global - Market size and forecast 2023-2028 ($ million)
- Data Table on Global - Market size and forecast 2023-2028 ($ million)
- Chart on Global Market: Year-over-year growth 2023-2028 (%)
- Data Table on Global Market: Year-over-year growth 2023-2028 (%)
4 Historic Market Size
- 4.1 Global Bovine Gelatin Market 2018 - 2022
- Historic Market Size - Data Table on Global Bovine Gelatin Market 2018 - 2022 ($ million)
- 4.2 Type segment analysis 2018 - 2022
- Historic Market Size - Type Segment 2018 - 2022 ($ million)
- 4.3 Product Type segment analysis 2018 - 2022
- Historic Market Size - Product Type Segment 2018 - 2022 ($ million)
- 4.4 Geography segment analysis 2018 - 2022
- Historic Market Size - Geography Segment 2018 - 2022 ($ million)
- 4.5 Country segment analysis 2018 - 2022
- Historic Market Size - Country Segment 2018 - 2022 ($ million)
5 Five Forces Analysis
- 5.1 Five forces summary
- Five forces analysis - Comparison between 2023 and 2028
- 5.2 Bargaining power of buyers
- Bargaining power of buyers - Impact of key factors 2023 and 2028
- 5.3 Bargaining power of suppliers
- Bargaining power of suppliers - Impact of key factors in 2023 and 2028
- 5.4 Threat of new entrants
- Threat of new entrants - Impact of key factors in 2023 and 2028
- 5.5 Threat of substitutes
- Threat of substitutes - Impact of key factors in 2023 and 2028
- 5.6 Threat of rivalry
- Threat of rivalry - Impact of key factors in 2023 and 2028
- 5.7 Market condition
- Chart on Market condition - Five forces 2023 and 2028
6 Market Segmentation by Type
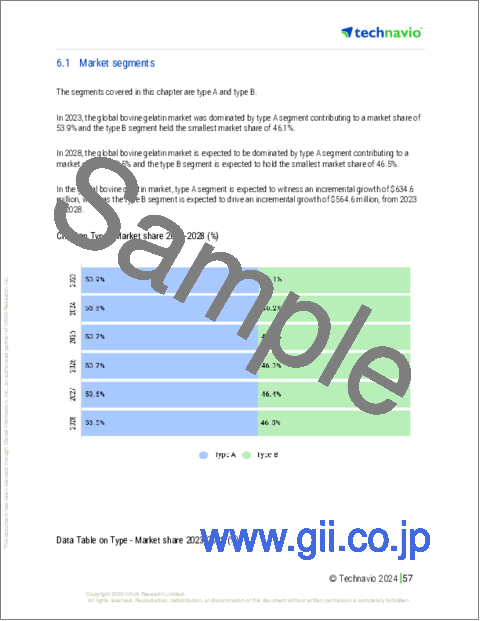
- 6.1 Market segments
- Chart on Type - Market share 2023-2028 (%)
- Data Table on Type - Market share 2023-2028 (%)
- 6.2 Comparison by Type
- Chart on Comparison by Type
- Data Table on Comparison by Type
- 6.3 Type A - Market size and forecast 2023-2028
- Chart on Type A - Market size and forecast 2023-2028 ($ million)
- Data Table on Type A - Market size and forecast 2023-2028 ($ million)
- Chart on Type A - Year-over-year growth 2023-2028 (%)
- Data Table on Type A - Year-over-year growth 2023-2028 (%)
- 6.4 Type B - Market size and forecast 2023-2028
- Chart on Type B - Market size and forecast 2023-2028 ($ million)
- Data Table on Type B - Market size and forecast 2023-2028 ($ million)
- Chart on Type B - Year-over-year growth 2023-2028 (%)
- Data Table on Type B - Year-over-year growth 2023-2028 (%)
- 6.5 Market opportunity by Type
- Market opportunity by Type ($ million)
- Data Table on Market opportunity by Type ($ million)
7 Market Segmentation by Product Type
- 7.1 Market segments
- Chart on Product Type - Market share 2023-2028 (%)
- Data Table on Product Type - Market share 2023-2028 (%)
- 7.2 Comparison by Product Type
- Chart on Comparison by Product Type
- Data Table on Comparison by Product Type
- 7.3 Capsules and tablets - Market size and forecast 2023-2028
- Chart on Capsules and tablets - Market size and forecast 2023-2028 ($ million)
- Data Table on Capsules and tablets - Market size and forecast 2023-2028 ($ million)
- Chart on Capsules and tablets - Year-over-year growth 2023-2028 (%)
- Data Table on Capsules and tablets - Year-over-year growth 2023-2028 (%)
- 7.4 Powder - Market size and forecast 2023-2028
- Chart on Powder - Market size and forecast 2023-2028 ($ million)
- Data Table on Powder - Market size and forecast 2023-2028 ($ million)
- Chart on Powder - Year-over-year growth 2023-2028 (%)
- Data Table on Powder - Year-over-year growth 2023-2028 (%)
- 7.5 Liquid - Market size and forecast 2023-2028
- Chart on Liquid - Market size and forecast 2023-2028 ($ million)
- Data Table on Liquid - Market size and forecast 2023-2028 ($ million)
- Chart on Liquid - Year-over-year growth 2023-2028 (%)
- Data Table on Liquid - Year-over-year growth 2023-2028 (%)
- 7.6 Market opportunity by Product Type
- Market opportunity by Product Type ($ million)
- Data Table on Market opportunity by Product Type ($ million)
8 Customer Landscape
- 8.1 Customer landscape overview
- Analysis of price sensitivity, lifecycle, customer purchase basket, adoption rates, and purchase criteria
9 Geographic Landscape
- 9.1 Geographic segmentation
- Chart on Market share By Geographical Landscape2023-2028 (%)
- Data Table on Market share By Geographical Landscape2023-2028 (%)
- 9.2 Geographic comparison
- Chart on Geographic comparison
- Data Table on Geographic comparison
- 9.3 APAC - Market size and forecast 2023-2028
- Chart on APAC - Market size and forecast 2023-2028 ($ million)
- Data Table on APAC - Market size and forecast 2023-2028 ($ million)
- Chart on APAC - Year-over-year growth 2023-2028 (%)
- Data Table on APAC - Year-over-year growth 2023-2028 (%)
- 9.4 North America - Market size and forecast 2023-2028
- Chart on North America - Market size and forecast 2023-2028 ($ million)
- Data Table on North America - Market size and forecast 2023-2028 ($ million)
- Chart on North America - Year-over-year growth 2023-2028 (%)
- Data Table on North America - Year-over-year growth 2023-2028 (%)
- 9.5 Europe - Market size and forecast 2023-2028
- Chart on Europe - Market size and forecast 2023-2028 ($ million)
- Data Table on Europe - Market size and forecast 2023-2028 ($ million)
- Chart on Europe - Year-over-year growth 2023-2028 (%)
- Data Table on Europe - Year-over-year growth 2023-2028 (%)
- 9.6 Middle East and Africa - Market size and forecast 2023-2028
- Chart on Middle East and Africa - Market size and forecast 2023-2028 ($ million)
- Data Table on Middle East and Africa - Market size and forecast 2023-2028 ($ million)
- Chart on Middle East and Africa - Year-over-year growth 2023-2028 (%)
- Data Table on Middle East and Africa - Year-over-year growth 2023-2028 (%)
- 9.7 South America - Market size and forecast 2023-2028
- Chart on South America - Market size and forecast 2023-2028 ($ million)
- Data Table on South America - Market size and forecast 2023-2028 ($ million)
- Chart on South America - Year-over-year growth 2023-2028 (%)
- Data Table on South America - Year-over-year growth 2023-2028 (%)
- 9.8 US - Market size and forecast 2023-2028
- Chart on US - Market size and forecast 2023-2028 ($ million)
- Data Table on US - Market size and forecast 2023-2028 ($ million)
- Chart on US - Year-over-year growth 2023-2028 (%)
- Data Table on US - Year-over-year growth 2023-2028 (%)
- 9.9 China - Market size and forecast 2023-2028
- Chart on China - Market size and forecast 2023-2028 ($ million)
- Data Table on China - Market size and forecast 2023-2028 ($ million)
- Chart on China - Year-over-year growth 2023-2028 (%)
- Data Table on China - Year-over-year growth 2023-2028 (%)
- 9.10 Germany - Market size and forecast 2023-2028
- Chart on Germany - Market size and forecast 2023-2028 ($ million)
- Data Table on Germany - Market size and forecast 2023-2028 ($ million)
- Chart on Germany - Year-over-year growth 2023-2028 (%)
- Data Table on Germany - Year-over-year growth 2023-2028 (%)
- 9.11 Canada - Market size and forecast 2023-2028
- Chart on Canada - Market size and forecast 2023-2028 ($ million)
- Data Table on Canada - Market size and forecast 2023-2028 ($ million)
- Chart on Canada - Year-over-year growth 2023-2028 (%)
- Data Table on Canada - Year-over-year growth 2023-2028 (%)
- 9.12 France - Market size and forecast 2023-2028
- Chart on France - Market size and forecast 2023-2028 ($ million)
- Data Table on France - Market size and forecast 2023-2028 ($ million)
- Chart on France - Year-over-year growth 2023-2028 (%)
- Data Table on France - Year-over-year growth 2023-2028 (%)
- 9.13 Market opportunity by geography
- Market opportunity By Geographical Landscape($ million)
- Data Tables on Market opportunity By Geographical Landscape($ million)
10 Drivers, Challenges, and Opportunity/Restraints
- 10.1 Market drivers
- 10.2 Market challenges
- 10.3 Impact of drivers and challenges
- Impact of drivers and challenges in 2023 and 2028
- 10.4 Market opportunities/restraints
11 Competitive Landscape
- 11.1 Overview
- 11.2 Competitive Landscape
- Overview on criticality of inputs and factors of differentiation
- 11.3 Landscape disruption
- Overview on factors of disruption
- 11.4 Industry risks
- Impact of key risks on business
12 Competitive Analysis
- 12.1 Companies profiled
- Companies covered
- 12.2 Market positioning of companies
- Matrix on companies position and classification
- 12.3 Bernard Jansen Products
- Bernard Jansen Products - Overview
- Bernard Jansen Products - Product / Service
- Bernard Jansen Products - Key offerings
- 12.4 Darling Ingredients Inc.
- Darling Ingredients Inc. - Overview
- Darling Ingredients Inc. - Business segments
- Darling Ingredients Inc. - Key news
- Darling Ingredients Inc. - Key offerings
- Darling Ingredients Inc. - Segment focus
- 12.5 El Nasr Gelatin Co.
- El Nasr Gelatin Co. - Overview
- El Nasr Gelatin Co. - Product / Service
- El Nasr Gelatin Co. - Key offerings
- 12.6 Gelita AG
- Gelita AG - Overview
- Gelita AG - Product / Service
- Gelita AG - Key offerings
- 12.7 Great Lakes Wellness Co. LLC
- Great Lakes Wellness Co. LLC - Overview
- Great Lakes Wellness Co. LLC - Product / Service
- Great Lakes Wellness Co. LLC - Key offerings
- 12.8 India Gelatine and Chemicals Ltd.
- India Gelatine and Chemicals Ltd. - Overview
- India Gelatine and Chemicals Ltd. - Product / Service
- India Gelatine and Chemicals Ltd. - Key offerings
- 12.9 Italgel S.r.l.
- Italgel S.r.l. - Overview
- Italgel S.r.l. - Product / Service
- Italgel S.r.l. - Key offerings
- 12.10 Junca Gelatines SL
- Junca Gelatines SL - Overview
- Junca Gelatines SL - Product / Service
- Junca Gelatines SL - Key offerings
- 12.11 Lapi Gelatine Spa
- Lapi Gelatine Spa - Overview
- Lapi Gelatine Spa - Product / Service
- Lapi Gelatine Spa - Key offerings
- 12.12 Merck KGaA
- Merck KGaA - Overview
- Merck KGaA - Business segments
- Merck KGaA - Key news
- Merck KGaA - Key offerings
- Merck KGaA - Segment focus
- 12.13 Nitta Gelatin Inc.
- Nitta Gelatin Inc. - Overview
- Nitta Gelatin Inc. - Product / Service
- Nitta Gelatin Inc. - Key offerings
- 12.14 Sandesara Group of Companies
- Sandesara Group of Companies - Overview
- Sandesara Group of Companies - Product / Service
- Sandesara Group of Companies - Key offerings
- 12.15 SAS Gelatines Weishardt
- SAS Gelatines Weishardt - Overview
- SAS Gelatines Weishardt - Product / Service
- SAS Gelatines Weishardt - Key offerings
- 12.16 Tessenderlo Group NV
- Tessenderlo Group NV - Overview
- Tessenderlo Group NV - Business segments
- Tessenderlo Group NV - Key offerings
- Tessenderlo Group NV - Segment focus
- 12.17 Trobas Gelatine BV
- Trobas Gelatine BV - Overview
- Trobas Gelatine BV - Product / Service
- Trobas Gelatine BV - Key offerings
13 Appendix
- 13.1 Scope of the report
- 13.2 Inclusions and exclusions checklist
- Inclusions checklist
- Exclusions checklist
- 13.3 Currency conversion rates for US$
- Currency conversion rates for US$
- 13.4 Research methodology
- Research methodology
- 13.5 Data procurement
- Information sources
- 13.6 Data validation
- Data validation
- 13.7 Validation techniques employed for market sizing
- Validation techniques employed for market sizing
- 13.8 Data synthesis
- Data synthesis
- 13.9 360 degree market analysis
- 360 degree market analysis
- 13.10 List of abbreviations
- List of abbreviations
