|
|
市場調査レポート
商品コード
1859857
バイオプロセス用バッグの世界市場 2025-2029Global Bioprocess Bags Market 2025-2029 |
||||||
|
|||||||
カスタマイズ可能
|
|||||||


| バイオプロセス用バッグの世界市場 2025-2029 |
|
出版日: 2025年08月29日
発行: TechNavio
ページ情報: 英文 233 Pages
納期: 即納可能
|

概要
バイオプロセス用バッグ市場は2024-2029年に51億8,630万米ドル、予測期間中のCAGRは18.2%で成長すると予測されます。
当レポートでは、バイオプロセス用バッグ市場の全体的な分析、市場規模・予測、動向、成長促進要因、課題、約25のベンダーを網羅したベンダー分析などを掲載しています。
現在の市場シナリオ、最新動向と促進要因、市場環境全体に関する最新分析を提供しています。バイオ医薬品需要の高まり、バイオプロセスにおけるシングルユース技術へのシフトの進展、遺伝子・細胞治療の急速な普及などが市場を牽引しています。
| 市場範囲 | |
|---|---|
| 基準年 | 2025 |
| 終了年 | 2029 |
| 予測期間 | 2025-2029 |
| 成長モメンタム | 加速 |
| 前年比 | 16.7% |
| CAGR | 18.2% |
| 増分額 | 51億8,630万米ドル |
本調査は、業界の主要参加者からのインプットを含め、一次情報と二次情報を客観的に組み合わせて実施しました。レポートには、主要企業の分析に加え、包括的な市場規模データ、地域別分析によるセグメント、ベンダー情勢が含まれています。レポートには過去データと予測データがあります。
本調査では、今後数年間のバイオプロセス用バッグ市場の成長を促進する主な要因の1つとして、新しいバイオプロセス用バッグの開拓への注目が高まっていることを挙げています。また、バイオテクノロジーソリューションの製造能力を拡大するための投資の増加や、先端材料の使用に対するバイオプロセス用バッグの注目の高まりは、市場の大きな需要につながるでしょう。
目次
第1章 エグゼクティブサマリー
- 市場概要
第2章 Technavio分析
- 価格・ライフサイクル・顧客購入バスケット・採用率・購入基準の分析
- インプットの重要性と差別化の要因
- 混乱の要因
- 促進要因と課題の影響
第3章 市場情勢
- 市場エコシステム
- 市場の特徴
- バリューチェーン分析
第4章 市場規模
- 市場の定義
- 市場セグメント分析
- 市場規模 2024
- 市場の見通し 2024-2029
第5章 市場規模実績
- バイオプロセス用バッグの世界市場 2019-2023
- 方法セグメント分析 2019-2023
- エンドユーザーセグメント分析 2019-2023
- 製品タイプセグメント分析 2019-2023
- 地域別セグメント分析 2019-2023
- 国別セグメント分析 2019-2023
第6章 定性分析
- 世界のバイオプロセスバッグ市場におけるAIの影響バイオプロセス用バッグの世界市場
第7章 ファイブフォース分析
- ファイブフォースの要約
- 買い手の交渉力
- 供給企業の交渉力
- 新規参入業者の脅威
- 代替品の脅威
- 競争の脅威
- 市況
第8章 市場セグメンテーション:方法別
- 市場セグメント
- 比較:方法別
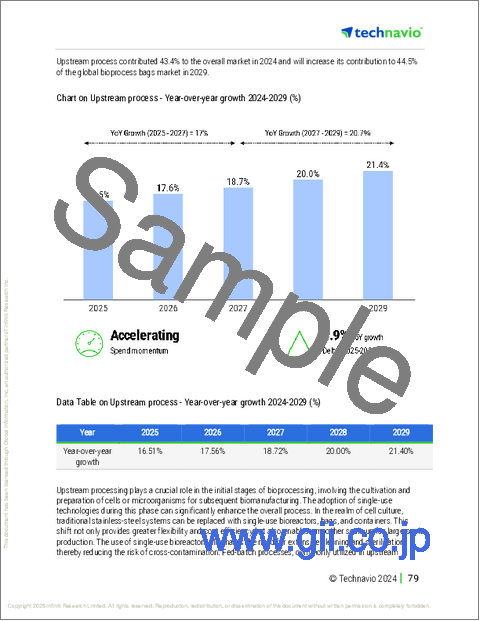
- 上流工程:市場規模と予測 2024-2029
- 下流工程:市場規模と予測 2024-2029
- プロセス開発:市場規模と予測 2024-2029
- 市場機会:方法別
第9章 市場セグメンテーション:エンドユーザー別
- 市場セグメント
- 比較:エンドユーザー別
- 製薬・バイオ医薬品企業:市場規模と予測 2024-2029
- CMOおよびCRO:市場規模と予測 2024-2029
- 学術研究機関:市場規模と予測 2024-2029
- 市場機会:エンドユーザー別
第10章 市場セグメンテーション:製品タイプ別
- 市場セグメント
- 比較:製品タイプ別
- その他のバッグとアクセサリー:市場規模と予測 2024-2029
- 市場機会:製品タイプ別
第11章 顧客情勢
- 顧客情勢の概要
第12章 地域別情勢
- 地域別セグメンテーション
- 地域別比較
- 北米:市場規模と予測 2024-2029
- 欧州:市場規模と予測 2024-2029
- アジア:市場規模と予測 2024-2029
- 世界のその他の地域:市場規模と予測 2024-2029
- 米国:市場規模と予測 2024-2029
- 中国:市場規模と予測 2024-2029
- ドイツ:市場規模と予測 2024-2029
- インド:市場規模と予測 2024-2029
- 英国:市場規模と予測 2024-2029
- カナダ:市場規模と予測 2024-2029
- 日本:市場規模と予測 2024-2029
- フランス:市場規模と予測 2024-2029
- イタリア:市場規模と予測 2024-2029
- ブラジル:市場規模と予測 2024-2029
- 市場機会:地域情勢別
第13章 促進要因・課題・機会・抑制要因
- 市場促進要因
- 市場の課題
- 促進要因と課題の影響
- 市場の機会・抑制要因
第14章 競合情勢
- 概要
- 競合情勢
- 混乱の状況
- 業界のリスク
第15章 競合分析
- 企業プロファイル
- 企業ランキング
- 企業の市場ポジショニング
- Avantor Inc.
- Compagnie de Saint Gobain SA
- Corning Inc.
- Danaher Corp.
- Entegris Inc.
- GE Healthcare Technologies Inc.
- ILC Dover LP
- Lonza Group Ltd.
- Meissner Filtration Products Inc.
- Merck KGaA
- Parker Hannifin Corp.
- Repligen Corp.
- Sartorius AG
- Single Use Support GmbH
- Thermo Fisher Scientific Inc.

