|
|
市場調査レポート
商品コード
1552576
カビ除去サービスの市場規模、シェア、動向分析レポート:表面タイプ別、カビタイプ別、用途別、地域別、セグメント予測、2024年~2030年Mold Remediation Service Market Size, Share & Trends Analysis Report By Surface Type (Wood, Drywall, Tiles & Grout), By Mold Type (Allergic, Pathogenic), By Application, By Region, And Segment Forecasts, 2024 - 2030 |
||||||

|
|||||||
カスタマイズ可能
|
|||||||


| カビ除去サービスの市場規模、シェア、動向分析レポート:表面タイプ別、カビタイプ別、用途別、地域別、セグメント予測、2024年~2030年 |
|
出版日: 2024年08月02日
発行: Grand View Research
ページ情報: 英文 100 Pages
納期: 2~10営業日
|

全表示
- 概要
- 図表
- 目次
カビ除去サービス市場の成長と動向:
Grand View Research, Inc.の最新レポートによると、世界のカビ除去サービス市場規模は2030年までに15億2,000万米ドルに達する見込みです。
同市場は2024年から2030年にかけてCAGR 3.1%で成長すると予測されています。カビへの曝露に伴う健康リスクに対する一般市民の意識の高まりが、市場成長を大きく後押ししています。消費者は、呼吸器系の問題、アレルギー反応、脆弱な人々のより深刻な状態など、カビの潜在的な健康被害に関する知識を深めるにつれ、環境内でカビが検出されたり疑われたりした場合に迅速な行動を取る可能性が高くなります。このような意識は早期発見につながり、カビ除去サービスに従事する可能性も高くなります。
カビの検出と除去技術の技術的進歩は、サービスの効率、精度、効果を高めることで市場の成長を大きく促進しています。赤外線カメラ、水分計、空気サンプリング装置などの検出ツールにより、専門家はカビの成長を初期段階や手の届きにくい場所で特定することができ、より包括的な評価につながります。HEPA空気濾過システム、ドライアイス・ブラスト、酵素洗浄剤などの高度な除去技術は、より徹底的で侵襲性の低い解決策を提供し、物的損害とダウンタイムを削減し、市場の成長に有利に働く可能性が高いです。
カビに関する厳しい建築基準法や衛生基準などの規制強化は、定期的な検査とカビ問題への迅速な対応を義務付けることで、市場の成長を大きく後押ししています。このような規制により、不動産所有者や企業は屋内の空気品質や安全性に関する高い基準を遵守する必要があり、法的要件を遵守するために専門家によるカビ除去が必要となります。コンプライアンス違反は、多額の罰金、法的責任、風評被害につながる可能性があり、カビの繁殖を防ぐための積極的な対策が求められています。その結果、不動産がこうした厳しい基準を満たすための専門的なカビ除去サービスに対する需要が高まり、市場が拡大しています。
インフラの老朽化と不動産市場は、専門的なカビ管理の必要性を高めることで市場の成長を促進しています。老朽化した建物は、建材の老朽化や経年劣化により湿気問題やカビが発生しやすく、安全性と機能性を維持するために頻繁な除去が必要となります。同様に、不動産市場では、カビのない物件の販売や賃貸が求められており、物件の価値や魅力を高めるためのカビ除去の重要性が強調されています。買い手や借り手は健康的な住環境を優先するため、不動産所有者は物件の市場性を確保し、衛生基準に適合させるためにカビ除去サービスに投資せざるを得ず、業界の成長に拍車をかけています。
カビ除去サービス市場レポート・ハイライト
- 2023年の市場シェアは、乾式壁表面タイプのカビ除去サービスがかなりの割合を占める。乾式壁は多孔質であるため湿気を吸収しやすく、カビの繁殖を助長します。カビへの曝露に伴う健康リスクと建物の構造的損傷の可能性が、乾式壁からの徹底的かつ効果的なカビ除去を保証する専門的な除去の需要をさらに促進します。
- 病原性カビタイプに対するカビ除去サービスの需要は、予測期間中に著しい成長を遂げると予想されています。病原性カビタイプのカビ除去サービスの成長は、呼吸器系の問題、感染症、アレルギー反応など、これらのカビがもたらす深刻な健康リスクに対する意識の高まりが原動力となっています。また、診断技術の強化や規制基準の厳格化も、住宅、商業施設、ヘルスケア環境における病原性カビを効果的に特定し根絶するための専門的な除去サービスに対する需要を煽っています。
- 商業用途のカビ除去サービスに対する需要は、予測期間中に大きな成長を遂げると予想されます。この成長は、カビへの暴露に関連する健康リスクに対する意識の高まりと、安全な室内環境を維持するための厳しい規制要件によって促進されます。
- 北米は、2023年の世界収益のかなりの市場シェアを占めています。北米の市場を牽引しているのは、同地域の厳しい建築基準法と衛生規制であり、定期的な検査とカビ問題の迅速な除去が義務付けられています。さらに、ハリケーンや洪水などの自然災害の頻度が増加していることがカビ問題を悪化させ、専門的な除去サービスの需要をさらに押し上げています。
目次
第1章 調査手法と範囲
第2章 エグゼクティブサマリー
第3章 カビ除去サービスの変数、動向、範囲
- 市場系統の見通し
- 浸透と成長の見通しのマッピング
- 業界バリューチェーン分析
- 市場力学
- 市場 促進要因分析
- 市場抑制要因分析
- 市場機会
- 市場の課題
- 業界分析ツール
- ポーターのファイブフォース分析
- 市場参入戦略
第4章 カビ除去サービス市場:消費者行動分析
- 人口統計分析
- 消費者の動向と嗜好
- 購入決定に影響を与える要因
- 消費者製品の採用
- 観察と推奨事項
第5章 カビ除去サービス市場:表面タイプ別推定・動向分析
- カビ除去サービス市場、表面タイプ別:主なポイント
- 表面タイプ別変動分析と市場シェア、2023年と2030年
- 表面タイプ別市場推計・予測、2018年-2030年
第6章 カビ除去サービス市場:カビタイプ別推定・動向分析
- カビ除去サービス市場、カビタイプ別:主なポイント
- カビタイプの変動分析と市場シェア、2023年と2030年
- カビタイプ別市場推計・予測、2018年-2030年
第7章 カビ除去サービス市場:用途別推定・動向分析
- カビ除去サービス市場、用途別:主なポイント
- 用途別変動分析と市場シェア、2023年と2030年
- 用途別、2018年-2030年
- 住宅
- 商業
第8章 カビ除去サービス市場:地域推定・動向分析
- カビ除去サービス市場:地域別展望
- 地域別マーケットプレイス:重要なポイント
- 地域別、2018年-2030年
- 北米
- 欧州
- アジア太平洋
- 中南米
- 中東・アフリカ
第9章 カビ除去サービス市場:競合分析
- 主要市場参入企業による最近の動向と影響分析
- 企業分類
- 参入企業の概要
- 財務実績
- 製品ベンチマーク
- 企業市場シェア分析、2023年(%)
- 企業ヒートマップ分析
- 戦略マッピング
- 企業プロファイル
- 911 Restoration
- AdvantaClean
- AllClean USA
- ASAP Restoration, LLC
- SERVPRO
- ServiceMaster Restore
- Neighborly Company
- Bust Mold Inc.
- PuroClean
- BELFOR
List of Tables
- Table 1. Mold remediation service market: Key market driver analysis
- Table 2. Mold remediation service market: Key market restraint analysis
- Table 3. Mold remediation service market estimates & forecast, by product (USD Billion)
- Table 4. Mold remediation service market estimates & forecast, for wood (USD Billion)
- Table 5. Mold remediation service market estimates & forecast, for drywall (USD Billion)
- Table 6. Mold remediation service market estimates & forecast, for tiles & grout (USD Billion)
- Table 7. Mold remediation service market estimates & forecast, for carpet & upholstery (USD Billion)
- Table 8. Mold remediation service market estimates & forecast, for other surface type (USD Billion)
- Table 9. Mold remediation service market estimates & forecast, by mold type (USD Billion)
- Table 10. Allergic mold remediation service market estimates & forecasts, 2018 - 2030 (USD Billion)
- Table 11. Pathogenic mold remediation service market estimates & forecasts, 2018 - 2030 (USD Billion)
- Table 12. Toxigenic mold remediation service market estimates & forecasts, 2018 - 2030 (USD Billion)
- Table 13. Mold remediation service market estimates & forecast, by application (USD Billion)
- Table 14. Mold remediation service market estimates & forecast, for residential (USD Billion)
- Table 15. Mold remediation service market estimates & forecast, for commercial (USD Billion)
- Table 16. Mold remediation service market estimates & forecast, 2018 - 2030, by region (USD Billion)
- Table 17. North America mold remediation service market estimates and forecast, 2018 - 2030 (USD Billion)
- Table 18. North America mold remediation service market revenue estimates and forecast, by surface type, 2018 - 2030 (USD Billion)
- Table 19. North America mold remediation service market revenue estimates and forecast, by mold type, 2018 - 2030 (USD Billion)
- Table 20. North America mold remediation service market revenue estimates and forecast, by application, 2018 - 2030 (USD Billion)
- Table 21. U.S. macro-economic outlay
- Table 22. U.S. mold remediation service market estimates and forecast, 2018 - 2030 (USD Billion)
- Table 23. U.S. mold remediation service market revenue estimates and forecast, by surface type, 2018 - 2030 (USD Billion)
- Table 24. U.S. mold remediation service market revenue estimates and forecast, by mold type, 2018 - 2030 (USD Billion)
- Table 25. U.S. mold remediation service market revenue estimates and forecast, by application, 2018 - 2030 (USD Billion)
- Table 26. Canada macro-economic outlay
- Table 27. Canada mold remediation service market estimates and forecast, 2018 - 2030 (USD Billion)
- Table 28. Canada mold remediation service market revenue estimates and forecast, by surface type, 2018 - 2030 (USD Billion)
- Table 29. Canada mold remediation service market revenue estimates and forecast, by mold type, 2018 - 2030 (USD Billion)
- Table 30. Canada mold remediation service market revenue estimates and forecast, by application, 2018 - 2030 (USD Billion)
- Table 31. Mexico macro-economic outlay
- Table 32. Mexico mold remediation service market estimates and forecast, 2018 - 2030 (USD Billion)
- Table 33. Mexico mold remediation service market revenue estimates and forecast, by surface type, 2018 - 2030 (USD Billion)
- Table 34. Mexico mold remediation service market revenue estimates and forecast, by mold type, 2018 - 2030 (USD Billion)
- Table 35. Mexico mold remediation service market revenue estimates and forecast, by application, 2018 - 2030 (USD Billion)
- Table 36. Europe mold remediation service market estimates and forecast, 2018 - 2030 (USD Billion)
- Table 37. Europe mold remediation service market revenue estimates and forecast, by surface type, 2018 - 2030 (USD Billion)
- Table 38. Europe mold remediation service market revenue estimates and forecast, by mold type, 2018 - 2030 (USD Billion)
- Table 39. Europe mold remediation service market revenue estimates and forecast, by application, 2018 - 2030 (USD Billion)
- Table 40. UK macro-economic outlay
- Table 41. UK mold remediation service market estimates and forecast, 2018 - 2030 (USD Billion)
- Table 42. UK mold remediation service market revenue estimates and forecast, by surface type, 2018 - 2030 (USD Billion)
- Table 43. UK mold remediation service market revenue estimates and forecast, by mold type, 2018 - 2030 (USD Billion)
- Table 44. UK mold remediation service market revenue estimates and forecast, by application, 2018 - 2030 (USD Billion)
- Table 45. Germany macro-economic outlay
- Table 46. Germany mold remediation service market estimates and forecast, 2018 - 2030 (USD Billion)
- Table 47. Germany mold remediation service market revenue estimates and forecast, by surface type, 2018 - 2030 (USD Billion)
- Table 48. Germany mold remediation service market revenue estimates and forecast, by mold type, 2018 - 2030 (USD Billion)
- Table 49. Germany mold remediation service market revenue estimates and forecast, by application, 2018 - 2030 (USD Billion)
- Table 50. France macro-economic outlay
- Table 51. France mold remediation service market estimates and forecast, 2018 - 2030 (USD Billion)
- Table 52. France mold remediation service market revenue estimates and forecast, by surface type, 2018 - 2030 (USD Billion)
- Table 53. France mold remediation service market revenue estimates and forecast, by mold type, 2018 - 2030 (USD Billion)
- Table 54. France mold remediation service market revenue estimates and forecast, by application, 2018 - 2030 (USD Billion)
- Table 55. Italy macro-economic outlay
- Table 56. Italy mold remediation service market estimates and forecast, 2018 - 2030 (USD Billion)
- Table 57. Italy mold remediation service market revenue estimates and forecast, by surface type, 2018 - 2030 (USD Billion)
- Table 58. Italy mold remediation service market revenue estimates and forecast, by mold type, 2018 - 2030 (USD Billion)
- Table 59. Italy mold remediation service market revenue estimates and forecast, by application, 2018 - 2030 (USD Billion)
- Table 60. Spain macro-economic outlay
- Table 61. Spain mold remediation service market estimates and forecast, 2018 - 2030 (USD Billion)
- Table 62. Spain mold remediation service market revenue estimates and forecast, by surface type, 2018 - 2030 (USD Billion)
- Table 63. Spain mold remediation service market revenue estimates and forecast, by mold type, 2018 - 2030 (USD Billion)
- Table 64. Spain mold remediation service market revenue estimates and forecast, by application, 2018 - 2030 (USD Billion)
- Table 65. Asia Pacific mold remediation service market estimates and forecast, 2018 - 2030 (USD Billion)
- Table 66. Asia Pacific mold remediation service market revenue estimates and forecast, by surface type, 2018 - 2030 (USD Billion)
- Table 67. Asia Pacific mold remediation service market revenue estimates and forecast, by mold type, 2018 - 2030 (USD Billion)
- Table 68. Asia Pacific mold remediation service market revenue estimates and forecast, by application, 2018 - 2030 (USD Billion)
- Table 69. China macro-economic outlay
- Table 70. China mold remediation service market estimates and forecast, 2018 - 2030 (USD Billion)
- Table 71. China mold remediation service market revenue estimates and forecast, by surface type, 2018 - 2030 (USD Billion)
- Table 72. China mold remediation service market revenue estimates and forecast, by mold type, 2018 - 2030 (USD Billion)
- Table 73. China mold remediation service market revenue estimates and forecast, by application, 2018 - 2030 (USD Billion)
- Table 74. India macro-economic outlay
- Table 75. India mold remediation service market estimates and forecast, 2018 - 2030 (USD Billion)
- Table 76. India mold remediation service market revenue estimates and forecast, by surface type, 2018 - 2030 (USD Billion)
- Table 77. India mold remediation service market revenue estimates and forecast, by mold type, 2018 - 2030 (USD Billion)
- Table 78. India mold remediation service market revenue estimates and forecast, by application, 2018 - 2030 (USD Billion)
- Table 79. Japan macro-economic outlay
- Table 80. Japan mold remediation service market estimates and forecast, 2018 - 2030 (USD Billion)
- Table 81. Japan mold remediation service market revenue estimates and forecast, by surface type, 2018 - 2030 (USD Billion)
- Table 82. Japan mold remediation service market revenue estimates and forecast, by mold type, 2018 - 2030 (USD Billion)
- Table 83. Japan mold remediation service market revenue estimates and forecast, by application, 2018 - 2030 (USD Billion)
- Table 84. Australia & New Zealand macro-economic outlay
- Table 85. Australia & New Zealand mold remediation service market estimates and forecast, 2018 - 2030 (USD Billion)
- Table 86. Australia & New Zealand mold remediation service market revenue estimates and forecast, by surface type, 2018 - 2030 (USD Billion)
- Table 87. Australia & New Zealand mold remediation service market revenue estimates and forecast, by mold type, 2018 - 2030 (USD Billion)
- Table 88. Australia & New Zealand mold remediation service market revenue estimates and forecast, by application, 2018 - 2030 (USD Billion)
- Table 89. South Korea macro-economic outlay
- Table 90. South Korea mold remediation service market estimates and forecast, 2018 - 2030 (USD Billion)
- Table 91. South Korea mold remediation service market revenue estimates and forecast, by surface type, 2018 - 2030 (USD Billion)
- Table 92. South Korea mold remediation service market revenue estimates and forecast, by mold type, 2018 - 2030 (USD Billion)
- Table 93. South Korea mold remediation service market revenue estimates and forecast, by application, 2018 - 2030 (USD Billion)
- Table 94. Central & South America mold remediation service market estimates and forecast, 2018 - 2030 (USD Billion)
- Table 95. Central & South America mold remediation service market revenue estimates and forecast, by surface type, 2018 - 2030 (USD Billion)
- Table 96. Central & South America mold remediation service market revenue estimates and forecast, by mold type, 2018 - 2030 (USD Billion)
- Table 97. Central & South America mold remediation service market revenue estimates and forecast, by application, 2018 - 2030 (USD Billion)
- Table 98. Brazil macro-economic outlay
- Table 99. Brazil mold remediation service market estimates and forecast, 2018 - 2030 (USD Billion)
- Table 100. Brazil mold remediation service market revenue estimates and forecast, by surface type, 2018 - 2030 (USD Billion)
- Table 101. Brazil mold remediation service market revenue estimates and forecast, by mold type, 2018 - 2030 (USD Billion)
- Table 102. Brazil mold remediation service market revenue estimates and forecast, by application, 2018 - 2030 (USD Billion)
- Table 103. Middle East & Africa mold remediation service market estimates and forecast, 2018 - 2030 (USD Billion)
- Table 104. Middle East & Africa mold remediation service market revenue estimates and forecast, by surface type, 2018 - 2030 (USD Billion)
- Table 105. Middle East & Africa mold remediation service market revenue estimates and forecast, by mold type, 2018 - 2030 (USD Billion)
- Table 106. Middle East & Africa mold remediation service market revenue estimates and forecast, by application, 2018 - 2030 (USD Billion)
- Table 107. South Africa macro-economic outlay
- Table 108. South Africa mold remediation service market estimates and forecast, 2018 - 2030 (USD Billion)
- Table 109. South Africa mold remediation service market revenue estimates and forecast, by surface type, 2018 - 2030 (USD Billion)
- Table 110. South Africa mold remediation service market revenue estimates and forecast, by mold type, 2018 - 2030 (USD Billion)
- Table 111. South Africa mold remediation service market revenue estimates and forecast, by application, 2018 - 2030 (USD Billion)
- Table 112. Recent developments & impact analysis, by key market participants
- Table 113. Company market share, 2023 (%)
- Table 114. Company heat map analysis, 2023
- Table 115. Companies implementing key strategies
List of Figures
- Figure 1. Mold remediation service market segmentation
- Figure 2. Information procurement
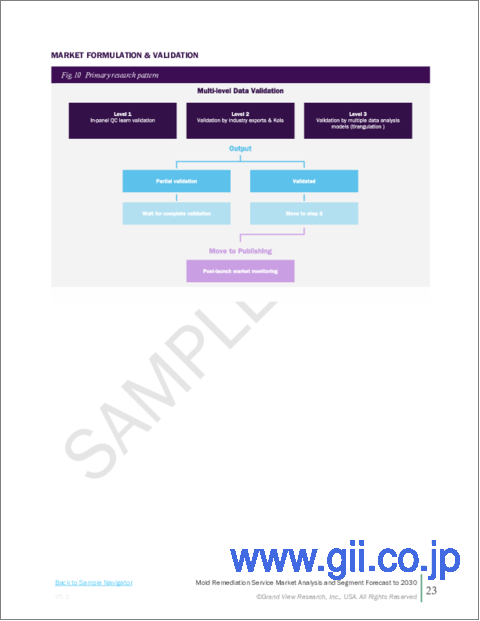
- Figure 3. Primary research pattern
- Figure 4. Primary research approaches
- Figure 5. Primary research process
- Figure 6. Market snapshot
- Figure 7. Segment snapshot
- Figure 8. Regional snapshot
- Figure 9. Competitive landscape Snapshot
- Figure 10. Global parent industry and mold remediation service market size (USD Billion)
- Figure 11. Global mold remediation service market size, 2018 to 2030 (USD Billion)
- Figure 12. Mold remediation service market: Penetration & growth prospect mapping
- Figure 13. Mold remediation service market: Value chain analysis
- Figure 14. Mold remediation service market: Profit-margin analysis
- Figure 15. Mold remediation service market: Dynamics
- Figure 16. Mold remediation service market: Porter's five forces analysis
- Figure 17. Factors influencing buying decisions for mold remediation service
- Figure 18. Mold remediation service market estimates & forecast, by surface type (USD Billion)
- Figure 19. Mold remediation service market estimates & forecast, for wood (USD Billion)
- Figure 20. Mold remediation service market estimates & forecast, for drywall (USD Billion)
- Figure 21. Mold remediation service market estimates & forecast, for tiles & grout (USD Billion)
- Figure 22. Mold remediation service market estimates & forecast, for carpet & upholstery (USD Billion)
- Figure 23. Mold remediation service market estimates & forecast, for other surface type (USD Billion)
- Figure 24. Mold remediation service market estimates & forecast, by mold type (USD Billion)
- Figure 25. Allergic mold remediation service market estimates & forecasts, 2018 - 2030 (USD Billion)
- Figure 26. Pathogenic mold remediation service market estimates & forecasts, 2018 - 2030 (USD Billion)
- Figure 27. Toxigenic mold remediation service market estimates & forecasts, 2018 - 2030 (USD Billion)
- Figure 28. Mold remediation service market estimates & forecast, by application (USD Billion)
- Figure 29. Mold remediation service market estimates & forecast, for residential (USD Billion)
- Figure 30. Mold remediation service market estimates & forecast, for commercial (USD Billion)
- Figure 31. Mold remediation service market: Regional outlook, 2023 & 2030, (USD Billion)
- Figure 32. Regional marketplace: Key takeaways
- Figure 33. North America mold remediation service market estimates & forecast, 2018 - 2030 (USD Billion)
- Figure 34. U.S. mold remediation service market estimates & forecast, 2018 - 2030 (USD Billion)
- Figure 35. Canada mold remediation service market estimates & forecast, 2018 - 2030 (USD Billion)
- Figure 36. Mexico mold remediation service market estimates & forecast, 2018 - 2030 (USD Billion)
- Figure 37. Europe mold remediation service market estimates & forecast, 2018 - 2030 (USD Billion)
- Figure 38. Germany mold remediation service market estimates & forecast, 2018 - 2030 (USD Billion)
- Figure 39. UK mold remediation service market estimates & forecast, 2018 - 2030 (USD Billion)
- Figure 40. France mold remediation service market estimates & forecast, 2018 - 2030 (USD Billion)
- Figure 41. Italy mold remediation service market estimates & forecast, 2018 - 2030 (USD Billion)
- Figure 42. Spain mold remediation service market estimates & forecast, 2018 - 2030 (USD Billion)
- Figure 43. Asia Pacific mold remediation service market estimates & forecast, 2018 - 2030 (USD Billion)
- Figure 44. China mold remediation service market estimates & forecast, 2018 - 2030 (USD Billion)
- Figure 45. India mold remediation service market estimates & forecast, 2018 - 2030 (USD Billion)
- Figure 46. Japan mold remediation service market estimates & forecast, 2018 - 2030 (USD Billion)
- Figure 47. Australia & New Zealand mold remediation service market estimates & forecast, 2018 - 2030 (USD Billion)
- Figure 48. South Korea mold remediation service market estimates & forecast, 2018 - 2030 (USD Billion)
- Figure 49. Central and South America mold remediation service market estimates & forecast, 2018 - 2030 (USD Billion)
- Figure 50. Brazil mold remediation service market estimates & forecast, 2018 - 2030 (USD Billion)
- Figure 51. Middle East & Africa mold remediation service market estimates & forecast, 2018 - 2030 (USD Billion)
- Figure 52. South Africa mold remediation service market estimates & forecast, 2018 - 2030 (USD Billion)
- Figure 53. Key company categorization
- Figure 54. Company market share analysis, 2023
- Figure 55. Strategic framework of mold remediation service market
Mold Remediation Service Market Growth & Trends:
The global mold remediation service market size is expected to reach USD 1.52 billion by 2030, according to a new report by Grand View Research, Inc. The market is projected to grow at a CAGR of 3.1% from 2024 to 2030. Increasing public awareness about health risks associated with mold exposure significantly drives market growth. As consumers become more educated about the potential health hazards of mold, including respiratory issues, allergic reactions, and more severe conditions in vulnerable populations, they are more likely to take swift action when mold is detected or suspected in the environment. This awareness leads to earlier detection and a higher likelihood of engaging in mold remediation services.
Technological advancements in mold detection and remediation techniques are significantly driving market growth by enhancing the efficiency, accuracy, and effectiveness of services. Detection tools, such as infrared cameras, moisture meters, and air sampling devices, allow professionals to identify mold growth in its early stages and in hard-to-reach areas, leading to more comprehensive assessments. Advanced remediation techniques, including HEPA air filtration systems, dry ice blasting, and enzymatic cleaning agents, offer more thorough and less invasive solutions, reducing property damage and downtime and likely favoring the growth of the market.
Stricter regulations, including tougher building codes and health standards regarding mold, significantly drive market growth by mandating routine inspections and swift responses to mold issues. These regulations compel property owners and businesses to adhere to high standards of indoor air quality and safety, necessitating professional mold remediation to comply with legal requirements. Non-compliance can result in substantial fines, legal liabilities, and reputational damage, prompting proactive measures to prevent mold growth. As a result, there is an increased demand for specialized mold remediation services to ensure properties meet these stringent standards, thereby expanding the market.
Aging infrastructure and the real estate market drive market growth by increasing the need for professional mold management. Older buildings, which are more prone to moisture problems and mold due to outdated construction materials and wear over time, require frequent remediation to maintain safety and functionality. Similarly, the real estate market's demand for mold-free properties in sales and rentals emphasizes the importance of mold remediation to enhance property value and appeal. Buyers and renters prioritize healthy living environments, compelling property owners to invest in mold remediation services to ensure their properties are marketable and comply with health standards, thereby fueling the industry's growth.
Mold Remediation Service Market Report Highlights:
- Mold remediation services for drywall surfaces type accounted for a substantial market share in 2023. Drywall's porous nature easily absorbs moisture and supports mold growth. The health risks associated with mold exposure and the potential structural damage to buildings further drive the demand for professional remediation to ensure thorough and effective mold removal from drywall.
- The demand for mold remediation service for pathogenic mold type is expected to grow at a significant growth over the forecast period. The growth of mold remediation services for pathogenic mold types is driven by increasing awareness of the severe health risks these molds pose, including respiratory issues, infections, and allergic reactions. Enhanced diagnostic technologies and stricter regulatory standards have also fueled the demand for specialized remediation services to effectively identify and eradicate pathogenic molds in residential, commercial, and healthcare settings.
- The demand for mold remediation services for commercial applications is expected to witness significant growth over the forecast period. This growth is fueled by increasing awareness of the health risks associated with mold exposure and the stringent regulatory requirements for maintaining safe indoor environments.
- North America accounted for a substantial market share of the global revenue in 2023. The market in North America is driven by the region's stringent building codes and health regulations, which mandate regular inspections and prompt remediation of mold issues. In addition, the increasing frequency of natural disasters, such as hurricanes and floods, exacerbates mold problems, further boosting the demand for professional remediation services.
Table of Contents
Chapter 1. Methodology and Scope
- 1.1. Market Segmentation & Scope
- 1.2. Market Definition
- 1.3. Information Procurement
- 1.3.1. Purchased Database
- 1.3.2. GVR's Internal Database
- 1.3.3. Secondary Sources & Third-Party Perspectives
- 1.3.4. Primary Research
- 1.4. Information Analysis
- 1.4.1. Data Analysis Models
- 1.5. Market Formulation & Data Visualization
- 1.6. Data Validation & Publishing
Chapter 2. Executive Summary
- 2.1. Market Snapshot
- 2.2. Segment Snapshot
- 2.3. Competitive Landscape Snapshot
Chapter 3. Mold Remediation Service Variables, Trends & Scope
- 3.1. Market Lineage Outlook
- 3.2. Penetration and Growth Prospect Mapping
- 3.3. Industry Value Chain Analysis
- 3.4. Market Dynamics
- 3.4.1. Market Driver Analysis
- 3.4.2. Market Restraint Analysis
- 3.4.3. Market Opportunities
- 3.4.4. Market Challenges
- 3.5. Industry Analysis Tools
- 3.5.1. Porter's Five Forces Analysis
- 3.6. Market Entry Strategies
Chapter 4. Mold Remediation Service Market: Consumer Behavior Analysis
- 4.1. Demographic Analysis
- 4.2. Consumer Trends & Preferences
- 4.3. Factors Affecting Buying Decisions
- 4.4. Consumer Product Adoption
- 4.5. Observations & Recommendations
Chapter 5. Mold Remediation Service Market: Surface Type Estimates & Trend Analysis
- 5.1. Mold Remediation Service Market, By Surface Type: Key Takeaways
- 5.2. Surface Type Movement Analysis & Market Share, 2023 & 2030
- 5.3. Market Estimates & Forecasts, By Surface Type, 2018 - 2030 (USD Billion)
- 5.3.1. Wood
- 5.3.1.1. Market estimates and forecast, 2018 - 2030, (USD Billion)
- 5.3.2. Drywall
- 5.3.2.1. Market estimates and forecast, 2018 - 2030, (USD Billion)
- 5.3.3. Tiles & Grout
- 5.3.3.1. Market estimates and forecast, 2018 - 2030, (USD Billion)
- 5.3.4. Carpet & Upholstery
- 5.3.4.1. Market estimates and forecast, 2018 - 2030, (USD Billion)
- 5.3.5. Others
- 5.3.5.1. Market estimates and forecast, 2018 - 2030, (USD Billion)
- 5.3.1. Wood
Chapter 6. Mold Remediation Service Market: Mold Type Estimates & Trend Analysis
- 6.1. Mold Remediation Service Market, By Mold Type: Key Takeaways
- 6.2. Mold Type Movement Analysis & Market Share, 2023 & 2030
- 6.3. Market Estimates & Forecasts, by Mold Type, 2018 - 2030 (USD Billion)
- 6.3.1. Allergic
- 6.3.1.1. Market estimates and forecast, 2018 - 2030, (USD Billion)
- 6.3.2. Pathogenic
- 6.3.2.1. Market estimates and forecast, 2018 - 2030, (USD Billion)
- 6.3.3. Toxigenic
- 6.3.3.1. Market estimates and forecast, 2018 - 2030, (USD Billion)
- 6.3.1. Allergic
Chapter 7. Mold Remediation Service Market: Application Estimates & Trend Analysis
- 7.1. Mold Remediation Service Market, By Application: Key Takeaways
- 7.2. Application Movement Analysis & Market Share, 2023 & 2030
- 7.3. Market Estimates & Forecasts, by Application, 2018 - 2030 (USD Billion)
- 7.3.1. Residential
- 7.3.1.1. Market estimates and forecast, 2018 - 2030, (USD Billion)
- 7.3.2. Commercial
- 7.3.2.1. Market estimates and forecast, 2018 - 2030, (USD Billion)
- 7.3.1. Residential
Chapter 8. Mold Remediation Service Market: Regional Estimates & Trend Analysis
- 8.1. Retinol Beauty Products Market: Regional Outlook
- 8.2. Regional Marketplaces: Key Takeaways
- 8.3. Market Estimates & Forecasts, by Region, 2018 - 2030 (USD Billion)
- 8.3.1. North America
- 8.3.1.1. Market estimates and forecast, 2018 - 2030, (USD Billion)
- 8.3.1.2. U.S.
- 8.3.1.2.1. Key country dynamics
- 8.3.1.2.2. Market estimates and forecast, 2018 - 2030, (USD Billion)
- 8.3.1.3. Canada
- 8.3.1.3.1. Key country dynamics
- 8.3.1.3.2. Market estimates and forecast, 2018 - 2030, (USD Billion)
- 8.3.1.4. Mexico
- 8.3.1.4.1. Key country dynamics
- 8.3.1.4.2. Market estimates and forecast, 2018 - 2030, (USD Billion)
- 8.3.2. Europe
- 8.3.2.1. Market estimates and forecast, 2018 - 2030, (USD Billion)
- 8.3.2.2. UK
- 8.3.2.2.1. Key country dynamics
- 8.3.2.2.2. Market estimates and forecast, 2018 - 2030, (USD Billion)
- 8.3.2.3. Germany
- 8.3.2.3.1. Key country dynamics
- 8.3.2.3.2. Market estimates and forecast, 2018 - 2030, (USD Billion)
- 8.3.2.4. France
- 8.3.2.4.1. Key country dynamics
- 8.3.2.4.2. Market estimates and forecast, 2018 - 2030, (USD Billion)
- 8.3.2.5. Italy
- 8.3.2.5.1. Key country dynamics
- 8.3.2.5.2. Market estimates and forecast, 2018 - 2030, (USD Billion)
- 8.3.2.6. Spain
- 8.3.2.6.1. Key country dynamics
- 8.3.2.6.2. Market estimates and forecast, 2018 - 2030, (USD Billion)
- 8.3.3. Asia Pacific
- 8.3.3.1. Market estimates and forecast, 2018 - 2030, (USD Billion)
- 8.3.3.2. China
- 8.3.3.2.1. Key country dynamics
- 8.3.3.2.2. Market estimates and forecast, 2018 - 2030, (USD Billion)
- 8.3.3.3. India
- 8.3.3.3.1. Key country dynamics
- 8.3.3.3.2. Market estimates and forecast, 2018 - 2030, (USD Billion)
- 8.3.3.4. Japan
- 8.3.3.4.1. Key country dynamics
- 8.3.3.4.2. Market estimates and forecast, 2018 - 2030, (USD Billion)
- 8.3.3.5. Australia & New Zealand
- 8.3.3.5.1. Key country dynamics
- 8.3.3.5.2. Market estimates and forecast, 2018 - 2030, (USD Billion)
- 8.3.3.6. South Korea
- 8.3.3.6.1. Key country dynamics
- 8.3.3.6.2. Market estimates and forecast, 2018 - 2030, (USD Billion)
- 8.3.4. Central & South America
- 8.3.4.1. Market estimates and forecast, 2018 - 2030, (USD Billion)
- 8.3.4.2. Brazil
- 8.3.4.2.1. Key country dynamics
- 8.3.4.2.2. Market estimates and forecast, 2018 - 2030, (USD Billion)
- 8.3.5. Middle East & Africa
- 8.3.5.1. Market estimates and forecast, 2018 - 2030, (USD Billion)
- 8.3.5.2. South Africa
- 8.3.5.2.1. Key country dynamics
- 8.3.5.2.2. Market estimates and forecast, 2018 - 2030, (USD Billion)
- 8.3.1. North America
Chapter 9. Mold Remediation Service Market: Competitive Analysis
- 9.1. Recent developments & impact analysis, by key market participants
- 9.2. Company Categorization
- 9.3. Participant's Overview
- 9.4. Financial Performance
- 9.5. Product Benchmarking
- 9.6. Company Market Share Analysis, 2023 (%)
- 9.7. Company Heat Map Analysis
- 9.8. Strategy Mapping
- 9.9. Company Profiles
- 9.9.1. 911 Restoration
- 9.9.1.1. Company Overview
- 9.9.1.2. Financial Performance
- 9.9.1.3. Product Portfolios
- 9.9.1.4. Strategic Initiatives
- 9.9.2. AdvantaClean
- 9.9.2.1. Company Overview
- 9.9.2.2. Financial Performance
- 9.9.2.3. Product Portfolios
- 9.9.2.4. Strategic Initiatives
- 9.9.3. AllClean USA
- 9.9.3.1. Company Overview
- 9.9.3.2. Financial Performance
- 9.9.3.3. Product Portfolios
- 9.9.3.4. Strategic Initiatives
- 9.9.4. ASAP Restoration, LLC
- 9.9.4.1. Company Overview
- 9.9.4.2. Financial Performance
- 9.9.4.3. Product Portfolios
- 9.9.4.4. Strategic Initiatives
- 9.9.5. SERVPRO
- 9.9.5.1. Company Overview
- 9.9.5.2. Financial Performance
- 9.9.5.3. Product Portfolios
- 9.9.5.4. Strategic Initiatives
- 9.9.6. ServiceMaster Restore
- 9.9.6.1. Company Overview
- 9.9.6.2. Financial Performance
- 9.9.6.3. Product Portfolios
- 9.9.6.4. Strategic Initiatives
- 9.9.7. Neighborly Company
- 9.9.7.1. Company Overview
- 9.9.7.2. Financial Performance
- 9.9.7.3. Product Portfolios
- 9.9.7.4. Strategic Initiatives
- 9.9.8. Bust Mold Inc.
- 9.9.8.1. Company Overview
- 9.9.8.2. Financial Performance
- 9.9.8.3. Product Portfolios
- 9.9.8.4. Strategic Initiatives
- 9.9.9. PuroClean
- 9.9.9.1. Company Overview
- 9.9.9.2. Financial Performance
- 9.9.9.3. Product Portfolios
- 9.9.9.4. Strategic Initiatives
- 9.9.10. BELFOR
- 9.9.10.1. Company Overview
- 9.9.10.2. Financial Performance
- 9.9.10.3. Product Portfolios
- 9.9.10.4. Strategic Initiatives
- 9.9.1. 911 Restoration
