|
|
市場調査レポート
商品コード
1911019
世界のデュシェンヌ型筋ジストロフィー(DMD)治療薬市場2026-2030年Global Duchenne Muscular Dystrophy (DMD) Therapeutics Market 2026-2030 |
||||||
|
|||||||
カスタマイズ可能
|
|||||||

| 世界のデュシェンヌ型筋ジストロフィー(DMD)治療薬市場2026-2030年 |
|
出版日: 2026年01月14日
発行: TechNavio
ページ情報: 英文 277 Pages
納期: 即納可能
|

概要
世界のデュシェンヌ型筋ジストロフィー(DMD)治療薬市場は、2025年から2030年の間に70億3,010万米ドル規模に成長し、予測期間中のCAGRは29.4%と予測されております。
本報告書は、世界のデュシェンヌ型筋ジストロフィー(DMD)治療薬市場に関する包括的な分析を提供し、市場規模と予測、動向、成長要因、課題、ならびに約25社のベンダー分析を網羅しております。
本レポートは、現在の市場状況、最新の動向と促進要因、市場環境全般に関する最新の分析を提供します。市場は、遺伝子治療の商業化と適応拡大、新規非ステロイド系薬剤およびヒストン脱アセチル化酵素阻害剤の承認、戦略的な世界の提携、規制面での進展によって牽引されています。
本調査は、業界の主要関係者からの情報を含む、一次情報と二次情報の客観的な組み合わせを用いて実施されました。本レポートには、主要企業の分析に加え、包括的な市場規模データ、地域別分析を伴うセグメント、ベンダー情勢が含まれています。レポートには過去データと予測データが掲載されています。
| 市場範囲 | |
|---|---|
| 基準年 | 2026年 |
| 終了年 | 2030年 |
| 予測期間 | 2026-2030 |
| 成長モメンタム | 加速 |
| 前年比2026年 | 25.6% |
| CAGR | 29.4% |
| 増分額 | 70億3,010万米ドル |
本調査では、離脱性ステロイド療法の拡大が、今後数年間における世界のデュシェンヌ型筋ジストロフィー(DMD)治療薬市場の成長を牽引する主要な要因の一つであると特定しております。また、ペプチド結合オリゴヌクレオチド送達システムの進歩、規制動向、ならびに革新的治療法の採用が、市場における相当な需要につながると見込まれます。
目次
第1章 エグゼクティブサマリー
- 市場概要
第2章 Technavio分析
- 価格・ライフサイクル・顧客購入バスケット・採用率・購入基準の分析
- インプットの重要性と差別化の要因
- 混乱の要因
- 促進要因と課題の影響
第3章 市場情勢
- 市場エコシステム
- 市場の特徴
- バリューチェーン分析
第4章 市場規模
- 市場の定義
- 市場セグメント分析
- 市場規模 2025
- 市場の見通し 2025-2030
第5章 市場規模実績
- 世界のデュシェンヌ型筋ジストロフィー(DMD)治療薬市場 2020-2024
- タイプセグメント分析 2020-2024
- 流通チャネルセグメント分析 2020-2024
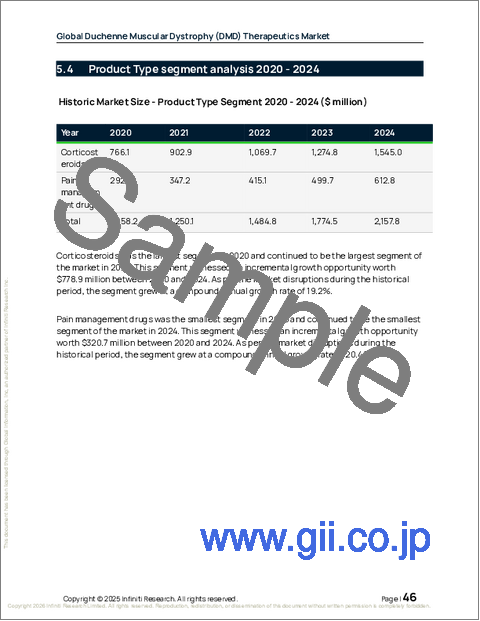
- 製品タイプセグメント分析 2020-2024
- 地域別セグメント分析 2020-2024
- 国別セグメント分析 2020-2024
第6章 定性分析
- AIがもたらす影響世界のデュシェンヌ型筋ジストロフィー(DMD)治療薬市場
第7章 ファイブフォース分析
- ファイブフォースの要約
- 買い手の交渉力
- 供給企業の交渉力
- 新規参入業者の脅威
- 代替品の脅威
- 競争の脅威
- 市況
第8章 市場セグメンテーション:タイプ別
- 市場セグメント
- 比較:タイプ別
- バイオ医薬品:市場規模と予測 2025-2030
- 低分子医薬品:市場規模と予測 2025-2030
- 市場機会:タイプ別
第9章 市場セグメンテーション:流通チャネル別
- 市場セグメント
- 比較:流通チャネル別
- オフライン:市場規模と予測 2025-2030
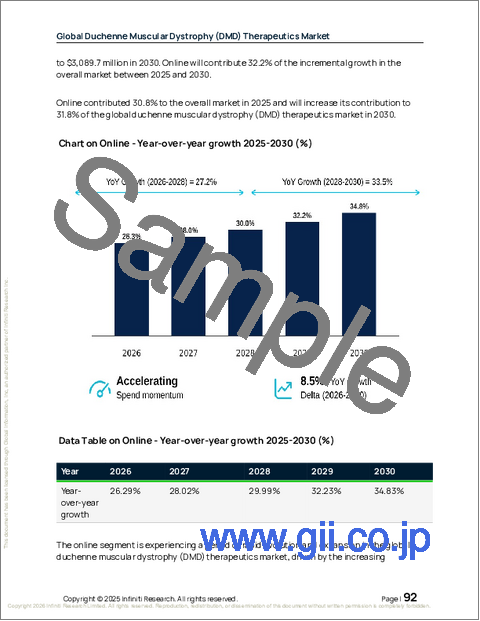
- オンライン:市場規模と予測 2025-2030
- 市場機会:流通チャネル別
第10章 市場セグメンテーション:製品タイプ別
- 市場セグメント
- 比較:製品タイプ別
- コルチコステロイド:市場規模と予測 2025-2030
- 疼痛管理薬:市場規模と予測 2025-2030
- 市場機会:製品タイプ別
第11章 顧客情勢
- 顧客情勢の概要
第12章 地域別情勢
- 地域別セグメンテーション
- 地域別比較
- 北米:市場規模と予測 2025-2030
- 欧州:市場規模と予測 2025-2030
- アジア:市場規模と予測 2025-2030
- 世界のその他の地域:市場規模と予測 2025-2030
- 市場機会:地域別
第13章 促進要因、課題、および機会
- 市場促進要因
- 市場の課題
- 促進要因と課題の影響
- 市場機会
第14章 競合情勢
- 概要
- 競合情勢
- 混乱の状況
- 業界のリスク
第15章 競合分析
- 企業プロファイル
- 企業ランキング指数
- 企業の市場ポジショニング
- Akashi Therapeutics, Inc.
- Avidity Biosciences, Inc.
- BioMarin Pharmaceutical Inc.
- Capricor Therapeutics Inc.
- F. Hoffmann La Roche Ltd.
- FibroGen Inc.
- Italfarmaco Holding SPA
- MeiraGTx Holdings Plc.
- NS Pharma, Inc.
- Precision BioSciences, Inc.
- PTC Therapeutics Inc.
- ReveraGen BioPharma, Inc.
- Sarepta Therapeutics Inc.
- Ultragenyx Pharmaceutical Inc
- Wave Life Sciences Ltd.

