|
|
市場調査レポート
商品コード
1558575
自動車保険の世界市場、2024年~2028年Global Motor Vehicle Insurance Market 2024-2028 |
||||||

|
|||||||
カスタマイズ可能
|
|||||||


| 自動車保険の世界市場、2024年~2028年 |
|
出版日: 2024年08月15日
発行: TechNavio
ページ情報: 英文 168 Pages
納期: 即納可能
|

全表示
- 概要
- 図表
- 目次
自動車保険市場は2023-2028年に5,459億米ドル、予測期間中のCAGRは10.44%で成長すると予測されます。
当レポートでは、自動車保険市場の全体的な分析、市場規模・予測、動向、成長促進要因、課題、約25のベンダーを網羅したベンダー分析などを掲載しています。
現在の市場シナリオ、最新動向と促進要因、市場環境全体に関する最新分析を提供しています。新興国市場における保険加入義務に関する政府規制の強化、自動車販売台数の急増、事故件数の増加などが市場を牽引しています。
| 市場範囲 | |
|---|---|
| 基準年 | 2024 |
| 終了年 | 2028 |
| 予測期間 | 2024-2028 |
| 成長モメンタム | 加速 |
| 前年比2024年 | 8.64% |
| CAGR | 10.44% |
| 増分額 | 5,459億米ドル |
本調査では、自動車保険業界のデジタル化が、今後数年間の自動車保険市場成長を牽引する主要因の1つであるとしています。また、自動車保険における利用ベースの保険や保険テレマティクスの増加、第三者賠償責任カバーの出現は、市場の大きな需要につながります。
目次
第1章 エグゼクティブサマリー
- 市場概要
第2章 市場情勢
- 市場エコシステム
- 市場の特徴
- バリューチェーン分析
第3章 市場規模の評価
- 市場の定義
- 市場セグメント分析
- 市場規模 2023
- 市場の見通し 2023-2028
第4章 市場規模実績
- 自動車保険の世界市場 2018-2022
- 用途別セグメント分析 2018-2022
- 流通チャネルセグメント分析 2018-2022
- 地域別セグメント分析 2018-2022
- 国別セグメント分析 2018-2022
第5章 ファイブフォース分析
- ファイブフォースの要約
- 買い手の交渉力
- 供給企業の交渉力
- 新規参入業者の脅威
- 代替品の脅威
- 競争の脅威
- 市況
第6章 市場セグメンテーション:用途別
- 市場セグメンテーション
- 比較:用途別
- 個人:市場規模と予測 2023-2028
- 商業:市場規模と予測 2023-2028
- 市場機会:用途別
第7章 市場セグメンテーション:流通チャネル別
- 市場セグメンテーション
- 比較:流通チャネル別
- ブローカー:市場規模と予測 2023-2028
- 直接:市場規模と予測 2023-2028
- 銀行:市場規模と予測 2023-2028
- その他:市場規模と予測 2023-2028
- 市場機会:流通チャネル別
第8章 顧客情勢
- 顧客情勢の概要
第9章 地域別情勢
- 地域別セグメンテーション
- 地域別比較
- 北米:市場規模と予測 2023-2028
- アジア太平洋:市場規模と予測 2023-2028
- 欧州:市場規模と予測 2023-2028
- 南米:市場規模と予測 2023-2028
- 中東・アフリカ:市場規模と予測 2023-2028
- 米国:市場規模と予測 2023-2028
- 中国:市場規模と予測 2023-2028
- 日本:市場規模と予測 2023-2028
- 英国:市場規模と予測 2023-2028
- フランス:市場規模と予測 2023-2028
- 市場機会:地域情勢別
第10章 促進要因・課題・機会・抑制要因
- 市場促進要因
- 市場の課題
- 促進要因と課題の影響
- 市場の機会・抑制要因
第11章 競合情勢
- 概要
- 競合情勢
- 混乱の状況
- 業界のリスク
第12章 競合分析
- 企業プロファイル
- 企業の市場ポジショニング
- Allianz SE
- American International Group Inc.
- AXA Group
- Berkshire Hathaway Inc.
- Chubb Ltd.
- Desjardins Group
- Discovery Ltd.
- Kotak Mahindra Bank Ltd.
- Liberty Mutual Holding Co. Inc.
- Navi Technologies Ltd
- Reliance Capital Ltd.
- State Farm Mutual Automobile Insurance Co.
- The Allstate Corp.
- The Progressive Corp.
- Zurich Insurance Co. Ltd.
第13章 付録
Exhibits:
- Exhibits1: Executive Summary - Chart on Market Overview
- Exhibits2: Executive Summary - Data Table on Market Overview
- Exhibits3: Executive Summary - Chart on Global Market Characteristics
- Exhibits4: Executive Summary - Chart on Market By Geographical Landscape
- Exhibits5: Executive Summary - Chart on Market Segmentation by Application
- Exhibits6: Executive Summary - Chart on Market Segmentation by Distribution Channel
- Exhibits7: Executive Summary - Chart on Incremental Growth
- Exhibits8: Executive Summary - Data Table on Incremental Growth
- Exhibits9: Executive Summary - Chart on Company Market Positioning
- Exhibits10: Parent Market
- Exhibits11: Data Table on - Parent Market
- Exhibits12: Market characteristics analysis
- Exhibits13: Value Chain Analysis
- Exhibits14: Offerings of companies included in the market definition
- Exhibits15: Market segments
- Exhibits16: Chart on Global - Market size and forecast 2023-2028 ($ billion)
- Exhibits17: Data Table on Global - Market size and forecast 2023-2028 ($ billion)
- Exhibits18: Chart on Global Market: Year-over-year growth 2023-2028 (%)
- Exhibits19: Data Table on Global Market: Year-over-year growth 2023-2028 (%)
- Exhibits20: Historic Market Size - Data Table on Global Motor Vehicle Insurance Market 2018 - 2022 ($ billion)
- Exhibits21: Historic Market Size - Application Segment 2018 - 2022 ($ billion)
- Exhibits22: Historic Market Size - Distribution Channel Segment 2018 - 2022 ($ billion)
- Exhibits23: Historic Market Size - Geography Segment 2018 - 2022 ($ billion)
- Exhibits24: Historic Market Size - Country Segment 2018 - 2022 ($ billion)
- Exhibits25: Five forces analysis - Comparison between 2023 and 2028
- Exhibits26: Bargaining power of buyers - Impact of key factors 2023 and 2028
- Exhibits27: Bargaining power of suppliers - Impact of key factors in 2023 and 2028
- Exhibits28: Threat of new entrants - Impact of key factors in 2023 and 2028
- Exhibits29: Threat of substitutes - Impact of key factors in 2023 and 2028
- Exhibits30: Threat of rivalry - Impact of key factors in 2023 and 2028
- Exhibits31: Chart on Market condition - Five forces 2023 and 2028
- Exhibits32: Chart on Application - Market share 2023-2028 (%)
- Exhibits33: Data Table on Application - Market share 2023-2028 (%)
- Exhibits34: Chart on Comparison by Application
- Exhibits35: Data Table on Comparison by Application
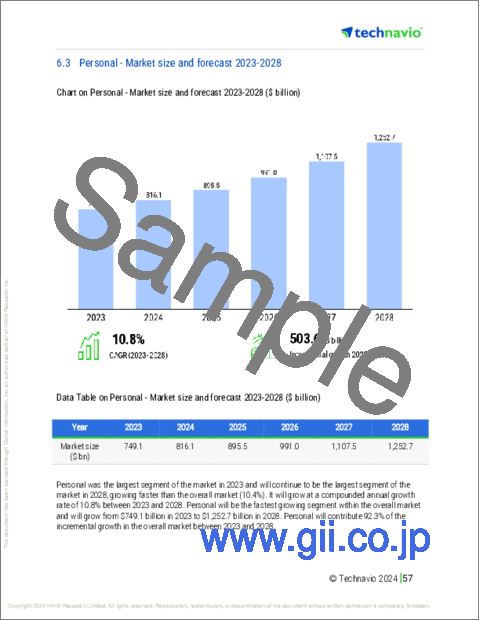
- Exhibits36: Chart on Personal - Market size and forecast 2023-2028 ($ billion)
- Exhibits37: Data Table on Personal - Market size and forecast 2023-2028 ($ billion)
- Exhibits38: Chart on Personal - Year-over-year growth 2023-2028 (%)
- Exhibits39: Data Table on Personal - Year-over-year growth 2023-2028 (%)
- Exhibits40: Chart on Commercial - Market size and forecast 2023-2028 ($ billion)
- Exhibits41: Data Table on Commercial - Market size and forecast 2023-2028 ($ billion)
- Exhibits42: Chart on Commercial - Year-over-year growth 2023-2028 (%)
- Exhibits43: Data Table on Commercial - Year-over-year growth 2023-2028 (%)
- Exhibits44: Market opportunity by Application ($ billion)
- Exhibits45: Data Table on Market opportunity by Application ($ billion)
- Exhibits46: Chart on Distribution Channel - Market share 2023-2028 (%)
- Exhibits47: Data Table on Distribution Channel - Market share 2023-2028 (%)
- Exhibits48: Chart on Comparison by Distribution Channel
- Exhibits49: Data Table on Comparison by Distribution Channel
- Exhibits50: Chart on Brokers - Market size and forecast 2023-2028 ($ billion)
- Exhibits51: Data Table on Brokers - Market size and forecast 2023-2028 ($ billion)
- Exhibits52: Chart on Brokers - Year-over-year growth 2023-2028 (%)
- Exhibits53: Data Table on Brokers - Year-over-year growth 2023-2028 (%)
- Exhibits54: Chart on Direct - Market size and forecast 2023-2028 ($ billion)
- Exhibits55: Data Table on Direct - Market size and forecast 2023-2028 ($ billion)
- Exhibits56: Chart on Direct - Year-over-year growth 2023-2028 (%)
- Exhibits57: Data Table on Direct - Year-over-year growth 2023-2028 (%)
- Exhibits58: Chart on Banks - Market size and forecast 2023-2028 ($ billion)
- Exhibits59: Data Table on Banks - Market size and forecast 2023-2028 ($ billion)
- Exhibits60: Chart on Banks - Year-over-year growth 2023-2028 (%)
- Exhibits61: Data Table on Banks - Year-over-year growth 2023-2028 (%)
- Exhibits62: Chart on Others - Market size and forecast 2023-2028 ($ billion)
- Exhibits63: Data Table on Others - Market size and forecast 2023-2028 ($ billion)
- Exhibits64: Chart on Others - Year-over-year growth 2023-2028 (%)
- Exhibits65: Data Table on Others - Year-over-year growth 2023-2028 (%)
- Exhibits66: Market opportunity by Distribution Channel ($ billion)
- Exhibits67: Data Table on Market opportunity by Distribution Channel ($ billion)
- Exhibits68: Analysis of price sensitivity, lifecycle, customer purchase basket, adoption rates, and purchase criteria
- Exhibits69: Chart on Market share By Geographical Landscape 2023-2028 (%)
- Exhibits70: Data Table on Market share By Geographical Landscape 2023-2028 (%)
- Exhibits71: Chart on Geographic comparison
- Exhibits72: Data Table on Geographic comparison
- Exhibits73: Chart on North America - Market size and forecast 2023-2028 ($ billion)
- Exhibits74: Data Table on North America - Market size and forecast 2023-2028 ($ billion)
- Exhibits75: Chart on North America - Year-over-year growth 2023-2028 (%)
- Exhibits76: Data Table on North America - Year-over-year growth 2023-2028 (%)
- Exhibits77: Chart on APAC - Market size and forecast 2023-2028 ($ billion)
- Exhibits78: Data Table on APAC - Market size and forecast 2023-2028 ($ billion)
- Exhibits79: Chart on APAC - Year-over-year growth 2023-2028 (%)
- Exhibits80: Data Table on APAC - Year-over-year growth 2023-2028 (%)
- Exhibits81: Chart on Europe - Market size and forecast 2023-2028 ($ billion)
- Exhibits82: Data Table on Europe - Market size and forecast 2023-2028 ($ billion)
- Exhibits83: Chart on Europe - Year-over-year growth 2023-2028 (%)
- Exhibits84: Data Table on Europe - Year-over-year growth 2023-2028 (%)
- Exhibits85: Chart on South America - Market size and forecast 2023-2028 ($ billion)
- Exhibits86: Data Table on South America - Market size and forecast 2023-2028 ($ billion)
- Exhibits87: Chart on South America - Year-over-year growth 2023-2028 (%)
- Exhibits88: Data Table on South America - Year-over-year growth 2023-2028 (%)
- Exhibits89: Chart on Middle East and Africa - Market size and forecast 2023-2028 ($ billion)
- Exhibits90: Data Table on Middle East and Africa - Market size and forecast 2023-2028 ($ billion)
- Exhibits91: Chart on Middle East and Africa - Year-over-year growth 2023-2028 (%)
- Exhibits92: Data Table on Middle East and Africa - Year-over-year growth 2023-2028 (%)
- Exhibits93: Chart on US - Market size and forecast 2023-2028 ($ billion)
- Exhibits94: Data Table on US - Market size and forecast 2023-2028 ($ billion)
- Exhibits95: Chart on US - Year-over-year growth 2023-2028 (%)
- Exhibits96: Data Table on US - Year-over-year growth 2023-2028 (%)
- Exhibits97: Chart on China - Market size and forecast 2023-2028 ($ billion)
- Exhibits98: Data Table on China - Market size and forecast 2023-2028 ($ billion)
- Exhibits99: Chart on China - Year-over-year growth 2023-2028 (%)
- Exhibits100: Data Table on China - Year-over-year growth 2023-2028 (%)
- Exhibits101: Chart on Japan - Market size and forecast 2023-2028 ($ billion)
- Exhibits102: Data Table on Japan - Market size and forecast 2023-2028 ($ billion)
- Exhibits103: Chart on Japan - Year-over-year growth 2023-2028 (%)
- Exhibits104: Data Table on Japan - Year-over-year growth 2023-2028 (%)
- Exhibits105: Chart on UK - Market size and forecast 2023-2028 ($ billion)
- Exhibits106: Data Table on UK - Market size and forecast 2023-2028 ($ billion)
- Exhibits107: Chart on UK - Year-over-year growth 2023-2028 (%)
- Exhibits108: Data Table on UK - Year-over-year growth 2023-2028 (%)
- Exhibits109: Chart on France - Market size and forecast 2023-2028 ($ billion)
- Exhibits110: Data Table on France - Market size and forecast 2023-2028 ($ billion)
- Exhibits111: Chart on France - Year-over-year growth 2023-2028 (%)
- Exhibits112: Data Table on France - Year-over-year growth 2023-2028 (%)
- Exhibits113: Market opportunity By Geographical Landscape ($ billion)
- Exhibits114: Data Tables on Market opportunity By Geographical Landscape ($ billion)
- Exhibits115: Impact of drivers and challenges in 2023 and 2028
- Exhibits116: Overview on criticality of inputs and factors of differentiation
- Exhibits117: Overview on factors of disruption
- Exhibits118: Impact of key risks on business
- Exhibits119: Companies covered
- Exhibits120: Matrix on companies position and classification
- Exhibits121: Allianz SE - Overview
- Exhibits122: Allianz SE - Business segments
- Exhibits123: Allianz SE - Key news
- Exhibits124: Allianz SE - Key offerings
- Exhibits125: Allianz SE - Segment focus
- Exhibits126: American International Group Inc. - Overview
- Exhibits127: American International Group Inc. - Business segments
- Exhibits128: American International Group Inc. - Key news
- Exhibits129: American International Group Inc. - Key offerings
- Exhibits130: American International Group Inc. - Segment focus
- Exhibits131: AXA Group - Overview
- Exhibits132: AXA Group - Business segments
- Exhibits133: AXA Group - Key news
- Exhibits134: AXA Group - Key offerings
- Exhibits135: AXA Group - Segment focus
- Exhibits136: Berkshire Hathaway Inc. - Overview
- Exhibits137: Berkshire Hathaway Inc. - Business segments
- Exhibits138: Berkshire Hathaway Inc. - Key news
- Exhibits139: Berkshire Hathaway Inc. - Key offerings
- Exhibits140: Berkshire Hathaway Inc. - Segment focus
- Exhibits141: Chubb Ltd. - Overview
- Exhibits142: Chubb Ltd. - Business segments
- Exhibits143: Chubb Ltd. - Key news
- Exhibits144: Chubb Ltd. - Key offerings
- Exhibits145: Chubb Ltd. - Segment focus
- Exhibits146: Desjardins Group - Overview
- Exhibits147: Desjardins Group - Business segments
- Exhibits148: Desjardins Group - Key offerings
- Exhibits149: Desjardins Group - Segment focus
- Exhibits150: Discovery Ltd. - Overview
- Exhibits151: Discovery Ltd. - Business segments
- Exhibits152: Discovery Ltd. - Key offerings
- Exhibits153: Discovery Ltd. - Segment focus
- Exhibits154: Kotak Mahindra Bank Ltd. - Overview
- Exhibits155: Kotak Mahindra Bank Ltd. - Business segments
- Exhibits156: Kotak Mahindra Bank Ltd. - Key offerings
- Exhibits157: Kotak Mahindra Bank Ltd. - Segment focus
- Exhibits158: Liberty Mutual Holding Co. Inc. - Overview
- Exhibits159: Liberty Mutual Holding Co. Inc. - Product / Service
- Exhibits160: Liberty Mutual Holding Co. Inc. - Key offerings
- Exhibits161: Navi Technologies Ltd - Overview
- Exhibits162: Navi Technologies Ltd - Product / Service
- Exhibits163: Navi Technologies Ltd - Key offerings
- Exhibits164: Reliance Capital Ltd. - Overview
- Exhibits165: Reliance Capital Ltd. - Product / Service
- Exhibits166: Reliance Capital Ltd. - Key offerings
- Exhibits167: State Farm Mutual Automobile Insurance Co. - Overview
- Exhibits168: State Farm Mutual Automobile Insurance Co. - Product / Service
- Exhibits169: State Farm Mutual Automobile Insurance Co. - Key offerings
- Exhibits170: The Allstate Corp. - Overview
- Exhibits171: The Allstate Corp. - Business segments
- Exhibits172: The Allstate Corp. - Key offerings
- Exhibits173: The Allstate Corp. - Segment focus
- Exhibits174: The Progressive Corp. - Overview
- Exhibits175: The Progressive Corp. - Product / Service
- Exhibits176: The Progressive Corp. - Key offerings
- Exhibits177: Zurich Insurance Co. Ltd. - Overview
- Exhibits178: Zurich Insurance Co. Ltd. - Business segments
- Exhibits179: Zurich Insurance Co. Ltd. - Key offerings
- Exhibits180: Zurich Insurance Co. Ltd. - Segment focus
- Exhibits181: Inclusions checklist
- Exhibits182: Exclusions checklist
- Exhibits183: Currency conversion rates for US$
- Exhibits184: Research methodology
- Exhibits185: Information sources
- Exhibits186: Data validation
- Exhibits187: Validation techniques employed for market sizing
- Exhibits188: Data synthesis
- Exhibits189: 360 degree market analysis
- Exhibits190: List of abbreviations
The motor vehicle insurance market is forecasted to grow by USD 545.9 bn during 2023-2028, accelerating at a CAGR of 10.44% during the forecast period. The report on the motor vehicle insurance market provides a holistic analysis, market size and forecast, trends, growth drivers, and challenges, as well as vendor analysis covering around 25 vendors.
The report offers an up-to-date analysis regarding the current market scenario, the latest trends and drivers, and the overall market environment. The market is driven by increasing government regulations on mandatory insurance coverage in developing countries, surge in automobile sales, and rising number of accidents.
Technavio's motor vehicle insurance market is segmented as below:
| Market Scope | |
|---|---|
| Base Year | 2024 |
| End Year | 2028 |
| Series Year | 2024-2028 |
| Growth Momentum | Accelerate |
| YOY 2024 | 8.64% |
| CAGR | 10.44% |
| Incremental Value | $545.9 bn |
By Application
- Personal
- Commercial
By Distribution Channel
- Brokers
- Direct
- Banks
- Others
By Geographical Landscape
- North America
- APAC
- Europe
- South America
- Middle East and Africa
This study identifies the digitalization of motor vehicle insurance industry as one of the prime reasons driving the motor vehicle insurance market growth during the next few years. Also, rise in usage-based insurance and insurance telematics in motor vehicle insurance and emergence of third-party liability cover will lead to sizable demand in the market.
The report on the motor vehicle insurance market covers the following areas:
- Motor vehicle insurance market sizing
- Motor vehicle insurance market forecast
- Motor vehicle insurance market industry analysis
The robust vendor analysis is designed to help clients improve their market position, and in line with this, this report provides a detailed analysis of several leading motor vehicle insurance market vendors that include Allianz SE, American International Group Inc., Aviva insurance Ltd., AXA Group, Berkshire Hathaway Inc., Chubb Ltd., Desjardins Group, Discovery Ltd., Kotak Mahindra Bank Ltd., Liberty Mutual Holding Co. Inc., Navi Technologies Ltd, OCTO Telematics S.p.A, Reliance Capital Ltd., Sompo Holdings Inc., State Farm Mutual Automobile Insurance Co., The Allstate Corp., THE HANOVER INSURANCE GROUP INC., The Progressive Corp., The Travelers Co. Inc., and Zurich Insurance Co. Ltd.. Also, the motor vehicle insurance market analysis report includes information on upcoming trends and challenges that will influence market growth. This is to help companies strategize and leverage all forthcoming growth opportunities.
The study was conducted using an objective combination of primary and secondary information including inputs from key participants in the industry. The report contains a comprehensive market and vendor landscape in addition to an analysis of the key vendors.
The publisher presents a detailed picture of the market by the way of study, synthesis, and summation of data from multiple sources by an analysis of key parameters such as profit, pricing, competition, and promotions. It presents various market facets by identifying the key industry influencers. The data presented is comprehensive, reliable, and a result of extensive research - both primary and secondary. The market research reports provide a complete competitive landscape and an in-depth vendor selection methodology and analysis using qualitative and quantitative research to forecast the accurate market growth.
Table of Contents
1 Executive Summary
- 1.1 Market overview
- Executive Summary - Chart on Market Overview
- Executive Summary - Data Table on Market Overview
- Executive Summary - Chart on Global Market Characteristics
- Executive Summary - Chart on Market By Geographical Landscape
- Executive Summary - Chart on Market Segmentation by Application
- Executive Summary - Chart on Market Segmentation by Distribution Channel
- Executive Summary - Chart on Incremental Growth
- Executive Summary - Data Table on Incremental Growth
- Executive Summary - Chart on Company Market Positioning
2 Market Landscape
- 2.1 Market ecosystem
- Parent Market
- Data Table on - Parent Market
- 2.2 Market characteristics
- Market characteristics analysis
- 2.3 Value chain analysis
- Value Chain Analysis
3 Market Sizing
- 3.1 Market definition
- Offerings of companies included in the market definition
- 3.2 Market segment analysis
- Market segments
- 3.3 Market size 2023
- 3.4 Market outlook: Forecast for 2023-2028
- Chart on Global - Market size and forecast 2023-2028 ($ billion)
- Data Table on Global - Market size and forecast 2023-2028 ($ billion)
- Chart on Global Market: Year-over-year growth 2023-2028 (%)
- Data Table on Global Market: Year-over-year growth 2023-2028 (%)
4 Historic Market Size
- 4.1 Global Motor Vehicle Insurance Market 2018 - 2022
- Historic Market Size - Data Table on Global Motor Vehicle Insurance Market 2018 - 2022 ($ billion)
- 4.2 Application segment analysis 2018 - 2022
- Historic Market Size - Application Segment 2018 - 2022 ($ billion)
- 4.3 Distribution Channel segment analysis 2018 - 2022
- Historic Market Size - Distribution Channel Segment 2018 - 2022 ($ billion)
- 4.4 Geography segment analysis 2018 - 2022
- Historic Market Size - Geography Segment 2018 - 2022 ($ billion)
- 4.5 Country segment analysis 2018 - 2022
- Historic Market Size - Country Segment 2018 - 2022 ($ billion)
5 Five Forces Analysis
- 5.1 Five forces summary
- Five forces analysis - Comparison between 2023 and 2028
- 5.2 Bargaining power of buyers
- Bargaining power of buyers - Impact of key factors 2023 and 2028
- 5.3 Bargaining power of suppliers
- Bargaining power of suppliers - Impact of key factors in 2023 and 2028
- 5.4 Threat of new entrants
- Threat of new entrants - Impact of key factors in 2023 and 2028
- 5.5 Threat of substitutes
- Threat of substitutes - Impact of key factors in 2023 and 2028
- 5.6 Threat of rivalry
- Threat of rivalry - Impact of key factors in 2023 and 2028
- 5.7 Market condition
- Chart on Market condition - Five forces 2023 and 2028
6 Market Segmentation by Application
- 6.1 Market segments
- Chart on Application - Market share 2023-2028 (%)
- Data Table on Application - Market share 2023-2028 (%)
- 6.2 Comparison by Application
- Chart on Comparison by Application
- Data Table on Comparison by Application
- 6.3 Personal - Market size and forecast 2023-2028
- Chart on Personal - Market size and forecast 2023-2028 ($ billion)
- Data Table on Personal - Market size and forecast 2023-2028 ($ billion)
- Chart on Personal - Year-over-year growth 2023-2028 (%)
- Data Table on Personal - Year-over-year growth 2023-2028 (%)
- 6.4 Commercial - Market size and forecast 2023-2028
- Chart on Commercial - Market size and forecast 2023-2028 ($ billion)
- Data Table on Commercial - Market size and forecast 2023-2028 ($ billion)
- Chart on Commercial - Year-over-year growth 2023-2028 (%)
- Data Table on Commercial - Year-over-year growth 2023-2028 (%)
- 6.5 Market opportunity by Application
- Market opportunity by Application ($ billion)
- Data Table on Market opportunity by Application ($ billion)
7 Market Segmentation by Distribution Channel
- 7.1 Market segments
- Chart on Distribution Channel - Market share 2023-2028 (%)
- Data Table on Distribution Channel - Market share 2023-2028 (%)
- 7.2 Comparison by Distribution Channel
- Chart on Comparison by Distribution Channel
- Data Table on Comparison by Distribution Channel
- 7.3 Brokers - Market size and forecast 2023-2028
- Chart on Brokers - Market size and forecast 2023-2028 ($ billion)
- Data Table on Brokers - Market size and forecast 2023-2028 ($ billion)
- Chart on Brokers - Year-over-year growth 2023-2028 (%)
- Data Table on Brokers - Year-over-year growth 2023-2028 (%)
- 7.4 Direct - Market size and forecast 2023-2028
- Chart on Direct - Market size and forecast 2023-2028 ($ billion)
- Data Table on Direct - Market size and forecast 2023-2028 ($ billion)
- Chart on Direct - Year-over-year growth 2023-2028 (%)
- Data Table on Direct - Year-over-year growth 2023-2028 (%)
- 7.5 Banks - Market size and forecast 2023-2028
- Chart on Banks - Market size and forecast 2023-2028 ($ billion)
- Data Table on Banks - Market size and forecast 2023-2028 ($ billion)
- Chart on Banks - Year-over-year growth 2023-2028 (%)
- Data Table on Banks - Year-over-year growth 2023-2028 (%)
- 7.6 Others - Market size and forecast 2023-2028
- Chart on Others - Market size and forecast 2023-2028 ($ billion)
- Data Table on Others - Market size and forecast 2023-2028 ($ billion)
- Chart on Others - Year-over-year growth 2023-2028 (%)
- Data Table on Others - Year-over-year growth 2023-2028 (%)
- 7.7 Market opportunity by Distribution Channel
- Market opportunity by Distribution Channel ($ billion)
- Data Table on Market opportunity by Distribution Channel ($ billion)
8 Customer Landscape
- 8.1 Customer landscape overview
- Analysis of price sensitivity, lifecycle, customer purchase basket, adoption rates, and purchase criteria
9 Geographic Landscape
- 9.1 Geographic segmentation
- Chart on Market share By Geographical Landscape 2023-2028 (%)
- Data Table on Market share By Geographical Landscape 2023-2028 (%)
- 9.2 Geographic comparison
- Chart on Geographic comparison
- Data Table on Geographic comparison
- 9.3 North America - Market size and forecast 2023-2028
- Chart on North America - Market size and forecast 2023-2028 ($ billion)
- Data Table on North America - Market size and forecast 2023-2028 ($ billion)
- Chart on North America - Year-over-year growth 2023-2028 (%)
- Data Table on North America - Year-over-year growth 2023-2028 (%)
- 9.4 APAC - Market size and forecast 2023-2028
- Chart on APAC - Market size and forecast 2023-2028 ($ billion)
- Data Table on APAC - Market size and forecast 2023-2028 ($ billion)
- Chart on APAC - Year-over-year growth 2023-2028 (%)
- Data Table on APAC - Year-over-year growth 2023-2028 (%)
- 9.5 Europe - Market size and forecast 2023-2028
- Chart on Europe - Market size and forecast 2023-2028 ($ billion)
- Data Table on Europe - Market size and forecast 2023-2028 ($ billion)
- Chart on Europe - Year-over-year growth 2023-2028 (%)
- Data Table on Europe - Year-over-year growth 2023-2028 (%)
- 9.6 South America - Market size and forecast 2023-2028
- Chart on South America - Market size and forecast 2023-2028 ($ billion)
- Data Table on South America - Market size and forecast 2023-2028 ($ billion)
- Chart on South America - Year-over-year growth 2023-2028 (%)
- Data Table on South America - Year-over-year growth 2023-2028 (%)
- 9.7 Middle East and Africa - Market size and forecast 2023-2028
- Chart on Middle East and Africa - Market size and forecast 2023-2028 ($ billion)
- Data Table on Middle East and Africa - Market size and forecast 2023-2028 ($ billion)
- Chart on Middle East and Africa - Year-over-year growth 2023-2028 (%)
- Data Table on Middle East and Africa - Year-over-year growth 2023-2028 (%)
- 9.8 US - Market size and forecast 2023-2028
- Chart on US - Market size and forecast 2023-2028 ($ billion)
- Data Table on US - Market size and forecast 2023-2028 ($ billion)
- Chart on US - Year-over-year growth 2023-2028 (%)
- Data Table on US - Year-over-year growth 2023-2028 (%)
- 9.9 China - Market size and forecast 2023-2028
- Chart on China - Market size and forecast 2023-2028 ($ billion)
- Data Table on China - Market size and forecast 2023-2028 ($ billion)
- Chart on China - Year-over-year growth 2023-2028 (%)
- Data Table on China - Year-over-year growth 2023-2028 (%)
- 9.10 Japan - Market size and forecast 2023-2028
- Chart on Japan - Market size and forecast 2023-2028 ($ billion)
- Data Table on Japan - Market size and forecast 2023-2028 ($ billion)
- Chart on Japan - Year-over-year growth 2023-2028 (%)
- Data Table on Japan - Year-over-year growth 2023-2028 (%)
- 9.11 UK - Market size and forecast 2023-2028
- Chart on UK - Market size and forecast 2023-2028 ($ billion)
- Data Table on UK - Market size and forecast 2023-2028 ($ billion)
- Chart on UK - Year-over-year growth 2023-2028 (%)
- Data Table on UK - Year-over-year growth 2023-2028 (%)
- 9.12 France - Market size and forecast 2023-2028
- Chart on France - Market size and forecast 2023-2028 ($ billion)
- Data Table on France - Market size and forecast 2023-2028 ($ billion)
- Chart on France - Year-over-year growth 2023-2028 (%)
- Data Table on France - Year-over-year growth 2023-2028 (%)
- 9.13 Market opportunity By Geographical Landscape
- Market opportunity By Geographical Landscape ($ billion)
- Data Tables on Market opportunity By Geographical Landscape ($ billion)
10 Drivers, Challenges, and Opportunity/Restraints
- 10.1 Market drivers
- 10.2 Market challenges
- 10.3 Impact of drivers and challenges
- Impact of drivers and challenges in 2023 and 2028
- 10.4 Market opportunities/restraints
11 Competitive Landscape
- 11.1 Overview
- 11.2 Competitive Landscape
- Overview on criticality of inputs and factors of differentiation
- 11.3 Landscape disruption
- Overview on factors of disruption
- 11.4 Industry risks
- Impact of key risks on business
12 Competitive Analysis
- 12.1 Companies profiled
- Companies covered
- 12.2 Market positioning of companies
- Matrix on companies position and classification
- 12.3 Allianz SE
- Allianz SE - Overview
- Allianz SE - Business segments
- Allianz SE - Key news
- Allianz SE - Key offerings
- Allianz SE - Segment focus
- 12.4 American International Group Inc.
- American International Group Inc. - Overview
- American International Group Inc. - Business segments
- American International Group Inc. - Key news
- American International Group Inc. - Key offerings
- American International Group Inc. - Segment focus
- 12.5 AXA Group
- AXA Group - Overview
- AXA Group - Business segments
- AXA Group - Key news
- AXA Group - Key offerings
- AXA Group - Segment focus
- 12.6 Berkshire Hathaway Inc.
- Berkshire Hathaway Inc. - Overview
- Berkshire Hathaway Inc. - Business segments
- Berkshire Hathaway Inc. - Key news
- Berkshire Hathaway Inc. - Key offerings
- Berkshire Hathaway Inc. - Segment focus
- 12.7 Chubb Ltd.
- Chubb Ltd. - Overview
- Chubb Ltd. - Business segments
- Chubb Ltd. - Key news
- Chubb Ltd. - Key offerings
- Chubb Ltd. - Segment focus
- 12.8 Desjardins Group
- Desjardins Group - Overview
- Desjardins Group - Business segments
- Desjardins Group - Key offerings
- Desjardins Group - Segment focus
- 12.9 Discovery Ltd.
- Discovery Ltd. - Overview
- Discovery Ltd. - Business segments
- Discovery Ltd. - Key offerings
- Discovery Ltd. - Segment focus
- 12.10 Kotak Mahindra Bank Ltd.
- Kotak Mahindra Bank Ltd. - Overview
- Kotak Mahindra Bank Ltd. - Business segments
- Kotak Mahindra Bank Ltd. - Key offerings
- Kotak Mahindra Bank Ltd. - Segment focus
- 12.11 Liberty Mutual Holding Co. Inc.
- Liberty Mutual Holding Co. Inc. - Overview
- Liberty Mutual Holding Co. Inc. - Product / Service
- Liberty Mutual Holding Co. Inc. - Key offerings
- 12.12 Navi Technologies Ltd
- Navi Technologies Ltd - Overview
- Navi Technologies Ltd - Product / Service
- Navi Technologies Ltd - Key offerings
- 12.13 Reliance Capital Ltd.
- Reliance Capital Ltd. - Overview
- Reliance Capital Ltd. - Product / Service
- Reliance Capital Ltd. - Key offerings
- 12.14 State Farm Mutual Automobile Insurance Co.
- State Farm Mutual Automobile Insurance Co. - Overview
- State Farm Mutual Automobile Insurance Co. - Product / Service
- State Farm Mutual Automobile Insurance Co. - Key offerings
- 12.15 The Allstate Corp.
- The Allstate Corp. - Overview
- The Allstate Corp. - Business segments
- The Allstate Corp. - Key offerings
- The Allstate Corp. - Segment focus
- 12.16 The Progressive Corp.
- The Progressive Corp. - Overview
- The Progressive Corp. - Product / Service
- The Progressive Corp. - Key offerings
- 12.17 Zurich Insurance Co. Ltd.
- Zurich Insurance Co. Ltd. - Overview
- Zurich Insurance Co. Ltd. - Business segments
- Zurich Insurance Co. Ltd. - Key offerings
- Zurich Insurance Co. Ltd. - Segment focus
13 Appendix
- 13.1 Scope of the report
- 13.2 Inclusions and exclusions checklist
- Inclusions checklist
- Exclusions checklist
- 13.3 Currency conversion rates for US$
- Currency conversion rates for US$
- 13.4 Research methodology
- Research methodology
- 13.5 Data procurement
- Information sources
- 13.6 Data validation
- Data validation
- 13.7 Validation techniques employed for market sizing
- Validation techniques employed for market sizing
- 13.8 Data synthesis
- Data synthesis
- 13.9 360 degree market analysis
- 360 degree market analysis
- 13.10 List of abbreviations
- List of abbreviations

