|
|
市場調査レポート
商品コード
1515808
ディープラーニングチップの世界市場 2024-2028Global deep learning chips market 2024-2028 |
||||||

|
|||||||
カスタマイズ可能
|
|||||||


| ディープラーニングチップの世界市場 2024-2028 |
|
出版日: 2024年06月12日
発行: TechNavio
ページ情報: 英文 185 Pages
納期: 即納可能
|

全表示
- 概要
- 図表
- 目次
ディープラーニングチップ市場は2023-2028年に423億9,900万米ドル、予測期間中のCAGRは50.22%で成長すると予測されます。
当レポートでは、ディープラーニングチップ市場の全体的な分析、市場規模・予測、動向、成長促進要因、課題、約25のベンダーを網羅したベンダー分析などを掲載しています。
現在の市場シナリオ、最新動向と促進要因、市場環境全体に関する最新分析を提供しています。市場は、自律走行車におけるディープラーニングチップ採用の増加、AIアプリケーションの増加、データセンターにおけるディープラーニングチップ採用の増加が牽引しています。
| 市場範囲 | |
|---|---|
| 基準年 | 2024 |
| 終了年 | 2028 |
| 予測期間 | 2024-2028 |
| 成長モメンタム | 加速 |
| 前年比2024年 | 36.1% |
| CAGR | 50.22% |
| 増分額 | 423億9,900万米ドル |
本調査では、今後数年間のディープラーニングチップ市場成長を牽引する主な要因の一つとして、量子コンピューティングの進歩を挙げています。また、スマートロボットの市場開拓やディープラーニングチップの最近の動向は、市場の大きな需要につながります。
目次
第1章 エグゼクティブサマリー
- 市場概要
第2章 市場情勢
- 市場エコシステム
- 市場の特徴
- バリューチェーン分析
第3章 市場規模の評価
- 市場の定義
- 市場セグメント分析
- 市場規模 2023
- 市場の見通し 2023-2028
第4章 市場規模実績
- 世界ディープラーニングチップ市場 2018-2022
- 技術別セグメント分析 2018-2022
- エンドユーザー別セグメント分析 2018-2022
- 地域別セグメント分析 2018-2022
- 国別セグメント分析 2018-2022
第5章 ファイブフォース分析
- ファイブフォースの要約
- 買い手の交渉力
- 供給企業の交渉力
- 新規参入業者の脅威
- 代替品の脅威
- 競争の脅威
- 市況
第6章 市場セグメンテーション:技術別
- 市場セグメンテーション
- 比較:技術別
- システムオンチップ:市場規模と予測 2023-2028
- システムインパッケージ:市場規模と予測 2023-2028
- マルチチップモジュール:市場規模と予測 2023-2028
- その他:市場規模と予測 2023-2028
- 市場機会:技術別
第7章 市場セグメンテーション:エンドユーザー別
- 市場セグメンテーション
- 比較:エンドユーザー別
- BFSI:市場規模と予測 2023-2028
- ITおよび通信:市場規模と予測 2023-2028
- メディアと広告:市場規模と予測 2023-2028
- その他:市場規模と予測 2023-2028
- 市場機会:エンドユーザー別
第8章 顧客情勢
- 顧客情勢の概要
第9章 地域別情勢
- 地域別セグメンテーション
- 地域別比較
- 北米:市場規模と予測 2023-2028
- 欧州:市場規模と予測 2023-2028
- アジア太平洋:市場規模と予測 2023-2028
- 南米:市場規模と予測 2023-2028
- 中東・アフリカ:市場規模と予測 2023-2028
- 米国:市場規模と予測 2023-2028
- ドイツ:市場規模と予測 2023-2028
- 中国:市場規模と予測 2023-2028
- 英国:市場規模と予測 2023-2028
- 台湾:市場規模と予測 2023-2028
- 市場機会:地域情勢別
第10章 促進要因・課題・機会・抑制要因
- 市場促進要因
- 市場の課題
- 促進要因と課題の影響
- 市場の機会・抑制要因
第11章 競合情勢
- 概要
- 競合情勢
- 混乱の状況
- 業界のリスク
第12章 競合分析
- 企業プロファイル
- 企業の市場ポジショニング
- Advanced Micro Devices Inc.
- Alphabet Inc.
- Amazon.com Inc.
- Cerebras
- China Cambrian Technology Co. Ltd.
- Fujitsu Ltd.
- Graphcore Ltd.
- Intel Corp.
- International Business Machines Corp.
- MediaTek Inc.
- NVIDIA Corp.
- Qualcomm Inc.
- Samsung Electronics Co. Ltd.
- Syntiant Corp.
- Taiwan Semiconductor Manufacturing Co. Ltd.
第13章 付録
Exhibits:
- Exhibits1: Executive Summary - Chart on Market Overview
- Exhibits2: Executive Summary - Data Table on Market Overview
- Exhibits3: Executive Summary - Chart on Global Market Characteristics
- Exhibits4: Executive Summary - Chart on Market By Geographical Landscape
- Exhibits5: Executive Summary - Chart on Market Segmentation by Technology
- Exhibits6: Executive Summary - Chart on Market Segmentation by End-user
- Exhibits7: Executive Summary - Chart on Incremental Growth
- Exhibits8: Executive Summary - Data Table on Incremental Growth
- Exhibits9: Executive Summary - Chart on Company Market Positioning
- Exhibits10: Parent Market
- Exhibits11: Data Table on - Parent Market
- Exhibits12: Market characteristics analysis
- Exhibits13: Value Chain Analysis
- Exhibits14: Offerings of companies included in the market definition
- Exhibits15: Market segments
- Exhibits16: Chart on Global - Market size and forecast 2023-2028 ($ million)
- Exhibits17: Data Table on Global - Market size and forecast 2023-2028 ($ million)
- Exhibits18: Chart on Global Market: Year-over-year growth 2023-2028 (%)
- Exhibits19: Data Table on Global Market: Year-over-year growth 2023-2028 (%)
- Exhibits20: Historic Market Size - Data Table on Global Deep Learning Chips Market 2018 - 2022 ($ million)
- Exhibits21: Historic Market Size - Technology Segment 2018 - 2022 ($ million)
- Exhibits22: Historic Market Size - End-user Segment 2018 - 2022 ($ million)
- Exhibits23: Historic Market Size - Geography Segment 2018 - 2022 ($ million)
- Exhibits24: Historic Market Size - Country Segment 2018 - 2022 ($ million)
- Exhibits25: Five forces analysis - Comparison between 2023 and 2028
- Exhibits26: Bargaining power of buyers - Impact of key factors 2023 and 2028
- Exhibits27: Bargaining power of suppliers - Impact of key factors in 2023 and 2028
- Exhibits28: Threat of new entrants - Impact of key factors in 2023 and 2028
- Exhibits29: Threat of substitutes - Impact of key factors in 2023 and 2028
- Exhibits30: Threat of rivalry - Impact of key factors in 2023 and 2028
- Exhibits31: Chart on Market condition - Five forces 2023 and 2028
- Exhibits32: Chart on Technology - Market share 2023-2028 (%)
- Exhibits33: Data Table on Technology - Market share 2023-2028 (%)
- Exhibits34: Chart on Comparison by Technology
- Exhibits35: Data Table on Comparison by Technology
- Exhibits36: Chart on System-on-Chip - Market size and forecast 2023-2028 ($ million)
- Exhibits37: Data Table on System-on-Chip - Market size and forecast 2023-2028 ($ million)
- Exhibits38: Chart on System-on-Chip - Year-over-year growth 2023-2028 (%)
- Exhibits39: Data Table on System-on-Chip - Year-over-year growth 2023-2028 (%)
- Exhibits40: Chart on System-in-Package - Market size and forecast 2023-2028 ($ million)
- Exhibits41: Data Table on System-in-Package - Market size and forecast 2023-2028 ($ million)
- Exhibits42: Chart on System-in-Package - Year-over-year growth 2023-2028 (%)
- Exhibits43: Data Table on System-in-Package - Year-over-year growth 2023-2028 (%)
- Exhibits44: Chart on Multi-chip Module - Market size and forecast 2023-2028 ($ million)
- Exhibits45: Data Table on Multi-chip Module - Market size and forecast 2023-2028 ($ million)
- Exhibits46: Chart on Multi-chip Module - Year-over-year growth 2023-2028 (%)
- Exhibits47: Data Table on Multi-chip Module - Year-over-year growth 2023-2028 (%)
- Exhibits48: Chart on Others - Market size and forecast 2023-2028 ($ million)
- Exhibits49: Data Table on Others - Market size and forecast 2023-2028 ($ million)
- Exhibits50: Chart on Others - Year-over-year growth 2023-2028 (%)
- Exhibits51: Data Table on Others - Year-over-year growth 2023-2028 (%)
- Exhibits52: Market opportunity by Technology ($ million)
- Exhibits53: Data Table on Market opportunity by Technology ($ million)
- Exhibits54: Chart on End-user - Market share 2023-2028 (%)
- Exhibits55: Data Table on End-user - Market share 2023-2028 (%)
- Exhibits56: Chart on Comparison by End-user
- Exhibits57: Data Table on Comparison by End-user
- Exhibits58: Chart on BFSI - Market size and forecast 2023-2028 ($ million)
- Exhibits59: Data Table on BFSI - Market size and forecast 2023-2028 ($ million)
- Exhibits60: Chart on BFSI - Year-over-year growth 2023-2028 (%)
- Exhibits61: Data Table on BFSI - Year-over-year growth 2023-2028 (%)
- Exhibits62: Chart on IT and telecom - Market size and forecast 2023-2028 ($ million)
- Exhibits63: Data Table on IT and telecom - Market size and forecast 2023-2028 ($ million)
- Exhibits64: Chart on IT and telecom - Year-over-year growth 2023-2028 (%)
- Exhibits65: Data Table on IT and telecom - Year-over-year growth 2023-2028 (%)
- Exhibits66: Chart on Media and advertising - Market size and forecast 2023-2028 ($ million)
- Exhibits67: Data Table on Media and advertising - Market size and forecast 2023-2028 ($ million)
- Exhibits68: Chart on Media and advertising - Year-over-year growth 2023-2028 (%)
- Exhibits69: Data Table on Media and advertising - Year-over-year growth 2023-2028 (%)
- Exhibits70: Chart on Others - Market size and forecast 2023-2028 ($ million)
- Exhibits71: Data Table on Others - Market size and forecast 2023-2028 ($ million)
- Exhibits72: Chart on Others - Year-over-year growth 2023-2028 (%)
- Exhibits73: Data Table on Others - Year-over-year growth 2023-2028 (%)
- Exhibits74: Market opportunity by End-user ($ million)
- Exhibits75: Data Table on Market opportunity by End-user ($ million)
- Exhibits76: Analysis of price sensitivity, lifecycle, customer purchase basket, adoption rates, and purchase criteria
- Exhibits77: Chart on Market share By Geographical Landscape 2023-2028 (%)
- Exhibits78: Data Table on Market share By Geographical Landscape 2023-2028 (%)
- Exhibits79: Chart on Geographic comparison
- Exhibits80: Data Table on Geographic comparison
- Exhibits81: Chart on North America - Market size and forecast 2023-2028 ($ million)
- Exhibits82: Data Table on North America - Market size and forecast 2023-2028 ($ million)
- Exhibits83: Chart on North America - Year-over-year growth 2023-2028 (%)
- Exhibits84: Data Table on North America - Year-over-year growth 2023-2028 (%)
- Exhibits85: Chart on Europe - Market size and forecast 2023-2028 ($ million)
- Exhibits86: Data Table on Europe - Market size and forecast 2023-2028 ($ million)
- Exhibits87: Chart on Europe - Year-over-year growth 2023-2028 (%)
- Exhibits88: Data Table on Europe - Year-over-year growth 2023-2028 (%)
- Exhibits89: Chart on APAC - Market size and forecast 2023-2028 ($ million)
- Exhibits90: Data Table on APAC - Market size and forecast 2023-2028 ($ million)
- Exhibits91: Chart on APAC - Year-over-year growth 2023-2028 (%)
- Exhibits92: Data Table on APAC - Year-over-year growth 2023-2028 (%)
- Exhibits93: Chart on South America - Market size and forecast 2023-2028 ($ million)
- Exhibits94: Data Table on South America - Market size and forecast 2023-2028 ($ million)
- Exhibits95: Chart on South America - Year-over-year growth 2023-2028 (%)
- Exhibits96: Data Table on South America - Year-over-year growth 2023-2028 (%)
- Exhibits97: Chart on Middle East and Africa - Market size and forecast 2023-2028 ($ million)
- Exhibits98: Data Table on Middle East and Africa - Market size and forecast 2023-2028 ($ million)
- Exhibits99: Chart on Middle East and Africa - Year-over-year growth 2023-2028 (%)
- Exhibits100: Data Table on Middle East and Africa - Year-over-year growth 2023-2028 (%)
- Exhibits101: Chart on US - Market size and forecast 2023-2028 ($ million)
- Exhibits102: Data Table on US - Market size and forecast 2023-2028 ($ million)
- Exhibits103: Chart on US - Year-over-year growth 2023-2028 (%)
- Exhibits104: Data Table on US - Year-over-year growth 2023-2028 (%)
- Exhibits105: Chart on Germany - Market size and forecast 2023-2028 ($ million)
- Exhibits106: Data Table on Germany - Market size and forecast 2023-2028 ($ million)
- Exhibits107: Chart on Germany - Year-over-year growth 2023-2028 (%)
- Exhibits108: Data Table on Germany - Year-over-year growth 2023-2028 (%)
- Exhibits109: Chart on China - Market size and forecast 2023-2028 ($ million)
- Exhibits110: Data Table on China - Market size and forecast 2023-2028 ($ million)
- Exhibits111: Chart on China - Year-over-year growth 2023-2028 (%)
- Exhibits112: Data Table on China - Year-over-year growth 2023-2028 (%)
- Exhibits113: Chart on UK - Market size and forecast 2023-2028 ($ million)
- Exhibits114: Data Table on UK - Market size and forecast 2023-2028 ($ million)
- Exhibits115: Chart on UK - Year-over-year growth 2023-2028 (%)
- Exhibits116: Data Table on UK - Year-over-year growth 2023-2028 (%)
- Exhibits117: Chart on Taiwan - Market size and forecast 2023-2028 ($ million)
- Exhibits118: Data Table on Taiwan - Market size and forecast 2023-2028 ($ million)
- Exhibits119: Chart on Taiwan - Year-over-year growth 2023-2028 (%)
- Exhibits120: Data Table on Taiwan - Year-over-year growth 2023-2028 (%)
- Exhibits121: Market opportunity By Geographical Landscape ($ million)
- Exhibits122: Data Tables on Market opportunity By Geographical Landscape ($ million)
- Exhibits123: Impact of drivers and challenges in 2023 and 2028
- Exhibits124: Overview on criticality of inputs and factors of differentiation
- Exhibits125: Overview on factors of disruption
- Exhibits126: Impact of key risks on business
- Exhibits127: Companies covered
- Exhibits128: Matrix on companies position and classification
- Exhibits129: Advanced Micro Devices Inc. - Overview
- Exhibits130: Advanced Micro Devices Inc. - Business segments
- Exhibits131: Advanced Micro Devices Inc. - Key news
- Exhibits132: Advanced Micro Devices Inc. - Key offerings
- Exhibits133: Advanced Micro Devices Inc. - Segment focus
- Exhibits134: Alphabet Inc. - Overview
- Exhibits135: Alphabet Inc. - Business segments
- Exhibits136: Alphabet Inc. - Key offerings
- Exhibits137: Alphabet Inc. - Segment focus
- Exhibits138: Amazon.com Inc. - Overview
- Exhibits139: Amazon.com Inc. - Business segments
- Exhibits140: Amazon.com Inc. - Key news
- Exhibits141: Amazon.com Inc. - Key offerings
- Exhibits142: Amazon.com Inc. - Segment focus
- Exhibits143: Cerebras - Overview
- Exhibits144: Cerebras - Product / Service
- Exhibits145: Cerebras - Key offerings
- Exhibits146: China Cambrian Technology Co. Ltd. - Overview
- Exhibits147: China Cambrian Technology Co. Ltd. - Product / Service
- Exhibits148: China Cambrian Technology Co. Ltd. - Key offerings
- Exhibits149: Fujitsu Ltd. - Overview
- Exhibits150: Fujitsu Ltd. - Business segments
- Exhibits151: Fujitsu Ltd. - Key news
- Exhibits152: Fujitsu Ltd. - Key offerings
- Exhibits153: Fujitsu Ltd. - Segment focus
- Exhibits154: Graphcore Ltd. - Overview
- Exhibits155: Graphcore Ltd. - Product / Service
- Exhibits156: Graphcore Ltd. - Key offerings
- Exhibits157: Intel Corp. - Overview
- Exhibits158: Intel Corp. - Business segments
- Exhibits159: Intel Corp. - Key news
- Exhibits160: Intel Corp. - Key offerings
- Exhibits161: Intel Corp. - Segment focus
- Exhibits162: International Business Machines Corp. - Overview
- Exhibits163: International Business Machines Corp. - Business segments
- Exhibits164: International Business Machines Corp. - Key news
- Exhibits165: International Business Machines Corp. - Key offerings
- Exhibits166: International Business Machines Corp. - Segment focus
- Exhibits167: MediaTek Inc. - Overview
- Exhibits168: MediaTek Inc. - Product / Service
- Exhibits169: MediaTek Inc. - Key news
- Exhibits170: MediaTek Inc. - Key offerings
- Exhibits171: NVIDIA Corp. - Overview
- Exhibits172: NVIDIA Corp. - Business segments
- Exhibits173: NVIDIA Corp. - Key news
- Exhibits174: NVIDIA Corp. - Key offerings
- Exhibits175: NVIDIA Corp. - Segment focus
- Exhibits176: Qualcomm Inc. - Overview
- Exhibits177: Qualcomm Inc. - Business segments
- Exhibits178: Qualcomm Inc. - Key news
- Exhibits179: Qualcomm Inc. - Key offerings
- Exhibits180: Qualcomm Inc. - Segment focus
- Exhibits181: Samsung Electronics Co. Ltd. - Overview
- Exhibits182: Samsung Electronics Co. Ltd. - Business segments
- Exhibits183: Samsung Electronics Co. Ltd. - Key news
- Exhibits184: Samsung Electronics Co. Ltd. - Key offerings
- Exhibits185: Samsung Electronics Co. Ltd. - Segment focus
- Exhibits186: Syntiant Corp. - Overview
- Exhibits187: Syntiant Corp. - Product / Service
- Exhibits188: Syntiant Corp. - Key offerings
- Exhibits189: Taiwan Semiconductor Manufacturing Co. Ltd. - Overview
- Exhibits190: Taiwan Semiconductor Manufacturing Co. Ltd. - Product / Service
- Exhibits191: Taiwan Semiconductor Manufacturing Co. Ltd. - Key offerings
- Exhibits192: Inclusions checklist
- Exhibits193: Exclusions checklist
- Exhibits194: Currency conversion rates for US$
- Exhibits195: Research methodology
- Exhibits196: Information sources
- Exhibits197: Data validation
- Exhibits198: Validation techniques employed for market sizing
- Exhibits199: Data synthesis
- Exhibits200: 360 degree market analysis
- Exhibits201: List of abbreviations
The deep learning chips market is forecasted to grow by USD 42399 mn during 2023-2028, accelerating at a CAGR of 50.22% during the forecast period. The report on the deep learning chips market provides a holistic analysis, market size and forecast, trends, growth drivers, and challenges, as well as vendor analysis covering around 25 vendors.
The report offers an up-to-date analysis regarding the current market scenario, the latest trends and drivers, and the overall market environment. The market is driven by rise in adoption of deep learning chips in autonomous vehicles, growing number of ai applications, and rise in adoption of deep learning chips in data center.
Technavio's deep learning chips market is segmented as below:
| Market Scope | |
|---|---|
| Base Year | 2024 |
| End Year | 2028 |
| Series Year | 2024-2028 |
| Growth Momentum | Accelerate |
| YOY 2024 | 36.1% |
| CAGR | 50.22% |
| Incremental Value | $42399mn |
ByTechnology
- System-on-Chip
- System-in-Package
- Multi-chip Module
- Others
ByEnd-user
- BFSI
- IT and telecom
- Media and advertising
- Others
ByGeography
- North America
- Europe
- APAC
- South America
- Middle East and Africa
This study identifies the advances in quantum computing as one of the prime reasons driving the deep learning chips market growth during the next few years. Also, rise in development of smart robots and recent development in deep learning chips will lead to sizable demand in the market.
The report on the deep learning chips market covers the following areas:
- Deep learning chips market sizing
- Deep learning chips market forecast
- Deep learning chips market industry analysis
The robust vendor analysis is designed to help clients improve their market position, and in line with this, this report provides a detailed analysis of several leading deep learning chips market vendors that include Achronix Semiconductor Corp., Advanced Micro Devices Inc., Alphabet Inc., Amazon.com Inc., Cerebras, China Cambrian Technology Co. Ltd., Flex Logix Technologies Inc., Fujitsu Ltd., Graphcore Ltd., Groq Inc., Intel Corp., International Business Machines Corp., MediaTek Inc., NVIDIA Corp., Qualcomm Inc., Samsung Electronics Co. Ltd., Synopsys Inc., Syntiant Corp., Taiwan Semiconductor Manufacturing Co. Ltd., and ThinkForce. Also, the deep learning chips market analysis report includes information on upcoming trends and challenges that will influence market growth. This is to help companies strategize and leverage all forthcoming growth opportunities.
The study was conducted using an objective combination of primary and secondary information including inputs from key participants in the industry. The report contains a comprehensive market and vendor landscape in addition to an analysis of the key vendors.
The publisher presents a detailed picture of the market by the way of study, synthesis, and summation of data from multiple sources by an analysis of key parameters such as profit, pricing, competition, and promotions. It presents various market facets by identifying the key industry influencers. The data presented is comprehensive, reliable, and a result of extensive research - both primary and secondary. The market research reports provide a complete competitive landscape and an in-depth vendor selection methodology and analysis using qualitative and quantitative research to forecast the accurate market growth.
Table of Contents
1 Executive Summary
- 1.1 Market overview
- Executive Summary - Chart on Market Overview
- Executive Summary - Data Table on Market Overview
- Executive Summary - Chart on Global Market Characteristics
- Executive Summary - Chart on Market By Geographical Landscape
- Executive Summary - Chart on Market Segmentation by Technology
- Executive Summary - Chart on Market Segmentation by End-user
- Executive Summary - Chart on Incremental Growth
- Executive Summary - Data Table on Incremental Growth
- Executive Summary - Chart on Company Market Positioning
2 Market Landscape
- 2.1 Market ecosystem
- Parent Market
- Data Table on - Parent Market
- 2.2 Market characteristics
- Market characteristics analysis
- 2.3 Value chain analysis
- Value Chain Analysis
3 Market Sizing
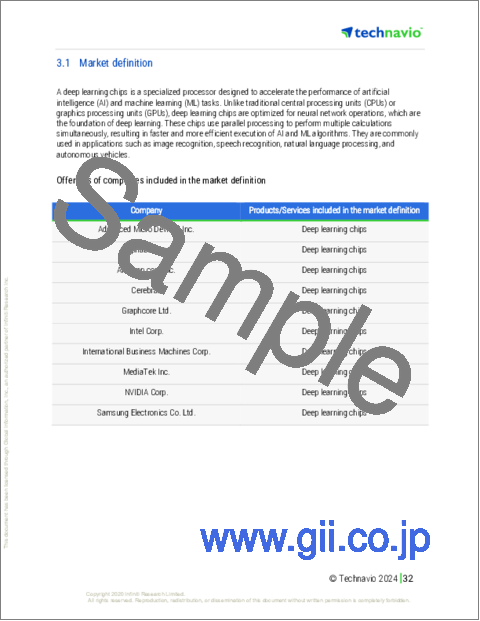
- 3.1 Market definition
- Offerings of companies included in the market definition
- 3.2 Market segment analysis
- Market segments
- 3.3 Market size 2023
- 3.4 Market outlook: Forecast for 2023-2028
- Chart on Global - Market size and forecast 2023-2028 ($ million)
- Data Table on Global - Market size and forecast 2023-2028 ($ million)
- Chart on Global Market: Year-over-year growth 2023-2028 (%)
- Data Table on Global Market: Year-over-year growth 2023-2028 (%)
4 Historic Market Size
- 4.1 Global Deep Learning Chips Market 2018 - 2022
- Historic Market Size - Data Table on Global Deep Learning Chips Market 2018 - 2022 ($ million)
- 4.2 Technology segment analysis 2018 - 2022
- Historic Market Size - Technology Segment 2018 - 2022 ($ million)
- 4.3 End-user segment analysis 2018 - 2022
- Historic Market Size - End-user Segment 2018 - 2022 ($ million)
- 4.4 Geography segment analysis 2018 - 2022
- Historic Market Size - Geography Segment 2018 - 2022 ($ million)
- 4.5 Country segment analysis 2018 - 2022
- Historic Market Size - Country Segment 2018 - 2022 ($ million)
5 Five Forces Analysis
- 5.1 Five forces summary
- Five forces analysis - Comparison between 2023 and 2028
- 5.2 Bargaining power of buyers
- Bargaining power of buyers - Impact of key factors 2023 and 2028
- 5.3 Bargaining power of suppliers
- Bargaining power of suppliers - Impact of key factors in 2023 and 2028
- 5.4 Threat of new entrants
- Threat of new entrants - Impact of key factors in 2023 and 2028
- 5.5 Threat of substitutes
- Threat of substitutes - Impact of key factors in 2023 and 2028
- 5.6 Threat of rivalry
- Threat of rivalry - Impact of key factors in 2023 and 2028
- 5.7 Market condition
- Chart on Market condition - Five forces 2023 and 2028
6 Market Segmentation by Technology
- 6.1 Market segments
- Chart on Technology - Market share 2023-2028 (%)
- Data Table on Technology - Market share 2023-2028 (%)
- 6.2 Comparison by Technology
- Chart on Comparison by Technology
- Data Table on Comparison by Technology
- 6.3 System-on-Chip - Market size and forecast 2023-2028
- Chart on System-on-Chip - Market size and forecast 2023-2028 ($ million)
- Data Table on System-on-Chip - Market size and forecast 2023-2028 ($ million)
- Chart on System-on-Chip - Year-over-year growth 2023-2028 (%)
- Data Table on System-on-Chip - Year-over-year growth 2023-2028 (%)
- 6.4 System-in-Package - Market size and forecast 2023-2028
- Chart on System-in-Package - Market size and forecast 2023-2028 ($ million)
- Data Table on System-in-Package - Market size and forecast 2023-2028 ($ million)
- Chart on System-in-Package - Year-over-year growth 2023-2028 (%)
- Data Table on System-in-Package - Year-over-year growth 2023-2028 (%)
- 6.5 Multi-chip Module - Market size and forecast 2023-2028
- Chart on Multi-chip Module - Market size and forecast 2023-2028 ($ million)
- Data Table on Multi-chip Module - Market size and forecast 2023-2028 ($ million)
- Chart on Multi-chip Module - Year-over-year growth 2023-2028 (%)
- Data Table on Multi-chip Module - Year-over-year growth 2023-2028 (%)
- 6.6 Others - Market size and forecast 2023-2028
- Chart on Others - Market size and forecast 2023-2028 ($ million)
- Data Table on Others - Market size and forecast 2023-2028 ($ million)
- Chart on Others - Year-over-year growth 2023-2028 (%)
- Data Table on Others - Year-over-year growth 2023-2028 (%)
- 6.7 Market opportunity by Technology
- Market opportunity by Technology ($ million)
- Data Table on Market opportunity by Technology ($ million)
7 Market Segmentation by End-user
- 7.1 Market segments
- Chart on End-user - Market share 2023-2028 (%)
- Data Table on End-user - Market share 2023-2028 (%)
- 7.2 Comparison by End-user
- Chart on Comparison by End-user
- Data Table on Comparison by End-user
- 7.3 BFSI - Market size and forecast 2023-2028
- Chart on BFSI - Market size and forecast 2023-2028 ($ million)
- Data Table on BFSI - Market size and forecast 2023-2028 ($ million)
- Chart on BFSI - Year-over-year growth 2023-2028 (%)
- Data Table on BFSI - Year-over-year growth 2023-2028 (%)
- 7.4 IT and telecom - Market size and forecast 2023-2028
- Chart on IT and telecom - Market size and forecast 2023-2028 ($ million)
- Data Table on IT and telecom - Market size and forecast 2023-2028 ($ million)
- Chart on IT and telecom - Year-over-year growth 2023-2028 (%)
- Data Table on IT and telecom - Year-over-year growth 2023-2028 (%)
- 7.5 Media and advertising - Market size and forecast 2023-2028
- Chart on Media and advertising - Market size and forecast 2023-2028 ($ million)
- Data Table on Media and advertising - Market size and forecast 2023-2028 ($ million)
- Chart on Media and advertising - Year-over-year growth 2023-2028 (%)
- Data Table on Media and advertising - Year-over-year growth 2023-2028 (%)
- 7.6 Others - Market size and forecast 2023-2028
- Chart on Others - Market size and forecast 2023-2028 ($ million)
- Data Table on Others - Market size and forecast 2023-2028 ($ million)
- Chart on Others - Year-over-year growth 2023-2028 (%)
- Data Table on Others - Year-over-year growth 2023-2028 (%)
- 7.7 Market opportunity by End-user
- Market opportunity by End-user ($ million)
- Data Table on Market opportunity by End-user ($ million)
8 Customer Landscape
- 8.1 Customer landscape overview
- Analysis of price sensitivity, lifecycle, customer purchase basket, adoption rates, and purchase criteria
9 Geographic Landscape
- 9.1 Geographic segmentation
- Chart on Market share By Geographical Landscape 2023-2028 (%)
- Data Table on Market share By Geographical Landscape 2023-2028 (%)
- 9.2 Geographic comparison
- Chart on Geographic comparison
- Data Table on Geographic comparison
- 9.3 North America - Market size and forecast 2023-2028
- Chart on North America - Market size and forecast 2023-2028 ($ million)
- Data Table on North America - Market size and forecast 2023-2028 ($ million)
- Chart on North America - Year-over-year growth 2023-2028 (%)
- Data Table on North America - Year-over-year growth 2023-2028 (%)
- 9.4 Europe - Market size and forecast 2023-2028
- Chart on Europe - Market size and forecast 2023-2028 ($ million)
- Data Table on Europe - Market size and forecast 2023-2028 ($ million)
- Chart on Europe - Year-over-year growth 2023-2028 (%)
- Data Table on Europe - Year-over-year growth 2023-2028 (%)
- 9.5 APAC - Market size and forecast 2023-2028
- Chart on APAC - Market size and forecast 2023-2028 ($ million)
- Data Table on APAC - Market size and forecast 2023-2028 ($ million)
- Chart on APAC - Year-over-year growth 2023-2028 (%)
- Data Table on APAC - Year-over-year growth 2023-2028 (%)
- 9.6 South America - Market size and forecast 2023-2028
- Chart on South America - Market size and forecast 2023-2028 ($ million)
- Data Table on South America - Market size and forecast 2023-2028 ($ million)
- Chart on South America - Year-over-year growth 2023-2028 (%)
- Data Table on South America - Year-over-year growth 2023-2028 (%)
- 9.7 Middle East and Africa - Market size and forecast 2023-2028
- Chart on Middle East and Africa - Market size and forecast 2023-2028 ($ million)
- Data Table on Middle East and Africa - Market size and forecast 2023-2028 ($ million)
- Chart on Middle East and Africa - Year-over-year growth 2023-2028 (%)
- Data Table on Middle East and Africa - Year-over-year growth 2023-2028 (%)
- 9.8 US - Market size and forecast 2023-2028
- Chart on US - Market size and forecast 2023-2028 ($ million)
- Data Table on US - Market size and forecast 2023-2028 ($ million)
- Chart on US - Year-over-year growth 2023-2028 (%)
- Data Table on US - Year-over-year growth 2023-2028 (%)
- 9.9 Germany - Market size and forecast 2023-2028
- Chart on Germany - Market size and forecast 2023-2028 ($ million)
- Data Table on Germany - Market size and forecast 2023-2028 ($ million)
- Chart on Germany - Year-over-year growth 2023-2028 (%)
- Data Table on Germany - Year-over-year growth 2023-2028 (%)
- 9.10 China - Market size and forecast 2023-2028
- Chart on China - Market size and forecast 2023-2028 ($ million)
- Data Table on China - Market size and forecast 2023-2028 ($ million)
- Chart on China - Year-over-year growth 2023-2028 (%)
- Data Table on China - Year-over-year growth 2023-2028 (%)
- 9.11 UK - Market size and forecast 2023-2028
- Chart on UK - Market size and forecast 2023-2028 ($ million)
- Data Table on UK - Market size and forecast 2023-2028 ($ million)
- Chart on UK - Year-over-year growth 2023-2028 (%)
- Data Table on UK - Year-over-year growth 2023-2028 (%)
- 9.12 Taiwan - Market size and forecast 2023-2028
- Chart on Taiwan - Market size and forecast 2023-2028 ($ million)
- Data Table on Taiwan - Market size and forecast 2023-2028 ($ million)
- Chart on Taiwan - Year-over-year growth 2023-2028 (%)
- Data Table on Taiwan - Year-over-year growth 2023-2028 (%)
- 9.13 Market opportunity By Geographical Landscape
- Market opportunity By Geographical Landscape ($ million)
- Data Tables on Market opportunity By Geographical Landscape ($ million)
10 Drivers, Challenges, and Opportunity/Restraints
- 10.1 Market drivers
- 10.2 Market challenges
- 10.3 Impact of drivers and challenges
- Impact of drivers and challenges in 2023 and 2028
- 10.4 Market opportunities/restraints
11 Competitive Landscape
- 11.1 Overview
- 11.2 Competitive Landscape
- Overview on criticality of inputs and factors of differentiation
- 11.3 Landscape disruption
- Overview on factors of disruption
- 11.4 Industry risks
- Impact of key risks on business
12 Competitive Analysis
- 12.1 Companies profiled
- Companies covered
- 12.2 Market positioning of companies
- Matrix on companies position and classification
- 12.3 Advanced Micro Devices Inc.
- Advanced Micro Devices Inc. - Overview
- Advanced Micro Devices Inc. - Business segments
- Advanced Micro Devices Inc. - Key news
- Advanced Micro Devices Inc. - Key offerings
- Advanced Micro Devices Inc. - Segment focus
- 12.4 Alphabet Inc.
- Alphabet Inc. - Overview
- Alphabet Inc. - Business segments
- Alphabet Inc. - Key offerings
- Alphabet Inc. - Segment focus
- 12.5 Amazon.com Inc.
- Amazon.com Inc. - Overview
- Amazon.com Inc. - Business segments
- Amazon.com Inc. - Key news
- Amazon.com Inc. - Key offerings
- Amazon.com Inc. - Segment focus
- 12.6 Cerebras
- Cerebras - Overview
- Cerebras - Product / Service
- Cerebras - Key offerings
- 12.7 China Cambrian Technology Co. Ltd.
- China Cambrian Technology Co. Ltd. - Overview
- China Cambrian Technology Co. Ltd. - Product / Service
- China Cambrian Technology Co. Ltd. - Key offerings
- 12.8 Fujitsu Ltd.
- Fujitsu Ltd. - Overview
- Fujitsu Ltd. - Business segments
- Fujitsu Ltd. - Key news
- Fujitsu Ltd. - Key offerings
- Fujitsu Ltd. - Segment focus
- 12.9 Graphcore Ltd.
- Graphcore Ltd. - Overview
- Graphcore Ltd. - Product / Service
- Graphcore Ltd. - Key offerings
- 12.10 Intel Corp.
- Intel Corp. - Overview
- Intel Corp. - Business segments
- Intel Corp. - Key news
- Intel Corp. - Key offerings
- Intel Corp. - Segment focus
- 12.11 International Business Machines Corp.
- International Business Machines Corp. - Overview
- International Business Machines Corp. - Business segments
- International Business Machines Corp. - Key news
- International Business Machines Corp. - Key offerings
- International Business Machines Corp. - Segment focus
- 12.12 MediaTek Inc.
- MediaTek Inc. - Overview
- MediaTek Inc. - Product / Service
- MediaTek Inc. - Key news
- MediaTek Inc. - Key offerings
- 12.13 NVIDIA Corp.
- NVIDIA Corp. - Overview
- NVIDIA Corp. - Business segments
- NVIDIA Corp. - Key news
- NVIDIA Corp. - Key offerings
- NVIDIA Corp. - Segment focus
- 12.14 Qualcomm Inc.
- Qualcomm Inc. - Overview
- Qualcomm Inc. - Business segments
- Qualcomm Inc. - Key news
- Qualcomm Inc. - Key offerings
- Qualcomm Inc. - Segment focus
- 12.15 Samsung Electronics Co. Ltd.
- Samsung Electronics Co. Ltd. - Overview
- Samsung Electronics Co. Ltd. - Business segments
- Samsung Electronics Co. Ltd. - Key news
- Samsung Electronics Co. Ltd. - Key offerings
- Samsung Electronics Co. Ltd. - Segment focus
- 12.16 Syntiant Corp.
- Syntiant Corp. - Overview
- Syntiant Corp. - Product / Service
- Syntiant Corp. - Key offerings
- 12.17 Taiwan Semiconductor Manufacturing Co. Ltd.
- Taiwan Semiconductor Manufacturing Co. Ltd. - Overview
- Taiwan Semiconductor Manufacturing Co. Ltd. - Product / Service
- Taiwan Semiconductor Manufacturing Co. Ltd. - Key offerings
13 Appendix
- 13.1 Scope of the report
- 13.2 Inclusions and exclusions checklist
- Inclusions checklist
- Exclusions checklist
- 13.3 Currency conversion rates for US$
- Currency conversion rates for US$
- 13.4 Research methodology
- Research methodology
- 13.5 Data procurement
- Information sources
- 13.6 Data validation
- Data validation
- 13.7 Validation techniques employed for market sizing
- Validation techniques employed for market sizing
- 13.8 Data synthesis
- Data synthesis
- 13.9 360 degree market analysis
- 360 degree market analysis
- 13.10 List of abbreviations
- List of abbreviations

