|
|
市場調査レポート
商品コード
1557519
ステビアの世界市場 2024-2028Global Stevia Market 2024-2028 |
||||||

|
|||||||
カスタマイズ可能
|
|||||||


| ステビアの世界市場 2024-2028 |
|
出版日: 2024年08月15日
発行: TechNavio
ページ情報: 英文 156 Pages
納期: 即納可能
|

全表示
- 概要
- 図表
- 目次
ステビア市場は2023-2028年に3億1,020万米ドル、予測期間中のCAGRは8.08%で成長すると予測されます。
当レポートでは、ステビア市場の全体的な分析、市場規模・予測、動向、成長促進要因、課題、約25のベンダーを網羅したベンダー分析などを掲載しています。
現在の市場シナリオ、最新動向と促進要因、市場環境全体に関する最新分析を提供しています。市場は、天然甘味料への高い需要、ステビアに基づく製品の頻繁な発売、企業間のM&Aの上昇によって牽引されています。
| 市場範囲 | |
|---|---|
| 基準年 | 2024 |
| 終了年 | 2028 |
| 予測期間 | 2024-2028 |
| 成長モメンタム | 加速 |
| 前年比2024年 | 7.32% |
| CAGR | 8.08% |
| 増分額 | 3億1,020万米ドル |
本調査では、今後数年間のステビア市場成長を牽引する主な要因として、栄養補助食品業界からのステビア需要の増加を挙げています。また、消費者の嗜好の変化とオンライン普及の増加が、市場の大きな需要につながります。
目次
第1章 エグゼクティブサマリー
- 市場概要
第2章 市場情勢
- 市場エコシステム
- 市場の特徴
- バリューチェーン分析
第3章 市場規模の評価
- 市場の定義
- 市場セグメント分析
- 市場規模 2023
- 市場の見通し 2023-2028
第4章 市場規模実績
- ステビアの世界市場 2018-2022
- 用途別セグメント分析 2018-2022
- タイプ別セグメント分析 2018-2022
- 地域別セグメント分析 2018-2022
- 国別セグメント分析 2018-2022
第5章 ファイブフォース分析
- ファイブフォースの要約
- 買い手の交渉力
- 供給企業の交渉力
- 新規参入業者の脅威
- 代替品の脅威
- 競争の脅威
- 市況
第6章 市場セグメンテーション:用途別
- 市場セグメンテーション
- 比較:用途別
- 飲料分野:市場規模と予測 2023-2028
- 食品分野:市場規模と予測 2023-2028
- 医薬品その他:市場規模と予測 2023-2028
- 市場機会:用途別
第7章 市場セグメンテーション:タイプ別
- 市場セグメンテーション
- 比較:タイプ別
- 粉末抽出物:市場規模と予測 2023-2028
- 液体抽出物:市場規模と予測 2023-2028
- 市場機会:タイプ別
第8章 顧客情勢
- 顧客情勢の概要
第9章 地域別情勢
- 地域別セグメンテーション
- 地域別比較
- アジア太平洋:市場規模と予測 2023-2028
- 北米:市場規模と予測 2023-2028
- 欧州:市場規模と予測 2023-2028
- 南米:市場規模と予測 2023-2028
- 中東・アフリカ:市場規模と予測 2023-2028
- 米国:市場規模と予測 2023-2028
- 中国:市場規模と予測 2023-2028
- 日本:市場規模と予測 2023-2028
- スペイン:市場規模と予測 2023-2028
- ドイツ:市場規模と予測 2023-2028
- 市場機会:地域情勢別
第10章 促進要因・課題・機会・抑制要因
- 市場促進要因
- 市場の課題
- 促進要因と課題の影響
- 市場の機会・抑制要因
第11章 競合情勢
- 概要
- 競合情勢
- 混乱の状況
- 業界のリスク
第12章 競合分析
- 企業プロファイル
- 企業の市場ポジショニング
- Archer Daniels Midland Co.
- Cargill Inc.
- Guilin Layn Natural Ingredients Corp.
- HOWTIAN
- Ingredion Inc.
- MANUS BIO
- Morita Kagaku Kogyo Co. Ltd.
- Nutraceutical Corp.
- Sunrise Nutrachem Group Co. Ltd.
- SweeGen Inc.
- Tate and Lyle PLC
- The Real Stevia Co. AB
- Van Wankum Ingredients BV
- Wisdom Natural Brands
- Zydus Lifesciences Ltd.
第13章 付録
Exhibits:
- Exhibits1: Executive Summary - Chart on Market Overview
- Exhibits2: Executive Summary - Data Table on Market Overview
- Exhibits3: Executive Summary - Chart on Global Market Characteristics
- Exhibits4: Executive Summary - Chart on Market By Geographical Landscape
- Exhibits5: Executive Summary - Chart on Market Segmentation by Application
- Exhibits6: Executive Summary - Chart on Market Segmentation by Type
- Exhibits7: Executive Summary - Chart on Incremental Growth
- Exhibits8: Executive Summary - Data Table on Incremental Growth
- Exhibits9: Executive Summary - Chart on Company Market Positioning
- Exhibits10: Parent Market
- Exhibits11: Data Table on - Parent Market
- Exhibits12: Market characteristics analysis
- Exhibits13: Value Chain Analysis
- Exhibits14: Offerings of companies included in the market definition
- Exhibits15: Market segments
- Exhibits16: Chart on Global - Market size and forecast 2023-2028 ($ million)
- Exhibits17: Data Table on Global - Market size and forecast 2023-2028 ($ million)
- Exhibits18: Chart on Global Market: Year-over-year growth 2023-2028 (%)
- Exhibits19: Data Table on Global Market: Year-over-year growth 2023-2028 (%)
- Exhibits20: Historic Market Size - Data Table on Global Stevia Market 2018 - 2022 ($ million)
- Exhibits21: Historic Market Size - Application Segment 2018 - 2022 ($ million)
- Exhibits22: Historic Market Size - Type Segment 2018 - 2022 ($ million)
- Exhibits23: Historic Market Size - Geography Segment 2018 - 2022 ($ million)
- Exhibits24: Historic Market Size - Country Segment 2018 - 2022 ($ million)
- Exhibits25: Five forces analysis - Comparison between 2023 and 2028
- Exhibits26: Bargaining power of buyers - Impact of key factors 2023 and 2028
- Exhibits27: Bargaining power of suppliers - Impact of key factors in 2023 and 2028
- Exhibits28: Threat of new entrants - Impact of key factors in 2023 and 2028
- Exhibits29: Threat of substitutes - Impact of key factors in 2023 and 2028
- Exhibits30: Threat of rivalry - Impact of key factors in 2023 and 2028
- Exhibits31: Chart on Market condition - Five forces 2023 and 2028
- Exhibits32: Chart on Application - Market share 2023-2028 (%)
- Exhibits33: Data Table on Application - Market share 2023-2028 (%)
- Exhibits34: Chart on Comparison by Application
- Exhibits35: Data Table on Comparison by Application
- Exhibits36: Chart on Beverage sector - Market size and forecast 2023-2028 ($ million)
- Exhibits37: Data Table on Beverage sector - Market size and forecast 2023-2028 ($ million)
- Exhibits38: Chart on Beverage sector - Year-over-year growth 2023-2028 (%)
- Exhibits39: Data Table on Beverage sector - Year-over-year growth 2023-2028 (%)
- Exhibits40: Chart on Food sector - Market size and forecast 2023-2028 ($ million)
- Exhibits41: Data Table on Food sector - Market size and forecast 2023-2028 ($ million)
- Exhibits42: Chart on Food sector - Year-over-year growth 2023-2028 (%)
- Exhibits43: Data Table on Food sector - Year-over-year growth 2023-2028 (%)
- Exhibits44: Chart on Pharmaceuticals and other - Market size and forecast 2023-2028 ($ million)
- Exhibits45: Data Table on Pharmaceuticals and other - Market size and forecast 2023-2028 ($ million)
- Exhibits46: Chart on Pharmaceuticals and other - Year-over-year growth 2023-2028 (%)
- Exhibits47: Data Table on Pharmaceuticals and other - Year-over-year growth 2023-2028 (%)
- Exhibits48: Market opportunity by Application ($ million)
- Exhibits49: Data Table on Market opportunity by Application ($ million)
- Exhibits50: Chart on Type - Market share 2023-2028 (%)
- Exhibits51: Data Table on Type - Market share 2023-2028 (%)
- Exhibits52: Chart on Comparison by Type
- Exhibits53: Data Table on Comparison by Type
- Exhibits54: Chart on Powder extract - Market size and forecast 2023-2028 ($ million)
- Exhibits55: Data Table on Powder extract - Market size and forecast 2023-2028 ($ million)
- Exhibits56: Chart on Powder extract - Year-over-year growth 2023-2028 (%)
- Exhibits57: Data Table on Powder extract - Year-over-year growth 2023-2028 (%)
- Exhibits58: Chart on Liquid extract - Market size and forecast 2023-2028 ($ million)
- Exhibits59: Data Table on Liquid extract - Market size and forecast 2023-2028 ($ million)
- Exhibits60: Chart on Liquid extract - Year-over-year growth 2023-2028 (%)
- Exhibits61: Data Table on Liquid extract - Year-over-year growth 2023-2028 (%)
- Exhibits62: Market opportunity by Type ($ million)
- Exhibits63: Data Table on Market opportunity by Type ($ million)
- Exhibits64: Analysis of price sensitivity, lifecycle, customer purchase basket, adoption rates, and purchase criteria
- Exhibits65: Chart on Market share By Geographical Landscape 2023-2028 (%)
- Exhibits66: Data Table on Market share By Geographical Landscape 2023-2028 (%)
- Exhibits67: Chart on Geographic comparison
- Exhibits68: Data Table on Geographic comparison
- Exhibits69: Chart on APAC - Market size and forecast 2023-2028 ($ million)
- Exhibits70: Data Table on APAC - Market size and forecast 2023-2028 ($ million)
- Exhibits71: Chart on APAC - Year-over-year growth 2023-2028 (%)
- Exhibits72: Data Table on APAC - Year-over-year growth 2023-2028 (%)
- Exhibits73: Chart on North America - Market size and forecast 2023-2028 ($ million)
- Exhibits74: Data Table on North America - Market size and forecast 2023-2028 ($ million)
- Exhibits75: Chart on North America - Year-over-year growth 2023-2028 (%)
- Exhibits76: Data Table on North America - Year-over-year growth 2023-2028 (%)
- Exhibits77: Chart on Europe - Market size and forecast 2023-2028 ($ million)
- Exhibits78: Data Table on Europe - Market size and forecast 2023-2028 ($ million)
- Exhibits79: Chart on Europe - Year-over-year growth 2023-2028 (%)
- Exhibits80: Data Table on Europe - Year-over-year growth 2023-2028 (%)
- Exhibits81: Chart on South America - Market size and forecast 2023-2028 ($ million)
- Exhibits82: Data Table on South America - Market size and forecast 2023-2028 ($ million)
- Exhibits83: Chart on South America - Year-over-year growth 2023-2028 (%)
- Exhibits84: Data Table on South America - Year-over-year growth 2023-2028 (%)
- Exhibits85: Chart on Middle East and Africa - Market size and forecast 2023-2028 ($ million)
- Exhibits86: Data Table on Middle East and Africa - Market size and forecast 2023-2028 ($ million)
- Exhibits87: Chart on Middle East and Africa - Year-over-year growth 2023-2028 (%)
- Exhibits88: Data Table on Middle East and Africa - Year-over-year growth 2023-2028 (%)
- Exhibits89: Chart on US - Market size and forecast 2023-2028 ($ million)
- Exhibits90: Data Table on US - Market size and forecast 2023-2028 ($ million)
- Exhibits91: Chart on US - Year-over-year growth 2023-2028 (%)
- Exhibits92: Data Table on US - Year-over-year growth 2023-2028 (%)
- Exhibits93: Chart on China - Market size and forecast 2023-2028 ($ million)
- Exhibits94: Data Table on China - Market size and forecast 2023-2028 ($ million)
- Exhibits95: Chart on China - Year-over-year growth 2023-2028 (%)
- Exhibits96: Data Table on China - Year-over-year growth 2023-2028 (%)
- Exhibits97: Chart on Japan - Market size and forecast 2023-2028 ($ million)
- Exhibits98: Data Table on Japan - Market size and forecast 2023-2028 ($ million)
- Exhibits99: Chart on Japan - Year-over-year growth 2023-2028 (%)
- Exhibits100: Data Table on Japan - Year-over-year growth 2023-2028 (%)
- Exhibits101: Chart on Spain - Market size and forecast 2023-2028 ($ million)
- Exhibits102: Data Table on Spain - Market size and forecast 2023-2028 ($ million)
- Exhibits103: Chart on Spain - Year-over-year growth 2023-2028 (%)
- Exhibits104: Data Table on Spain - Year-over-year growth 2023-2028 (%)
- Exhibits105: Chart on Germany - Market size and forecast 2023-2028 ($ million)
- Exhibits106: Data Table on Germany - Market size and forecast 2023-2028 ($ million)
- Exhibits107: Chart on Germany - Year-over-year growth 2023-2028 (%)
- Exhibits108: Data Table on Germany - Year-over-year growth 2023-2028 (%)
- Exhibits109: Market opportunity By Geographical Landscape ($ million)
- Exhibits110: Data Tables on Market opportunity By Geographical Landscape ($ million)
- Exhibits111: Impact of drivers and challenges in 2023 and 2028
- Exhibits112: Overview on criticality of inputs and factors of differentiation
- Exhibits113: Overview on factors of disruption
- Exhibits114: Impact of key risks on business
- Exhibits115: Companies covered
- Exhibits116: Matrix on companies position and classification
- Exhibits117: Archer Daniels Midland Co. - Overview
- Exhibits118: Archer Daniels Midland Co. - Business segments
- Exhibits119: Archer Daniels Midland Co. - Key news
- Exhibits120: Archer Daniels Midland Co. - Key offerings
- Exhibits121: Archer Daniels Midland Co. - Segment focus
- Exhibits122: Cargill Inc. - Overview
- Exhibits123: Cargill Inc. - Product / Service
- Exhibits124: Cargill Inc. - Key news
- Exhibits125: Cargill Inc. - Key offerings
- Exhibits126: Guilin Layn Natural Ingredients Corp. - Overview
- Exhibits127: Guilin Layn Natural Ingredients Corp. - Product / Service
- Exhibits128: Guilin Layn Natural Ingredients Corp. - Key offerings
- Exhibits129: HOWTIAN - Overview
- Exhibits130: HOWTIAN - Product / Service
- Exhibits131: HOWTIAN - Key offerings
- Exhibits132: Ingredion Inc. - Overview
- Exhibits133: Ingredion Inc. - Business segments
- Exhibits134: Ingredion Inc. - Key news
- Exhibits135: Ingredion Inc. - Key offerings
- Exhibits136: Ingredion Inc. - Segment focus
- Exhibits137: MANUS BIO - Overview
- Exhibits138: MANUS BIO - Product / Service
- Exhibits139: MANUS BIO - Key offerings
- Exhibits140: Morita Kagaku Kogyo Co. Ltd. - Overview
- Exhibits141: Morita Kagaku Kogyo Co. Ltd. - Product / Service
- Exhibits142: Morita Kagaku Kogyo Co. Ltd. - Key offerings
- Exhibits143: Nutraceutical Corp. - Overview
- Exhibits144: Nutraceutical Corp. - Product / Service
- Exhibits145: Nutraceutical Corp. - Key offerings
- Exhibits146: Sunrise Nutrachem Group Co. Ltd. - Overview
- Exhibits147: Sunrise Nutrachem Group Co. Ltd. - Product / Service
- Exhibits148: Sunrise Nutrachem Group Co. Ltd. - Key offerings
- Exhibits149: SweeGen Inc. - Overview
- Exhibits150: SweeGen Inc. - Product / Service
- Exhibits151: SweeGen Inc. - Key offerings
- Exhibits152: Tate and Lyle PLC - Overview
- Exhibits153: Tate and Lyle PLC - Business segments
- Exhibits154: Tate and Lyle PLC - Key news
- Exhibits155: Tate and Lyle PLC - Key offerings
- Exhibits156: Tate and Lyle PLC - Segment focus
- Exhibits157: The Real Stevia Co. AB - Overview
- Exhibits158: The Real Stevia Co. AB - Product / Service
- Exhibits159: The Real Stevia Co. AB - Key offerings
- Exhibits160: Van Wankum Ingredients BV - Overview
- Exhibits161: Van Wankum Ingredients BV - Product / Service
- Exhibits162: Van Wankum Ingredients BV - Key offerings
- Exhibits163: Wisdom Natural Brands - Overview
- Exhibits164: Wisdom Natural Brands - Product / Service
- Exhibits165: Wisdom Natural Brands - Key offerings
- Exhibits166: Zydus Lifesciences Ltd. - Overview
- Exhibits167: Zydus Lifesciences Ltd. - Business segments
- Exhibits168: Zydus Lifesciences Ltd. - Key news
- Exhibits169: Zydus Lifesciences Ltd. - Key offerings
- Exhibits170: Zydus Lifesciences Ltd. - Segment focus
- Exhibits171: Inclusions checklist
- Exhibits172: Exclusions checklist
- Exhibits173: Currency conversion rates for US$
- Exhibits174: Research methodology
- Exhibits175: Information sources
- Exhibits176: Data validation
- Exhibits177: Validation techniques employed for market sizing
- Exhibits178: Data synthesis
- Exhibits179: 360 degree market analysis
- Exhibits180: List of abbreviations
The stevia market is forecasted to grow by USD 310.2 mn during 2023-2028, accelerating at a CAGR of 8.08% during the forecast period. The report on the stevia market provides a holistic analysis, market size and forecast, trends, growth drivers, and challenges, as well as vendor analysis covering around 25 vendors.
The report offers an up-to-date analysis regarding the current market scenario, the latest trends and drivers, and the overall market environment. The market is driven by high demand for natural sweeteners, frequent stevia-based product launches, and rising m and a among players.
Technavio's stevia market is segmented as below:
| Market Scope | |
|---|---|
| Base Year | 2024 |
| End Year | 2028 |
| Series Year | 2024-2028 |
| Growth Momentum | Accelerate |
| YOY 2024 | 7.32% |
| CAGR | 8.08% |
| Incremental Value | $310.2 mn |
By Application
- Beverage sector
- Food sector
- Pharmaceuticals and other
By Type
- Powder extract
- Liquid extract
By Geographical Landscape
- APAC
- North America
- Europe
- South America
- Middle East and Africa
This study identifies the increased demand for stevia from nutraceutical industry as one of the prime reasons driving the stevia market growth during the next few years. Also, changing consumer preferences and increasing online penetration will lead to sizable demand in the market.
The report on the stevia market covers the following areas:
- Stevia market sizing
- Stevia market forecast
- Stevia market industry analysis
The robust vendor analysis is designed to help clients improve their market position, and in line with this, this report provides a detailed analysis of several leading stevia market vendors that include Archer Daniels Midland Co., Cargill Inc., Daepyung Co. Ltd., Fraken Biochem Co. Ltd., Guilin Layn Natural Ingredients Corp., HOWTIAN, Hunan Nutramax Inc., Ingredion Inc., MANUS BIO, Morita Kagaku Kogyo Co. Ltd., Nutraceutical Corp., S and W Seed Co., Sunrise Nutrachem Group Co. Ltd., Sunwin Stevia International Inc., SweeGen Inc., Tate and Lyle PLC, The Real Stevia Co. AB, Van Wankum Ingredients BV, Wisdom Natural Brands, and Zydus Lifesciences Ltd.. Also, the stevia market analysis report includes information on upcoming trends and challenges that will influence market growth. This is to help companies strategize and leverage all forthcoming growth opportunities.
The study was conducted using an objective combination of primary and secondary information including inputs from key participants in the industry. The report contains a comprehensive market and vendor landscape in addition to an analysis of the key vendors.
The publisher presents a detailed picture of the market by the way of study, synthesis, and summation of data from multiple sources by an analysis of key parameters such as profit, pricing, competition, and promotions. It presents various market facets by identifying the key industry influencers. The data presented is comprehensive, reliable, and a result of extensive research - both primary and secondary. The market research reports provide a complete competitive landscape and an in-depth vendor selection methodology and analysis using qualitative and quantitative research to forecast the accurate market growth.
Table of Contents
1 Executive Summary
- 1.1 Market overview
- Executive Summary - Chart on Market Overview
- Executive Summary - Data Table on Market Overview
- Executive Summary - Chart on Global Market Characteristics
- Executive Summary - Chart on Market By Geographical Landscape
- Executive Summary - Chart on Market Segmentation by Application
- Executive Summary - Chart on Market Segmentation by Type
- Executive Summary - Chart on Incremental Growth
- Executive Summary - Data Table on Incremental Growth
- Executive Summary - Chart on Company Market Positioning
2 Market Landscape
- 2.1 Market ecosystem
- Parent Market
- Data Table on - Parent Market
- 2.2 Market characteristics
- Market characteristics analysis
- 2.3 Value chain analysis
- Value Chain Analysis
3 Market Sizing
- 3.1 Market definition
- Offerings of companies included in the market definition
- 3.2 Market segment analysis
- Market segments
- 3.3 Market size 2023
- 3.4 Market outlook: Forecast for 2023-2028
- Chart on Global - Market size and forecast 2023-2028 ($ million)
- Data Table on Global - Market size and forecast 2023-2028 ($ million)
- Chart on Global Market: Year-over-year growth 2023-2028 (%)
- Data Table on Global Market: Year-over-year growth 2023-2028 (%)
4 Historic Market Size
- 4.1 Global Stevia Market 2018 - 2022
- Historic Market Size - Data Table on Global Stevia Market 2018 - 2022 ($ million)
- 4.2 Application segment analysis 2018 - 2022
- Historic Market Size - Application Segment 2018 - 2022 ($ million)
- 4.3 Type segment analysis 2018 - 2022
- Historic Market Size - Type Segment 2018 - 2022 ($ million)
- 4.4 Geography segment analysis 2018 - 2022
- Historic Market Size - Geography Segment 2018 - 2022 ($ million)
- 4.5 Country segment analysis 2018 - 2022
- Historic Market Size - Country Segment 2018 - 2022 ($ million)
5 Five Forces Analysis
- 5.1 Five forces summary
- Five forces analysis - Comparison between 2023 and 2028
- 5.2 Bargaining power of buyers
- Bargaining power of buyers - Impact of key factors 2023 and 2028
- 5.3 Bargaining power of suppliers
- Bargaining power of suppliers - Impact of key factors in 2023 and 2028
- 5.4 Threat of new entrants
- Threat of new entrants - Impact of key factors in 2023 and 2028
- 5.5 Threat of substitutes
- Threat of substitutes - Impact of key factors in 2023 and 2028
- 5.6 Threat of rivalry
- Threat of rivalry - Impact of key factors in 2023 and 2028
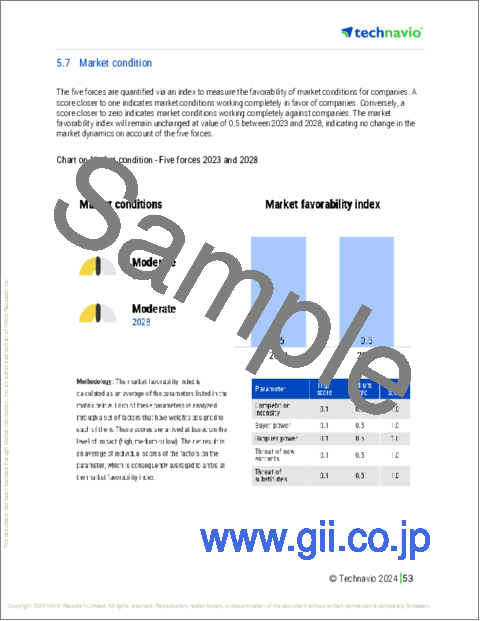
- 5.7 Market condition
- Chart on Market condition - Five forces 2023 and 2028
6 Market Segmentation by Application
- 6.1 Market segments
- Chart on Application - Market share 2023-2028 (%)
- Data Table on Application - Market share 2023-2028 (%)
- 6.2 Comparison by Application
- Chart on Comparison by Application
- Data Table on Comparison by Application
- 6.3 Beverage sector - Market size and forecast 2023-2028
- Chart on Beverage sector - Market size and forecast 2023-2028 ($ million)
- Data Table on Beverage sector - Market size and forecast 2023-2028 ($ million)
- Chart on Beverage sector - Year-over-year growth 2023-2028 (%)
- Data Table on Beverage sector - Year-over-year growth 2023-2028 (%)
- 6.4 Food sector - Market size and forecast 2023-2028
- Chart on Food sector - Market size and forecast 2023-2028 ($ million)
- Data Table on Food sector - Market size and forecast 2023-2028 ($ million)
- Chart on Food sector - Year-over-year growth 2023-2028 (%)
- Data Table on Food sector - Year-over-year growth 2023-2028 (%)
- 6.5 Pharmaceuticals and other - Market size and forecast 2023-2028
- Chart on Pharmaceuticals and other - Market size and forecast 2023-2028 ($ million)
- Data Table on Pharmaceuticals and other - Market size and forecast 2023-2028 ($ million)
- Chart on Pharmaceuticals and other - Year-over-year growth 2023-2028 (%)
- Data Table on Pharmaceuticals and other - Year-over-year growth 2023-2028 (%)
- 6.6 Market opportunity by Application
- Market opportunity by Application ($ million)
- Data Table on Market opportunity by Application ($ million)
7 Market Segmentation by Type
- 7.1 Market segments
- Chart on Type - Market share 2023-2028 (%)
- Data Table on Type - Market share 2023-2028 (%)
- 7.2 Comparison by Type
- Chart on Comparison by Type
- Data Table on Comparison by Type
- 7.3 Powder extract - Market size and forecast 2023-2028
- Chart on Powder extract - Market size and forecast 2023-2028 ($ million)
- Data Table on Powder extract - Market size and forecast 2023-2028 ($ million)
- Chart on Powder extract - Year-over-year growth 2023-2028 (%)
- Data Table on Powder extract - Year-over-year growth 2023-2028 (%)
- 7.4 Liquid extract - Market size and forecast 2023-2028
- Chart on Liquid extract - Market size and forecast 2023-2028 ($ million)
- Data Table on Liquid extract - Market size and forecast 2023-2028 ($ million)
- Chart on Liquid extract - Year-over-year growth 2023-2028 (%)
- Data Table on Liquid extract - Year-over-year growth 2023-2028 (%)
- 7.5 Market opportunity by Type
- Market opportunity by Type ($ million)
- Data Table on Market opportunity by Type ($ million)
8 Customer Landscape
- 8.1 Customer landscape overview
- Analysis of price sensitivity, lifecycle, customer purchase basket, adoption rates, and purchase criteria
9 Geographic Landscape
- 9.1 Geographic segmentation
- Chart on Market share By Geographical Landscape 2023-2028 (%)
- Data Table on Market share By Geographical Landscape 2023-2028 (%)
- 9.2 Geographic comparison
- Chart on Geographic comparison
- Data Table on Geographic comparison
- 9.3 APAC - Market size and forecast 2023-2028
- Chart on APAC - Market size and forecast 2023-2028 ($ million)
- Data Table on APAC - Market size and forecast 2023-2028 ($ million)
- Chart on APAC - Year-over-year growth 2023-2028 (%)
- Data Table on APAC - Year-over-year growth 2023-2028 (%)
- 9.4 North America - Market size and forecast 2023-2028
- Chart on North America - Market size and forecast 2023-2028 ($ million)
- Data Table on North America - Market size and forecast 2023-2028 ($ million)
- Chart on North America - Year-over-year growth 2023-2028 (%)
- Data Table on North America - Year-over-year growth 2023-2028 (%)
- 9.5 Europe - Market size and forecast 2023-2028
- Chart on Europe - Market size and forecast 2023-2028 ($ million)
- Data Table on Europe - Market size and forecast 2023-2028 ($ million)
- Chart on Europe - Year-over-year growth 2023-2028 (%)
- Data Table on Europe - Year-over-year growth 2023-2028 (%)
- 9.6 South America - Market size and forecast 2023-2028
- Chart on South America - Market size and forecast 2023-2028 ($ million)
- Data Table on South America - Market size and forecast 2023-2028 ($ million)
- Chart on South America - Year-over-year growth 2023-2028 (%)
- Data Table on South America - Year-over-year growth 2023-2028 (%)
- 9.7 Middle East and Africa - Market size and forecast 2023-2028
- Chart on Middle East and Africa - Market size and forecast 2023-2028 ($ million)
- Data Table on Middle East and Africa - Market size and forecast 2023-2028 ($ million)
- Chart on Middle East and Africa - Year-over-year growth 2023-2028 (%)
- Data Table on Middle East and Africa - Year-over-year growth 2023-2028 (%)
- 9.8 US - Market size and forecast 2023-2028
- Chart on US - Market size and forecast 2023-2028 ($ million)
- Data Table on US - Market size and forecast 2023-2028 ($ million)
- Chart on US - Year-over-year growth 2023-2028 (%)
- Data Table on US - Year-over-year growth 2023-2028 (%)
- 9.9 China - Market size and forecast 2023-2028
- Chart on China - Market size and forecast 2023-2028 ($ million)
- Data Table on China - Market size and forecast 2023-2028 ($ million)
- Chart on China - Year-over-year growth 2023-2028 (%)
- Data Table on China - Year-over-year growth 2023-2028 (%)
- 9.10 Japan - Market size and forecast 2023-2028
- Chart on Japan - Market size and forecast 2023-2028 ($ million)
- Data Table on Japan - Market size and forecast 2023-2028 ($ million)
- Chart on Japan - Year-over-year growth 2023-2028 (%)
- Data Table on Japan - Year-over-year growth 2023-2028 (%)
- 9.11 Spain - Market size and forecast 2023-2028
- Chart on Spain - Market size and forecast 2023-2028 ($ million)
- Data Table on Spain - Market size and forecast 2023-2028 ($ million)
- Chart on Spain - Year-over-year growth 2023-2028 (%)
- Data Table on Spain - Year-over-year growth 2023-2028 (%)
- 9.12 Germany - Market size and forecast 2023-2028
- Chart on Germany - Market size and forecast 2023-2028 ($ million)
- Data Table on Germany - Market size and forecast 2023-2028 ($ million)
- Chart on Germany - Year-over-year growth 2023-2028 (%)
- Data Table on Germany - Year-over-year growth 2023-2028 (%)
- 9.13 Market opportunity By Geographical Landscape
- Market opportunity By Geographical Landscape ($ million)
- Data Tables on Market opportunity By Geographical Landscape ($ million)
10 Drivers, Challenges, and Opportunity/Restraints
- 10.1 Market drivers
- 10.2 Market challenges
- 10.3 Impact of drivers and challenges
- Impact of drivers and challenges in 2023 and 2028
- 10.4 Market opportunities/restraints
11 Competitive Landscape
- 11.1 Overview
- 11.2 Competitive Landscape
- Overview on criticality of inputs and factors of differentiation
- 11.3 Landscape disruption
- Overview on factors of disruption
- 11.4 Industry risks
- Impact of key risks on business
12 Competitive Analysis
- 12.1 Companies profiled
- Companies covered
- 12.2 Market positioning of companies
- Matrix on companies position and classification
- 12.3 Archer Daniels Midland Co.
- Archer Daniels Midland Co. - Overview
- Archer Daniels Midland Co. - Business segments
- Archer Daniels Midland Co. - Key news
- Archer Daniels Midland Co. - Key offerings
- Archer Daniels Midland Co. - Segment focus
- 12.4 Cargill Inc.
- Cargill Inc. - Overview
- Cargill Inc. - Product / Service
- Cargill Inc. - Key news
- Cargill Inc. - Key offerings
- 12.5 Guilin Layn Natural Ingredients Corp.
- Guilin Layn Natural Ingredients Corp. - Overview
- Guilin Layn Natural Ingredients Corp. - Product / Service
- Guilin Layn Natural Ingredients Corp. - Key offerings
- 12.6 HOWTIAN
- HOWTIAN - Overview
- HOWTIAN - Product / Service
- HOWTIAN - Key offerings
- 12.7 Ingredion Inc.
- Ingredion Inc. - Overview
- Ingredion Inc. - Business segments
- Ingredion Inc. - Key news
- Ingredion Inc. - Key offerings
- Ingredion Inc. - Segment focus
- 12.8 MANUS BIO
- MANUS BIO - Overview
- MANUS BIO - Product / Service
- MANUS BIO - Key offerings
- 12.9 Morita Kagaku Kogyo Co. Ltd.
- Morita Kagaku Kogyo Co. Ltd. - Overview
- Morita Kagaku Kogyo Co. Ltd. - Product / Service
- Morita Kagaku Kogyo Co. Ltd. - Key offerings
- 12.10 Nutraceutical Corp.
- Nutraceutical Corp. - Overview
- Nutraceutical Corp. - Product / Service
- Nutraceutical Corp. - Key offerings
- 12.11 Sunrise Nutrachem Group Co. Ltd.
- Sunrise Nutrachem Group Co. Ltd. - Overview
- Sunrise Nutrachem Group Co. Ltd. - Product / Service
- Sunrise Nutrachem Group Co. Ltd. - Key offerings
- 12.12 SweeGen Inc.
- SweeGen Inc. - Overview
- SweeGen Inc. - Product / Service
- SweeGen Inc. - Key offerings
- 12.13 Tate and Lyle PLC
- Tate and Lyle PLC - Overview
- Tate and Lyle PLC - Business segments
- Tate and Lyle PLC - Key news
- Tate and Lyle PLC - Key offerings
- Tate and Lyle PLC - Segment focus
- 12.14 The Real Stevia Co. AB
- The Real Stevia Co. AB - Overview
- The Real Stevia Co. AB - Product / Service
- The Real Stevia Co. AB - Key offerings
- 12.15 Van Wankum Ingredients BV
- Van Wankum Ingredients BV - Overview
- Van Wankum Ingredients BV - Product / Service
- Van Wankum Ingredients BV - Key offerings
- 12.16 Wisdom Natural Brands
- Wisdom Natural Brands - Overview
- Wisdom Natural Brands - Product / Service
- Wisdom Natural Brands - Key offerings
- 12.17 Zydus Lifesciences Ltd.
- Zydus Lifesciences Ltd. - Overview
- Zydus Lifesciences Ltd. - Business segments
- Zydus Lifesciences Ltd. - Key news
- Zydus Lifesciences Ltd. - Key offerings
- Zydus Lifesciences Ltd. - Segment focus
13 Appendix
- 13.1 Scope of the report
- 13.2 Inclusions and exclusions checklist
- Inclusions checklist
- Exclusions checklist
- 13.3 Currency conversion rates for US$
- Currency conversion rates for US$
- 13.4 Research methodology
- Research methodology
- 13.5 Data procurement
- Information sources
- 13.6 Data validation
- Data validation
- 13.7 Validation techniques employed for market sizing
- Validation techniques employed for market sizing
- 13.8 Data synthesis
- Data synthesis
- 13.9 360 degree market analysis
- 360 degree market analysis
- 13.10 List of abbreviations
- List of abbreviations

