|
|
市場調査レポート
商品コード
1788407
ヴィーガンチーズの世界市場、2025年~2029年Global Vegan Cheese Market 2025-2029 |
||||||

|
|||||||
カスタマイズ可能
|
|||||||


| ヴィーガンチーズの世界市場、2025年~2029年 |
|
出版日: 2025年08月02日
発行: TechNavio
ページ情報: 英文 224 Pages
納期: 即納可能
|

全表示
- 概要
- 図表
- 目次
ヴィーガンチーズ市場は2024-2029年に15億7,070万米ドル、予測期間中のCAGRで9%の成長が予測されています。
当レポートでは、ヴィーガンチーズ市場の全体的な分析、市場規模・予測、動向、成長促進要因、課題、約25のベンダーを網羅したベンダー分析などを掲載しています。
現在の市場シナリオ、最新動向と促進要因、市場環境全体に関する最新分析を提供しています。市場は、組織化された店舗数の増加、乳糖不耐症に対する意識の高まり、動物愛護問題に対する意識の高まりによって牽引されています。
| 市場範囲 | |
|---|---|
| 基準年 | 2025 |
| 終了年 | 2029 |
| 予測期間 | 2025-2029 |
| 成長モメンタム | 加速 |
| 前年比 | 7.8% |
| CAGR | 9% |
| 増分額 | 15億7,070万米ドル |
本調査は、業界の主要参加者からのインプットを含め、一次情報と二次情報を客観的に組み合わせて実施しました。レポートには、主要企業の分析に加え、包括的な市場規模データ、地域別分析によるセグメント、ベンダー情勢が含まれています。レポートは過去データと予測データを掲載しています。
本調査では、今後数年間におけるヴィーガンチーズ市場の成長を促進する主な理由の一つとして、ヴィーガンチーズに対する需要の増加を挙げています。また、持続可能なパッケージングの出現や、革新的でプレミアムな製品の増加は、市場の大きな需要につながるでしょう。
目次
第1章 エグゼクティブサマリー
- 市場概要
第2章 Technavio分析
- 価格・ライフサイクル・顧客購入バスケット・採用率・購入基準の分析
- インプットの重要性と差別化の要因
- 混乱の要因
- 促進要因と課題の影響
第3章 市場情勢
- 市場エコシステム
- 市場の特徴
- バリューチェーン分析
第4章 市場規模
- 市場の定義
- 市場セグメント分析
- 市場規模 2024
- 市場の見通し 2024-2029
第5章 市場規模実績
- ヴィーガンチーズの世界市場 2019-2023
- 流通チャネル別セグメント分析 2019-2023
- 由来別セグメント分析 2019-2023
- 製品タイプ別セグメント分析 2019-2023
- 地域別セグメント分析 2019-2023
- 国別セグメント分析 2019-2023
第6章 定性分析
- AIの影響:ヴィーガンチーズの世界市場
第7章 ファイブフォース分析
- ファイブフォースの要約
- 買い手の交渉力
- 供給企業の交渉力
- 新規参入業者の脅威
- 代替品の脅威
- 競争の脅威
- 市況
第8章 市場セグメンテーション:流通チャネル別
- 市場セグメント
- 比較:流通チャネル別
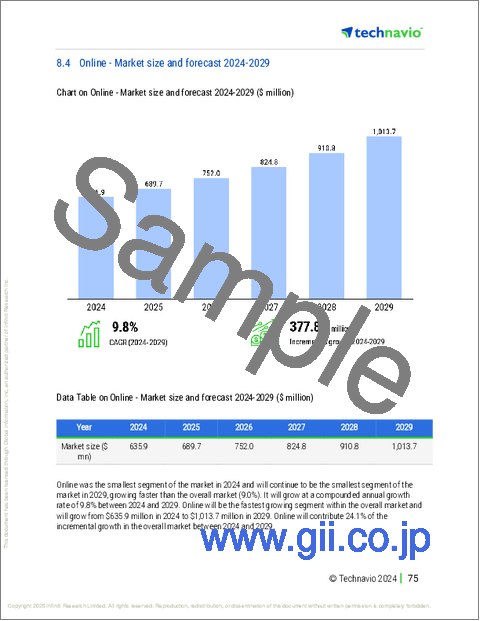
- オフライン:市場規模と予測 2024-2029
- オンライン:市場規模と予測 2024-2029
- 市場機会:流通チャネル別
第9章 市場セグメンテーション:由来別
- 市場セグメント
- 比較:由来別
- 豆乳:市場規模と予測 2024-2029
- アーモンドミルク:市場規模と予測 2024-2029
- ライスミルク:市場規模と予測 2024-2029
- その他:市場規模と予測 2024-2029
- 市場機会:由来別
第10章 市場セグメンテーション:製品タイプ別
- 市場セグメント
- 比較:製品タイプ別
- モッツァレラ:市場規模と予測 2024-2029
- チェダー:市場規模と予測 2024-2029
- クリームチーズ:市場規模と予測 2024-2029
- パルメザン:市場規模と予測 2024-2029
- リコッタ:市場規模と予測 2024-2029
- 市場機会:製品タイプ別
第11章 顧客情勢
- 顧客情勢の概要
第12章 地域別情勢
- 地域別セグメンテーション
- 地域別比較
- 欧州:市場規模と予測 2024-2029
- 北米:市場規模と予測 2024-2029
- アジア太平洋:市場規模と予測 2024-2029
- 南米:市場規模と予測 2024-2029
- 中東・アフリカ:市場規模と予測 2024-2029
- 米国:市場規模と予測 2024-2029
- ドイツ:市場規模と予測 2024-2029
- 英国:市場規模と予測 2024-2029
- カナダ:市場規模と予測 2024-2029
- フランス:市場規模と予測 2024-2029
- 中国:市場規模と予測 2024-2029
- イタリア:市場規模と予測 2024-2029
- インド:市場規模と予測 2024-2029
- スペイン:市場規模と予測 2024-2029
- ブラジル:市場規模と予測 2024-2029
- 市場機会:地域情勢別
第13章 促進要因・課題・機会・抑制要因
- 市場促進要因
- 市場の課題
- 促進要因と課題の影響
- 市場の機会・抑制要因
第14章 競合情勢
- 概要
- 競合情勢
- 混乱の状況
- 業界のリスク
第15章 競合分析
- 企業プロファイル
- 企業ランキング指数
- 企業の市場ポジショニング
- Chicago Vegan Foods
- Dairy Free Down Under
- First Grade International Ltd.
- Franklin Foods Inc.
- Good Carma
- Kite Hill
- Maple Leaf Foods Inc.
- Miyokos Creamery
- Nush foods
- Saputo Inc.
- Tofutti Brands Inc
- Treeline Cheese
- Upfield BV
- Urban Platter
- Vromage
第16章 付録
Exhibits:
- Exhibits1: Executive Summary - Chart on Market Overview
- Exhibits2: Executive Summary - Data Table on Market Overview
- Exhibits3: Executive Summary - Chart on Global Market Characteristics
- Exhibits4: Executive Summary - Chart on Market By Geographical Landscape
- Exhibits5: Executive Summary - Chart on Market Segmentation by Distribution Channel
- Exhibits6: Executive Summary - Chart on Market Segmentation by Source
- Exhibits7: Executive Summary - Chart on Market Segmentation by Product Type
- Exhibits8: Executive Summary - Chart on Incremental Growth
- Exhibits9: Executive Summary - Data Table on Incremental Growth
- Exhibits10: Executive Summary - Chart on Company Market Positioning
- Exhibits11: Analysis of price sensitivity, lifecycle, customer purchase basket, adoption rates, and purchase criteria
- Exhibits12: Overview on criticality of inputs and factors of differentiation
- Exhibits13: Overview on factors of disruption
- Exhibits14: Impact of drivers and challenges in 2024 and 2029
- Exhibits15: Parent Market
- Exhibits16: Data Table on - Parent Market
- Exhibits17: Market characteristics analysis
- Exhibits18: Value chain analysis
- Exhibits19: Offerings of companies included in the market definition
- Exhibits20: Market segments
- Exhibits21: Chart on Global - Market size and forecast 2024-2029 ($ million)
- Exhibits22: Data Table on Global - Market size and forecast 2024-2029 ($ million)
- Exhibits23: Chart on Global Market: Year-over-year growth 2024-2029 (%)
- Exhibits24: Data Table on Global Market: Year-over-year growth 2024-2029 (%)
- Exhibits25: Historic Market Size - Data Table on Global Vegan Cheese Market 2019 - 2023 ($ million)
- Exhibits26: Historic Market Size - Distribution Channel Segment 2019 - 2023 ($ million)
- Exhibits27: Historic Market Size - Source Segment 2019 - 2023 ($ million)
- Exhibits28: Historic Market Size - Product Type Segment 2019 - 2023 ($ million)
- Exhibits29: Historic Market Size - Geography Segment 2019 - 2023 ($ million)
- Exhibits30: Historic Market Size - Country Segment 2019 - 2023 ($ million)
- Exhibits31: Five forces analysis - Comparison between 2024 and 2029
- Exhibits32: Bargaining power of buyers - Impact of key factors 2024 and 2029
- Exhibits33: Bargaining power of suppliers - Impact of key factors in 2024 and 2029
- Exhibits34: Threat of new entrants - Impact of key factors in 2024 and 2029
- Exhibits35: Threat of substitutes - Impact of key factors in 2024 and 2029
- Exhibits36: Threat of rivalry - Impact of key factors in 2024 and 2029
- Exhibits37: Chart on Market condition - Five forces 2024 and 2029
- Exhibits38: Chart on Distribution Channel - Market share 2024-2029 (%)
- Exhibits39: Data Table on Distribution Channel - Market share 2024-2029 (%)
- Exhibits40: Chart on Comparison by Distribution Channel
- Exhibits41: Data Table on Comparison by Distribution Channel
- Exhibits42: Chart on Offline - Market size and forecast 2024-2029 ($ million)
- Exhibits43: Data Table on Offline - Market size and forecast 2024-2029 ($ million)
- Exhibits44: Chart on Offline - Year-over-year growth 2024-2029 (%)
- Exhibits45: Data Table on Offline - Year-over-year growth 2024-2029 (%)
- Exhibits46: Chart on Online - Market size and forecast 2024-2029 ($ million)
- Exhibits47: Data Table on Online - Market size and forecast 2024-2029 ($ million)
- Exhibits48: Chart on Online - Year-over-year growth 2024-2029 (%)
- Exhibits49: Data Table on Online - Year-over-year growth 2024-2029 (%)
- Exhibits50: Market opportunity by Distribution Channel ($ million)
- Exhibits51: Data Table on Market opportunity by Distribution Channel ($ million)
- Exhibits52: Chart on Source - Market share 2024-2029 (%)
- Exhibits53: Data Table on Source - Market share 2024-2029 (%)
- Exhibits54: Chart on Comparison by Source
- Exhibits55: Data Table on Comparison by Source
- Exhibits56: Chart on Soy milk - Market size and forecast 2024-2029 ($ million)
- Exhibits57: Data Table on Soy milk - Market size and forecast 2024-2029 ($ million)
- Exhibits58: Chart on Soy milk - Year-over-year growth 2024-2029 (%)
- Exhibits59: Data Table on Soy milk - Year-over-year growth 2024-2029 (%)
- Exhibits60: Chart on Almond milk - Market size and forecast 2024-2029 ($ million)
- Exhibits61: Data Table on Almond milk - Market size and forecast 2024-2029 ($ million)
- Exhibits62: Chart on Almond milk - Year-over-year growth 2024-2029 (%)
- Exhibits63: Data Table on Almond milk - Year-over-year growth 2024-2029 (%)
- Exhibits64: Chart on Rice milk - Market size and forecast 2024-2029 ($ million)
- Exhibits65: Data Table on Rice milk - Market size and forecast 2024-2029 ($ million)
- Exhibits66: Chart on Rice milk - Year-over-year growth 2024-2029 (%)
- Exhibits67: Data Table on Rice milk - Year-over-year growth 2024-2029 (%)
- Exhibits68: Chart on Others - Market size and forecast 2024-2029 ($ million)
- Exhibits69: Data Table on Others - Market size and forecast 2024-2029 ($ million)
- Exhibits70: Chart on Others - Year-over-year growth 2024-2029 (%)
- Exhibits71: Data Table on Others - Year-over-year growth 2024-2029 (%)
- Exhibits72: Market opportunity by Source ($ million)
- Exhibits73: Data Table on Market opportunity by Source ($ million)
- Exhibits74: Chart on Product Type - Market share 2024-2029 (%)
- Exhibits75: Data Table on Product Type - Market share 2024-2029 (%)
- Exhibits76: Chart on Comparison by Product Type
- Exhibits77: Data Table on Comparison by Product Type
- Exhibits78: Chart on Mozzarella - Market size and forecast 2024-2029 ($ million)
- Exhibits79: Data Table on Mozzarella - Market size and forecast 2024-2029 ($ million)
- Exhibits80: Chart on Mozzarella - Year-over-year growth 2024-2029 (%)
- Exhibits81: Data Table on Mozzarella - Year-over-year growth 2024-2029 (%)
- Exhibits82: Chart on Cheddar - Market size and forecast 2024-2029 ($ million)
- Exhibits83: Data Table on Cheddar - Market size and forecast 2024-2029 ($ million)
- Exhibits84: Chart on Cheddar - Year-over-year growth 2024-2029 (%)
- Exhibits85: Data Table on Cheddar - Year-over-year growth 2024-2029 (%)
- Exhibits86: Chart on Cream cheese - Market size and forecast 2024-2029 ($ million)
- Exhibits87: Data Table on Cream cheese - Market size and forecast 2024-2029 ($ million)
- Exhibits88: Chart on Cream cheese - Year-over-year growth 2024-2029 (%)
- Exhibits89: Data Table on Cream cheese - Year-over-year growth 2024-2029 (%)
- Exhibits90: Chart on Parmesan - Market size and forecast 2024-2029 ($ million)
- Exhibits91: Data Table on Parmesan - Market size and forecast 2024-2029 ($ million)
- Exhibits92: Chart on Parmesan - Year-over-year growth 2024-2029 (%)
- Exhibits93: Data Table on Parmesan - Year-over-year growth 2024-2029 (%)
- Exhibits94: Chart on Ricotta - Market size and forecast 2024-2029 ($ million)
- Exhibits95: Data Table on Ricotta - Market size and forecast 2024-2029 ($ million)
- Exhibits96: Chart on Ricotta - Year-over-year growth 2024-2029 (%)
- Exhibits97: Data Table on Ricotta - Year-over-year growth 2024-2029 (%)
- Exhibits98: Market opportunity by Product Type ($ million)
- Exhibits99: Data Table on Market opportunity by Product Type ($ million)
- Exhibits100: Analysis of price sensitivity, lifecycle, customer purchase basket, adoption rates, and purchase criteria
- Exhibits101: Chart on Market share By Geographical Landscape 2024-2029 (%)
- Exhibits102: Data Table on Market share By Geographical Landscape 2024-2029 (%)
- Exhibits103: Chart on Geographic comparison
- Exhibits104: Data Table on Geographic comparison
- Exhibits105: Chart on Europe - Market size and forecast 2024-2029 ($ million)
- Exhibits106: Data Table on Europe - Market size and forecast 2024-2029 ($ million)
- Exhibits107: Chart on Europe - Year-over-year growth 2024-2029 (%)
- Exhibits108: Data Table on Europe - Year-over-year growth 2024-2029 (%)
- Exhibits109: Chart on North America - Market size and forecast 2024-2029 ($ million)
- Exhibits110: Data Table on North America - Market size and forecast 2024-2029 ($ million)
- Exhibits111: Chart on North America - Year-over-year growth 2024-2029 (%)
- Exhibits112: Data Table on North America - Year-over-year growth 2024-2029 (%)
- Exhibits113: Chart on APAC - Market size and forecast 2024-2029 ($ million)
- Exhibits114: Data Table on APAC - Market size and forecast 2024-2029 ($ million)
- Exhibits115: Chart on APAC - Year-over-year growth 2024-2029 (%)
- Exhibits116: Data Table on APAC - Year-over-year growth 2024-2029 (%)
- Exhibits117: Chart on South America - Market size and forecast 2024-2029 ($ million)
- Exhibits118: Data Table on South America - Market size and forecast 2024-2029 ($ million)
- Exhibits119: Chart on South America - Year-over-year growth 2024-2029 (%)
- Exhibits120: Data Table on South America - Year-over-year growth 2024-2029 (%)
- Exhibits121: Chart on Middle East and Africa - Market size and forecast 2024-2029 ($ million)
- Exhibits122: Data Table on Middle East and Africa - Market size and forecast 2024-2029 ($ million)
- Exhibits123: Chart on Middle East and Africa - Year-over-year growth 2024-2029 (%)
- Exhibits124: Data Table on Middle East and Africa - Year-over-year growth 2024-2029 (%)
- Exhibits125: Chart on US - Market size and forecast 2024-2029 ($ million)
- Exhibits126: Data Table on US - Market size and forecast 2024-2029 ($ million)
- Exhibits127: Chart on US - Year-over-year growth 2024-2029 (%)
- Exhibits128: Data Table on US - Year-over-year growth 2024-2029 (%)
- Exhibits129: Chart on Germany - Market size and forecast 2024-2029 ($ million)
- Exhibits130: Data Table on Germany - Market size and forecast 2024-2029 ($ million)
- Exhibits131: Chart on Germany - Year-over-year growth 2024-2029 (%)
- Exhibits132: Data Table on Germany - Year-over-year growth 2024-2029 (%)
- Exhibits133: Chart on UK - Market size and forecast 2024-2029 ($ million)
- Exhibits134: Data Table on UK - Market size and forecast 2024-2029 ($ million)
- Exhibits135: Chart on UK - Year-over-year growth 2024-2029 (%)
- Exhibits136: Data Table on UK - Year-over-year growth 2024-2029 (%)
- Exhibits137: Chart on Canada - Market size and forecast 2024-2029 ($ million)
- Exhibits138: Data Table on Canada - Market size and forecast 2024-2029 ($ million)
- Exhibits139: Chart on Canada - Year-over-year growth 2024-2029 (%)
- Exhibits140: Data Table on Canada - Year-over-year growth 2024-2029 (%)
- Exhibits141: Chart on France - Market size and forecast 2024-2029 ($ million)
- Exhibits142: Data Table on France - Market size and forecast 2024-2029 ($ million)
- Exhibits143: Chart on France - Year-over-year growth 2024-2029 (%)
- Exhibits144: Data Table on France - Year-over-year growth 2024-2029 (%)
- Exhibits145: Chart on China - Market size and forecast 2024-2029 ($ million)
- Exhibits146: Data Table on China - Market size and forecast 2024-2029 ($ million)
- Exhibits147: Chart on China - Year-over-year growth 2024-2029 (%)
- Exhibits148: Data Table on China - Year-over-year growth 2024-2029 (%)
- Exhibits149: Chart on Italy - Market size and forecast 2024-2029 ($ million)
- Exhibits150: Data Table on Italy - Market size and forecast 2024-2029 ($ million)
- Exhibits151: Chart on Italy - Year-over-year growth 2024-2029 (%)
- Exhibits152: Data Table on Italy - Year-over-year growth 2024-2029 (%)
- Exhibits153: Chart on India - Market size and forecast 2024-2029 ($ million)
- Exhibits154: Data Table on India - Market size and forecast 2024-2029 ($ million)
- Exhibits155: Chart on India - Year-over-year growth 2024-2029 (%)
- Exhibits156: Data Table on India - Year-over-year growth 2024-2029 (%)
- Exhibits157: Chart on Spain - Market size and forecast 2024-2029 ($ million)
- Exhibits158: Data Table on Spain - Market size and forecast 2024-2029 ($ million)
- Exhibits159: Chart on Spain - Year-over-year growth 2024-2029 (%)
- Exhibits160: Data Table on Spain - Year-over-year growth 2024-2029 (%)
- Exhibits161: Chart on Brazil - Market size and forecast 2024-2029 ($ million)
- Exhibits162: Data Table on Brazil - Market size and forecast 2024-2029 ($ million)
- Exhibits163: Chart on Brazil - Year-over-year growth 2024-2029 (%)
- Exhibits164: Data Table on Brazil - Year-over-year growth 2024-2029 (%)
- Exhibits165: Market opportunity By Geographical Landscape ($ million)
- Exhibits166: Data Tables on Market opportunity By Geographical Landscape ($ million)
- Exhibits167: Impact of drivers and challenges in 2024 and 2029
- Exhibits168: Overview on criticality of inputs and factors of differentiation
- Exhibits169: Overview on factors of disruption
- Exhibits170: Impact of key risks on business
- Exhibits171: Companies covered
- Exhibits172: Company ranking index
- Exhibits173: Matrix on companies position and classification
- Exhibits174: Chicago Vegan Foods - Overview
- Exhibits175: Chicago Vegan Foods - Product / Service
- Exhibits176: Chicago Vegan Foods - Key offerings
- Exhibits177: SWOT
- Exhibits178: Dairy Free Down Under - Overview
- Exhibits179: Dairy Free Down Under - Product / Service
- Exhibits180: Dairy Free Down Under - Key offerings
- Exhibits181: SWOT
- Exhibits182: First Grade International Ltd. - Overview
- Exhibits183: First Grade International Ltd. - Product / Service
- Exhibits184: First Grade International Ltd. - Key offerings
- Exhibits185: SWOT
- Exhibits186: Franklin Foods Inc. - Overview
- Exhibits187: Franklin Foods Inc. - Product / Service
- Exhibits188: Franklin Foods Inc. - Key offerings
- Exhibits189: SWOT
- Exhibits190: Good Carma - Overview
- Exhibits191: Good Carma - Product / Service
- Exhibits192: Good Carma - Key offerings
- Exhibits193: SWOT
- Exhibits194: Kite Hill - Overview
- Exhibits195: Kite Hill - Product / Service
- Exhibits196: Kite Hill - Key offerings
- Exhibits197: SWOT
- Exhibits198: Maple Leaf Foods Inc. - Overview
- Exhibits199: Maple Leaf Foods Inc. - Business segments
- Exhibits200: Maple Leaf Foods Inc. - Key offerings
- Exhibits201: Maple Leaf Foods Inc. - Segment focus
- Exhibits202: SWOT
- Exhibits203: Miyokos Creamery - Overview
- Exhibits204: Miyokos Creamery - Product / Service
- Exhibits205: Miyokos Creamery - Key offerings
- Exhibits206: SWOT
- Exhibits207: Nush foods - Overview
- Exhibits208: Nush foods - Product / Service
- Exhibits209: Nush foods - Key offerings
- Exhibits210: SWOT
- Exhibits211: Saputo Inc. - Overview
- Exhibits212: Saputo Inc. - Business segments
- Exhibits213: Saputo Inc. - Key offerings
- Exhibits214: Saputo Inc. - Segment focus
- Exhibits215: SWOT
- Exhibits216: Tofutti Brands Inc - Overview
- Exhibits217: Tofutti Brands Inc - Product / Service
- Exhibits218: Tofutti Brands Inc - Key offerings
- Exhibits219: SWOT
- Exhibits220: Treeline Cheese - Overview
- Exhibits221: Treeline Cheese - Product / Service
- Exhibits222: Treeline Cheese - Key offerings
- Exhibits223: SWOT
- Exhibits224: Upfield BV - Overview
- Exhibits225: Upfield BV - Product / Service
- Exhibits226: Upfield BV - Key offerings
- Exhibits227: SWOT
- Exhibits228: Urban Platter - Overview
- Exhibits229: Urban Platter - Product / Service
- Exhibits230: Urban Platter - Key offerings
- Exhibits231: SWOT
- Exhibits232: Vromage - Overview
- Exhibits233: Vromage - Product / Service
- Exhibits234: Vromage - Key offerings
- Exhibits235: SWOT
- Exhibits236: Inclusions checklist
- Exhibits237: Exclusions checklist
- Exhibits238: Currency conversion rates for US$
- Exhibits239: Research methodology
- Exhibits240: Information sources
- Exhibits241: Data validation
- Exhibits242: Validation techniques employed for market sizing
- Exhibits243: Data synthesis
- Exhibits244: 360 degree market analysis
- Exhibits245: List of abbreviations
The vegan cheese market is forecasted to grow by USD 1,570.7 mn during 2024-2029, accelerating at a CAGR of 9% during the forecast period. The report on the vegan cheese market provides a holistic analysis, market size and forecast, trends, growth drivers, and challenges, as well as vendor analysis covering around 25 vendors.
The report offers an up-to-date analysis regarding the current market scenario, the latest trends and drivers, and the overall market environment. The market is driven by increasing number of organized outlets, increasing awareness of lactose intolerance conditions, and growing awareness of animal welfare issues.
| Market Scope | |
|---|---|
| Base Year | 2025 |
| End Year | 2029 |
| Series Year | 2025-2029 |
| Growth Momentum | Accelerate |
| YOY 2025 | 7.8% |
| CAGR | 9% |
| Incremental Value | $1,570.7 mn |
The study was conducted using an objective combination of primary and secondary information including inputs from key participants in the industry. The report contains a comprehensive market size data, segment with regional analysis and vendor landscape in addition to an analysis of the key companies. Reports have historic and forecast data.
Technavio's vegan cheese market is segmented as below:
By Distribution Channel
- Offline
- Online
By Source
- Soy milk
- Almond milk
- Rice milk
- Others
By Product Type
- Mozzarella
- Cheddar
- Cream cheese
- Parmesan
- Ricotta
By Geographical Landscape
- Europe
- North America
- APAC
- South America
- Middle East and Africa
This study identifies the increasing demand for vegan cheese as one of the prime reasons driving the vegan cheese market growth during the next few years. Also, emergence of sustainable packaging and growing innovative and premium products will lead to sizable demand in the market.
The report on the vegan cheese market covers the following areas:
- Vegan Cheese Market sizing
- Vegan Cheese Market forecast
- Vegan Cheese Market industry analysis
The robust vendor analysis is designed to help clients improve their market position, and in line with this, this report provides a detailed analysis of several leading vegan cheese market vendors that include Chicago Vegan Foods, Dairy Free Down Under, Danone SA, First Grade International Ltd., Franklin Foods Inc., Good Carma, I AM NUT OK, Kite Hill, Maple Leaf Foods Inc., Miyokos Creamery, Nush foods, Parmela Creamery, Saputo Inc., Tofutti Brands Inc., Treeline Cheese, Tyne Chease Ltd., Upfield BV, Urban Platter, and Vromage. Also, the vegan cheese market analysis report includes information on upcoming trends and challenges that will influence market growth. This is to help companies strategize and leverage all forthcoming growth opportunities.
The publisher presents a detailed picture of the market by the way of study, synthesis, and summation of data from multiple sources by an analysis of key parameters such as profit, pricing, competition, and promotions. It presents various market facets by identifying the key industry influencers. The data presented is comprehensive, reliable, and a result of extensive primary and secondary research. The market research reports provide a complete competitive landscape and an in-depth vendor selection methodology and analysis using qualitative and quantitative research to forecast accurate market growth.
Table of Contents
1 Executive Summary
- 1.1 Market overview
- Executive Summary - Chart on Market Overview
- Executive Summary - Data Table on Market Overview
- Executive Summary - Chart on Global Market Characteristics
- Executive Summary - Chart on Market By Geographical Landscape
- Executive Summary - Chart on Market Segmentation by Distribution Channel
- Executive Summary - Chart on Market Segmentation by Source
- Executive Summary - Chart on Market Segmentation by Product Type
- Executive Summary - Chart on Incremental Growth
- Executive Summary - Data Table on Incremental Growth
- Executive Summary - Chart on Company Market Positioning
2 Technavio Analysis
- 2.1 Analysis of price sensitivity, lifecycle, customer purchase basket, adoption rates, and purchase criteria
- Analysis of price sensitivity, lifecycle, customer purchase basket, adoption rates, and purchase criteria
- 2.2 Criticality of inputs and Factors of differentiation
- Overview on criticality of inputs and factors of differentiation
- 2.3 Factors of disruption
- Overview on factors of disruption
- 2.4 Impact of drivers and challenges
- Impact of drivers and challenges in 2024 and 2029
3 Market Landscape
- 3.1 Market ecosystem
- Parent Market
- Data Table on - Parent Market
- 3.2 Market characteristics
- Market characteristics analysis
- 3.3 Value chain analysis
- Value chain analysis
4 Market Sizing
- 4.1 Market definition
- Offerings of companies included in the market definition
- 4.2 Market segment analysis
- Market segments
- 4.3 Market size 2024
- 4.4 Market outlook: Forecast for 2024-2029
- Chart on Global - Market size and forecast 2024-2029 ($ million)
- Data Table on Global - Market size and forecast 2024-2029 ($ million)
- Chart on Global Market: Year-over-year growth 2024-2029 (%)
- Data Table on Global Market: Year-over-year growth 2024-2029 (%)
5 Historic Market Size
- 5.1 Global Vegan Cheese Market 2019 - 2023
- Historic Market Size - Data Table on Global Vegan Cheese Market 2019 - 2023 ($ million)
- 5.2 Distribution Channel segment analysis 2019 - 2023
- Historic Market Size - Distribution Channel Segment 2019 - 2023 ($ million)
- 5.3 Source segment analysis 2019 - 2023
- Historic Market Size - Source Segment 2019 - 2023 ($ million)
- 5.4 Product Type segment analysis 2019 - 2023
- Historic Market Size - Product Type Segment 2019 - 2023 ($ million)
- 5.5 Geography segment analysis 2019 - 2023
- Historic Market Size - Geography Segment 2019 - 2023 ($ million)
- 5.6 Country segment analysis 2019 - 2023
- Historic Market Size - Country Segment 2019 - 2023 ($ million)
6 Qualitative Analysis
- 6.1 The AI impact on Global Vegan Cheese Market
7 Five Forces Analysis
- 7.1 Five forces summary
- Five forces analysis - Comparison between 2024 and 2029
- 7.2 Bargaining power of buyers
- Bargaining power of buyers - Impact of key factors 2024 and 2029
- 7.3 Bargaining power of suppliers
- Bargaining power of suppliers - Impact of key factors in 2024 and 2029
- 7.4 Threat of new entrants
- Threat of new entrants - Impact of key factors in 2024 and 2029
- 7.5 Threat of substitutes
- Threat of substitutes - Impact of key factors in 2024 and 2029
- 7.6 Threat of rivalry
- Threat of rivalry - Impact of key factors in 2024 and 2029
- 7.7 Market condition
- Chart on Market condition - Five forces 2024 and 2029
8 Market Segmentation by Distribution Channel
- 8.1 Market segments
- Chart on Distribution Channel - Market share 2024-2029 (%)
- Data Table on Distribution Channel - Market share 2024-2029 (%)
- 8.2 Comparison by Distribution Channel
- Chart on Comparison by Distribution Channel
- Data Table on Comparison by Distribution Channel
- 8.3 Offline - Market size and forecast 2024-2029
- Chart on Offline - Market size and forecast 2024-2029 ($ million)
- Data Table on Offline - Market size and forecast 2024-2029 ($ million)
- Chart on Offline - Year-over-year growth 2024-2029 (%)
- Data Table on Offline - Year-over-year growth 2024-2029 (%)
- 8.4 Online - Market size and forecast 2024-2029
- Chart on Online - Market size and forecast 2024-2029 ($ million)
- Data Table on Online - Market size and forecast 2024-2029 ($ million)
- Chart on Online - Year-over-year growth 2024-2029 (%)
- Data Table on Online - Year-over-year growth 2024-2029 (%)
- 8.5 Market opportunity by Distribution Channel
- Market opportunity by Distribution Channel ($ million)
- Data Table on Market opportunity by Distribution Channel ($ million)
9 Market Segmentation by Source
- 9.1 Market segments
- Chart on Source - Market share 2024-2029 (%)
- Data Table on Source - Market share 2024-2029 (%)
- 9.2 Comparison by Source
- Chart on Comparison by Source
- Data Table on Comparison by Source
- 9.3 Soy milk - Market size and forecast 2024-2029
- Chart on Soy milk - Market size and forecast 2024-2029 ($ million)
- Data Table on Soy milk - Market size and forecast 2024-2029 ($ million)
- Chart on Soy milk - Year-over-year growth 2024-2029 (%)
- Data Table on Soy milk - Year-over-year growth 2024-2029 (%)
- 9.4 Almond milk - Market size and forecast 2024-2029
- Chart on Almond milk - Market size and forecast 2024-2029 ($ million)
- Data Table on Almond milk - Market size and forecast 2024-2029 ($ million)
- Chart on Almond milk - Year-over-year growth 2024-2029 (%)
- Data Table on Almond milk - Year-over-year growth 2024-2029 (%)
- 9.5 Rice milk - Market size and forecast 2024-2029
- Chart on Rice milk - Market size and forecast 2024-2029 ($ million)
- Data Table on Rice milk - Market size and forecast 2024-2029 ($ million)
- Chart on Rice milk - Year-over-year growth 2024-2029 (%)
- Data Table on Rice milk - Year-over-year growth 2024-2029 (%)
- 9.6 Others - Market size and forecast 2024-2029
- Chart on Others - Market size and forecast 2024-2029 ($ million)
- Data Table on Others - Market size and forecast 2024-2029 ($ million)
- Chart on Others - Year-over-year growth 2024-2029 (%)
- Data Table on Others - Year-over-year growth 2024-2029 (%)
- 9.7 Market opportunity by Source
- Market opportunity by Source ($ million)
- Data Table on Market opportunity by Source ($ million)
10 Market Segmentation by Product Type
- 10.1 Market segments
- Chart on Product Type - Market share 2024-2029 (%)
- Data Table on Product Type - Market share 2024-2029 (%)
- 10.2 Comparison by Product Type
- Chart on Comparison by Product Type
- Data Table on Comparison by Product Type
- 10.3 Mozzarella - Market size and forecast 2024-2029
- Chart on Mozzarella - Market size and forecast 2024-2029 ($ million)
- Data Table on Mozzarella - Market size and forecast 2024-2029 ($ million)
- Chart on Mozzarella - Year-over-year growth 2024-2029 (%)
- Data Table on Mozzarella - Year-over-year growth 2024-2029 (%)
- 10.4 Cheddar - Market size and forecast 2024-2029
- Chart on Cheddar - Market size and forecast 2024-2029 ($ million)
- Data Table on Cheddar - Market size and forecast 2024-2029 ($ million)
- Chart on Cheddar - Year-over-year growth 2024-2029 (%)
- Data Table on Cheddar - Year-over-year growth 2024-2029 (%)
- 10.5 Cream cheese - Market size and forecast 2024-2029
- Chart on Cream cheese - Market size and forecast 2024-2029 ($ million)
- Data Table on Cream cheese - Market size and forecast 2024-2029 ($ million)
- Chart on Cream cheese - Year-over-year growth 2024-2029 (%)
- Data Table on Cream cheese - Year-over-year growth 2024-2029 (%)
- 10.6 Parmesan - Market size and forecast 2024-2029
- Chart on Parmesan - Market size and forecast 2024-2029 ($ million)
- Data Table on Parmesan - Market size and forecast 2024-2029 ($ million)
- Chart on Parmesan - Year-over-year growth 2024-2029 (%)
- Data Table on Parmesan - Year-over-year growth 2024-2029 (%)
- 10.7 Ricotta - Market size and forecast 2024-2029
- Chart on Ricotta - Market size and forecast 2024-2029 ($ million)
- Data Table on Ricotta - Market size and forecast 2024-2029 ($ million)
- Chart on Ricotta - Year-over-year growth 2024-2029 (%)
- Data Table on Ricotta - Year-over-year growth 2024-2029 (%)
- 10.8 Market opportunity by Product Type
- Market opportunity by Product Type ($ million)
- Data Table on Market opportunity by Product Type ($ million)
11 Customer Landscape
- 11.1 Customer landscape overview
- Analysis of price sensitivity, lifecycle, customer purchase basket, adoption rates, and purchase criteria
12 Geographic Landscape
- 12.1 Geographic segmentation
- Chart on Market share By Geographical Landscape 2024-2029 (%)
- Data Table on Market share By Geographical Landscape 2024-2029 (%)
- 12.2 Geographic comparison
- Chart on Geographic comparison
- Data Table on Geographic comparison
- 12.3 Europe - Market size and forecast 2024-2029
- Chart on Europe - Market size and forecast 2024-2029 ($ million)
- Data Table on Europe - Market size and forecast 2024-2029 ($ million)
- Chart on Europe - Year-over-year growth 2024-2029 (%)
- Data Table on Europe - Year-over-year growth 2024-2029 (%)
- 12.4 North America - Market size and forecast 2024-2029
- Chart on North America - Market size and forecast 2024-2029 ($ million)
- Data Table on North America - Market size and forecast 2024-2029 ($ million)
- Chart on North America - Year-over-year growth 2024-2029 (%)
- Data Table on North America - Year-over-year growth 2024-2029 (%)
- 12.5 APAC - Market size and forecast 2024-2029
- Chart on APAC - Market size and forecast 2024-2029 ($ million)
- Data Table on APAC - Market size and forecast 2024-2029 ($ million)
- Chart on APAC - Year-over-year growth 2024-2029 (%)
- Data Table on APAC - Year-over-year growth 2024-2029 (%)
- 12.6 South America - Market size and forecast 2024-2029
- Chart on South America - Market size and forecast 2024-2029 ($ million)
- Data Table on South America - Market size and forecast 2024-2029 ($ million)
- Chart on South America - Year-over-year growth 2024-2029 (%)
- Data Table on South America - Year-over-year growth 2024-2029 (%)
- 12.7 Middle East and Africa - Market size and forecast 2024-2029
- Chart on Middle East and Africa - Market size and forecast 2024-2029 ($ million)
- Data Table on Middle East and Africa - Market size and forecast 2024-2029 ($ million)
- Chart on Middle East and Africa - Year-over-year growth 2024-2029 (%)
- Data Table on Middle East and Africa - Year-over-year growth 2024-2029 (%)
- 12.8 US - Market size and forecast 2024-2029
- Chart on US - Market size and forecast 2024-2029 ($ million)
- Data Table on US - Market size and forecast 2024-2029 ($ million)
- Chart on US - Year-over-year growth 2024-2029 (%)
- Data Table on US - Year-over-year growth 2024-2029 (%)
- 12.9 Germany - Market size and forecast 2024-2029
- Chart on Germany - Market size and forecast 2024-2029 ($ million)
- Data Table on Germany - Market size and forecast 2024-2029 ($ million)
- Chart on Germany - Year-over-year growth 2024-2029 (%)
- Data Table on Germany - Year-over-year growth 2024-2029 (%)
- 12.10 UK - Market size and forecast 2024-2029
- Chart on UK - Market size and forecast 2024-2029 ($ million)
- Data Table on UK - Market size and forecast 2024-2029 ($ million)
- Chart on UK - Year-over-year growth 2024-2029 (%)
- Data Table on UK - Year-over-year growth 2024-2029 (%)
- 12.11 Canada - Market size and forecast 2024-2029
- Chart on Canada - Market size and forecast 2024-2029 ($ million)
- Data Table on Canada - Market size and forecast 2024-2029 ($ million)
- Chart on Canada - Year-over-year growth 2024-2029 (%)
- Data Table on Canada - Year-over-year growth 2024-2029 (%)
- 12.12 France - Market size and forecast 2024-2029
- Chart on France - Market size and forecast 2024-2029 ($ million)
- Data Table on France - Market size and forecast 2024-2029 ($ million)
- Chart on France - Year-over-year growth 2024-2029 (%)
- Data Table on France - Year-over-year growth 2024-2029 (%)
- 12.13 China - Market size and forecast 2024-2029
- Chart on China - Market size and forecast 2024-2029 ($ million)
- Data Table on China - Market size and forecast 2024-2029 ($ million)
- Chart on China - Year-over-year growth 2024-2029 (%)
- Data Table on China - Year-over-year growth 2024-2029 (%)
- 12.14 Italy - Market size and forecast 2024-2029
- Chart on Italy - Market size and forecast 2024-2029 ($ million)
- Data Table on Italy - Market size and forecast 2024-2029 ($ million)
- Chart on Italy - Year-over-year growth 2024-2029 (%)
- Data Table on Italy - Year-over-year growth 2024-2029 (%)
- 12.15 India - Market size and forecast 2024-2029
- Chart on India - Market size and forecast 2024-2029 ($ million)
- Data Table on India - Market size and forecast 2024-2029 ($ million)
- Chart on India - Year-over-year growth 2024-2029 (%)
- Data Table on India - Year-over-year growth 2024-2029 (%)
- 12.16 Spain - Market size and forecast 2024-2029
- Chart on Spain - Market size and forecast 2024-2029 ($ million)
- Data Table on Spain - Market size and forecast 2024-2029 ($ million)
- Chart on Spain - Year-over-year growth 2024-2029 (%)
- Data Table on Spain - Year-over-year growth 2024-2029 (%)
- 12.17 Brazil - Market size and forecast 2024-2029
- Chart on Brazil - Market size and forecast 2024-2029 ($ million)
- Data Table on Brazil - Market size and forecast 2024-2029 ($ million)
- Chart on Brazil - Year-over-year growth 2024-2029 (%)
- Data Table on Brazil - Year-over-year growth 2024-2029 (%)
- 12.18 Market opportunity By Geographical Landscape
- Market opportunity By Geographical Landscape ($ million)
- Data Tables on Market opportunity By Geographical Landscape ($ million)
13 Drivers, Challenges, and Opportunity/Restraints
- 13.1 Market drivers
- 13.2 Market challenges
- 13.3 Impact of drivers and challenges
- Impact of drivers and challenges in 2024 and 2029
- 13.4 Market opportunities/restraints
14 Competitive Landscape
- 14.1 Overview
- 14.2 Competitive Landscape
- Overview on criticality of inputs and factors of differentiation
- 14.3 Landscape disruption
- Overview on factors of disruption
- 14.4 Industry risks
- Impact of key risks on business
15 Competitive Analysis
- 15.1 Companies profiled
- Companies covered
- 15.2 Company ranking index
- Company ranking index
- 15.3 Market positioning of companies
- Matrix on companies position and classification
- 15.4 Chicago Vegan Foods
- Chicago Vegan Foods - Overview
- Chicago Vegan Foods - Product / Service
- Chicago Vegan Foods - Key offerings
- SWOT
- 15.5 Dairy Free Down Under
- Dairy Free Down Under - Overview
- Dairy Free Down Under - Product / Service
- Dairy Free Down Under - Key offerings
- SWOT
- 15.6 First Grade International Ltd.
- First Grade International Ltd. - Overview
- First Grade International Ltd. - Product / Service
- First Grade International Ltd. - Key offerings
- SWOT
- 15.7 Franklin Foods Inc.
- Franklin Foods Inc. - Overview
- Franklin Foods Inc. - Product / Service
- Franklin Foods Inc. - Key offerings
- SWOT
- 15.8 Good Carma
- Good Carma - Overview
- Good Carma - Product / Service
- Good Carma - Key offerings
- SWOT
- 15.9 Kite Hill
- Kite Hill - Overview
- Kite Hill - Product / Service
- Kite Hill - Key offerings
- SWOT
- 15.10 Maple Leaf Foods Inc.
- Maple Leaf Foods Inc. - Overview
- Maple Leaf Foods Inc. - Business segments
- Maple Leaf Foods Inc. - Key offerings
- Maple Leaf Foods Inc. - Segment focus
- SWOT
- 15.11 Miyokos Creamery
- Miyokos Creamery - Overview
- Miyokos Creamery - Product / Service
- Miyokos Creamery - Key offerings
- SWOT
- 15.12 Nush foods
- Nush foods - Overview
- Nush foods - Product / Service
- Nush foods - Key offerings
- SWOT
- 15.13 Saputo Inc.
- Saputo Inc. - Overview
- Saputo Inc. - Business segments
- Saputo Inc. - Key offerings
- Saputo Inc. - Segment focus
- SWOT
- 15.14 Tofutti Brands Inc
- Tofutti Brands Inc - Overview
- Tofutti Brands Inc - Product / Service
- Tofutti Brands Inc - Key offerings
- SWOT
- 15.15 Treeline Cheese
- Treeline Cheese - Overview
- Treeline Cheese - Product / Service
- Treeline Cheese - Key offerings
- SWOT
- 15.16 Upfield BV
- Upfield BV - Overview
- Upfield BV - Product / Service
- Upfield BV - Key offerings
- SWOT
- 15.17 Urban Platter
- Urban Platter - Overview
- Urban Platter - Product / Service
- Urban Platter - Key offerings
- SWOT
- 15.18 Vromage
- Vromage - Overview
- Vromage - Product / Service
- Vromage - Key offerings
- SWOT
16 Appendix
- 16.1 Scope of the report
- 16.2 Inclusions and exclusions checklist
- Inclusions checklist
- Exclusions checklist
- 16.3 Currency conversion rates for US$
- Currency conversion rates for US$
- 16.4 Research methodology
- Research methodology
- 16.5 Data procurement
- Information sources
- 16.6 Data validation
- Data validation
- 16.7 Validation techniques employed for market sizing
- Validation techniques employed for market sizing
- 16.8 Data synthesis
- Data synthesis
- 16.9 360 degree market analysis
- 360 degree market analysis
- 16.10 List of abbreviations
- List of abbreviations

