|
|
市場調査レポート
商品コード
1727150
マイクロモビリティの世界市場 2025-2029Global Micromobility Market 2025-2029 |
||||||
|
|||||||
カスタマイズ可能
|
|||||||


| マイクロモビリティの世界市場 2025-2029 |
|
出版日: 2025年05月09日
発行: TechNavio
ページ情報: 英文 216 Pages
納期: 即納可能
|

全表示
- 概要
- 図表
- 目次
マイクロモビリティ市場は2024-2029年に1,865億4,850万米ドル、予測期間中のCAGRは26.4%で成長すると予測されます。
当レポートでは、マイクロモビリティ市場の全体的な分析、市場規模・予測、動向、成長促進要因、課題、約25のベンダーを網羅したベンダー分析などを掲載しています。
現在の市場シナリオ、最新動向と促進要因、市場環境全体に関する最新分析を提供しています。市場は、交通渋滞の増加、オンデマンド輸送サービスの傾向の高まり、環境に優しい輸送モードに対する意識の高まりによって牽引されています。
| 市場範囲 | |
|---|---|
| 基準年 | 2025 |
| 終了年 | 2029 |
| 予測期間 | 2025-2029 |
| 成長モメンタム | 加速 |
| 前年比 | 20.5% |
| CAGR | 26.4% |
| 増分額 | 1,865億4,850万米ドル |
本調査は、業界の主要参加者からのインプットを含め、一次情報と二次情報を客観的に組み合わせて実施しました。レポートには、主要企業の分析に加え、包括的な市場規模データ、地域別分析によるセグメント、ベンダー情勢が含まれています。レポートには過去データと予測データを掲載しています。
本調査では、今後数年間のマイクロモビリティ市場の成長を促進する主な要因の1つとして、サブスクリプションや会員制のビジネスモデルの利用が増加していることを挙げています。また、ドックレスバイクシェアリングサービスの採用が増加し、バイクシェアリング・インフラの開発に対する政府の取り組みが増加していることも、市場の大きな需要につながると考えられます。
目次
第1章 エグゼクティブサマリー
- 市場概要
第2章 Technavio分析
- 価格・ライフサイクル・顧客購入バスケット・採用率・購入基準の分析
- インプットの重要性と差別化の要因
- 混乱の要因
- 促進要因と課題の影響
第3章 市場情勢
- 市場エコシステム
- 市場の特徴
- バリューチェーン分析
第4章 市場規模
- 市場の定義
- 市場セグメント分析
- 市場規模 2024
- 市場の見通し 2024-2029
第5章 市場規模実績
- マイクロモビリティの世界市場 2019-2023
- 推進セグメント分析 2019-2023
- タイプセグメント分析 2019-2023
- 車両タイプセグメント分析 2019-2023
- 地域別セグメント分析 2019-2023
- 国別セグメント分析 2019-2023
第6章 定性分析
- AIの影響:マイクロモビリティの世界市場
第7章 ファイブフォース分析
- ファイブフォースの要約
- 買い手の交渉力
- 供給企業の交渉力
- 新規参入業者の脅威
- 代替品の脅威
- 競争の脅威
- 市況
第8章 市場セグメンテーション:推進力別
- 市場セグメント
- 比較:推進力別
- 人力:市場規模と予測 2024-2029
- 電気駆動:市場規模と予測 2024-2029
- 市場機会:推進力別
第9章 市場セグメンテーション:タイプ別
- 市場セグメント
- 比較:タイプ別
- ドッキング:市場規模と予測 2024-2029
- ドックレス:市場規模と予測 2024-2029
- 市場機会:タイプ別
第10章 市場セグメンテーション:車両タイプ別
- 市場セグメント
- 比較:車両タイプ別
- 自転車:市場規模と予測 2024-2029
- 電動キックスクーター:市場規模と予測 2024-2029
- 電動モペットとスクーター:市場規模と予測 2024-2029
- スケートボード:市場規模と予測 2024-2029
- その他:市場規模と予測 2024-2029
- 市場機会:車両タイプ別
第11章 顧客情勢
- 顧客情勢の概要
第12章 地域別情勢
- 地域別セグメンテーション
- 地域別比較
- アジア太平洋:市場規模と予測 2024-2029
- 欧州:市場規模と予測 2024-2029
- 北米:市場規模と予測 2024-2029
- 中東・アフリカ:市場規模と予測 2024-2029
- 南米:市場規模と予測 2024-2029
- 中国:市場規模と予測 2024-2029
- 米国:市場規模と予測 2024-2029
- ドイツ:市場規模と予測 2024-2029
- インド:市場規模と予測 2024-2029
- 英国:市場規模と予測 2024-2029
- 日本:市場規模と予測 2024-2029
- フランス:市場規模と予測 2024-2029
- 韓国:市場規模と予測 2024-2029
- オーストラリア:市場規模と予測 2024-2029
- イタリア:市場規模と予測 2024-2029
- 市場機会:地域情勢別
第13章 促進要因・課題・機会・抑制要因
- 市場促進要因
- 市場の課題
- 促進要因と課題の影響
- 市場の機会・抑制要因
第14章 競合情勢
- 概要
- 競合情勢
- 混乱の状況
- 業界のリスク
第15章 競合分析
- 企業プロファイル
- 企業ランキング指数
- 企業の市場ポジショニング
- Beam Mobility Holdings Pte. Ltd.
- Bird Global Inc.
- Bolt Technology OU
- COOLTRA MOTOS SLU
- CycleHop LLC
- ElectricFeel AG
- emTransit SRL
- EV RIDER LLC
- Golden Technologies
- Lyft Inc.
- Micro Mobility Systems AG
- Neuron Mobility Pte. Ltd.
- Neutron Holdings Inc.
- Pride Mobility Products Corp.
- Yulu Bikes Pvt. Ltd.
第16章 付録
Exhibits:
- Exhibits1: Executive Summary - Chart on Market Overview
- Exhibits2: Executive Summary - Data Table on Market Overview
- Exhibits3: Executive Summary - Chart on Global Market Characteristics
- Exhibits4: Executive Summary - Chart on Market By Geographical Landscape
- Exhibits5: Executive Summary - Chart on Market Segmentation by Propulsion
- Exhibits6: Executive Summary - Chart on Market Segmentation by Type
- Exhibits7: Executive Summary - Chart on Market Segmentation by Vehicle Type
- Exhibits8: Executive Summary - Chart on Incremental Growth
- Exhibits9: Executive Summary - Data Table on Incremental Growth
- Exhibits10: Executive Summary - Chart on Company Market Positioning
- Exhibits11: Analysis of price sensitivity, lifecycle, customer purchase basket, adoption rates, and purchase criteria
- Exhibits12: Overview on criticality of inputs and factors of differentiation
- Exhibits13: Overview on factors of disruption
- Exhibits14: Impact of drivers and challenges in 2024 and 2029
- Exhibits15: Parent Market
- Exhibits16: Data Table on - Parent Market
- Exhibits17: Market characteristics analysis
- Exhibits18: Value chain analysis
- Exhibits19: Offerings of companies included in the market definition
- Exhibits20: Market segments
- Exhibits21: Chart on Global - Market size and forecast 2024-2029 ($ million)
- Exhibits22: Data Table on Global - Market size and forecast 2024-2029 ($ million)
- Exhibits23: Chart on Global Market: Year-over-year growth 2024-2029 (%)
- Exhibits24: Data Table on Global Market: Year-over-year growth 2024-2029 (%)
- Exhibits25: Historic Market Size - Data Table on Global Micromobility Market 2019 - 2023 ($ million)
- Exhibits26: Historic Market Size - Propulsion Segment 2019 - 2023 ($ million)
- Exhibits27: Historic Market Size - Type Segment 2019 - 2023 ($ million)
- Exhibits28: Historic Market Size - Vehicle Type Segment 2019 - 2023 ($ million)
- Exhibits29: Historic Market Size - Geography Segment 2019 - 2023 ($ million)
- Exhibits30: Historic Market Size - Country Segment 2019 - 2023 ($ million)
- Exhibits31: Five forces analysis - Comparison between 2024 and 2029
- Exhibits32: Bargaining power of buyers - Impact of key factors 2024 and 2029
- Exhibits33: Bargaining power of suppliers - Impact of key factors in 2024 and 2029
- Exhibits34: Threat of new entrants - Impact of key factors in 2024 and 2029
- Exhibits35: Threat of substitutes - Impact of key factors in 2024 and 2029
- Exhibits36: Threat of rivalry - Impact of key factors in 2024 and 2029
- Exhibits37: Chart on Market condition - Five forces 2024 and 2029
- Exhibits38: Chart on Propulsion - Market share 2024-2029 (%)
- Exhibits39: Data Table on Propulsion - Market share 2024-2029 (%)
- Exhibits40: Chart on Comparison by Propulsion
- Exhibits41: Data Table on Comparison by Propulsion
- Exhibits42: Chart on Human powered - Market size and forecast 2024-2029 ($ million)
- Exhibits43: Data Table on Human powered - Market size and forecast 2024-2029 ($ million)
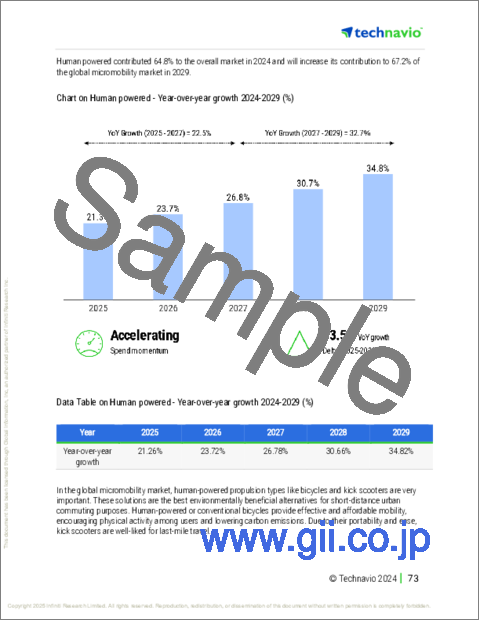
- Exhibits44: Chart on Human powered - Year-over-year growth 2024-2029 (%)
- Exhibits45: Data Table on Human powered - Year-over-year growth 2024-2029 (%)
- Exhibits46: Chart on Electrically powered - Market size and forecast 2024-2029 ($ million)
- Exhibits47: Data Table on Electrically powered - Market size and forecast 2024-2029 ($ million)
- Exhibits48: Chart on Electrically powered - Year-over-year growth 2024-2029 (%)
- Exhibits49: Data Table on Electrically powered - Year-over-year growth 2024-2029 (%)
- Exhibits50: Market opportunity by Propulsion ($ million)
- Exhibits51: Data Table on Market opportunity by Propulsion ($ million)
- Exhibits52: Chart on Type - Market share 2024-2029 (%)
- Exhibits53: Data Table on Type - Market share 2024-2029 (%)
- Exhibits54: Chart on Comparison by Type
- Exhibits55: Data Table on Comparison by Type
- Exhibits56: Chart on Docked - Market size and forecast 2024-2029 ($ million)
- Exhibits57: Data Table on Docked - Market size and forecast 2024-2029 ($ million)
- Exhibits58: Chart on Docked - Year-over-year growth 2024-2029 (%)
- Exhibits59: Data Table on Docked - Year-over-year growth 2024-2029 (%)
- Exhibits60: Chart on Dock-less - Market size and forecast 2024-2029 ($ million)
- Exhibits61: Data Table on Dock-less - Market size and forecast 2024-2029 ($ million)
- Exhibits62: Chart on Dock-less - Year-over-year growth 2024-2029 (%)
- Exhibits63: Data Table on Dock-less - Year-over-year growth 2024-2029 (%)
- Exhibits64: Market opportunity by Type ($ million)
- Exhibits65: Data Table on Market opportunity by Type ($ million)
- Exhibits66: Chart on Vehicle Type - Market share 2024-2029 (%)
- Exhibits67: Data Table on Vehicle Type - Market share 2024-2029 (%)
- Exhibits68: Chart on Comparison by Vehicle Type
- Exhibits69: Data Table on Comparison by Vehicle Type
- Exhibits70: Chart on Bicycles - Market size and forecast 2024-2029 ($ million)
- Exhibits71: Data Table on Bicycles - Market size and forecast 2024-2029 ($ million)
- Exhibits72: Chart on Bicycles - Year-over-year growth 2024-2029 (%)
- Exhibits73: Data Table on Bicycles - Year-over-year growth 2024-2029 (%)
- Exhibits74: Chart on E-kick scooters - Market size and forecast 2024-2029 ($ million)
- Exhibits75: Data Table on E-kick scooters - Market size and forecast 2024-2029 ($ million)
- Exhibits76: Chart on E-kick scooters - Year-over-year growth 2024-2029 (%)
- Exhibits77: Data Table on E-kick scooters - Year-over-year growth 2024-2029 (%)
- Exhibits78: Chart on Electric mopeds and scooters - Market size and forecast 2024-2029 ($ million)
- Exhibits79: Data Table on Electric mopeds and scooters - Market size and forecast 2024-2029 ($ million)
- Exhibits80: Chart on Electric mopeds and scooters - Year-over-year growth 2024-2029 (%)
- Exhibits81: Data Table on Electric mopeds and scooters - Year-over-year growth 2024-2029 (%)
- Exhibits82: Chart on Skateboards - Market size and forecast 2024-2029 ($ million)
- Exhibits83: Data Table on Skateboards - Market size and forecast 2024-2029 ($ million)
- Exhibits84: Chart on Skateboards - Year-over-year growth 2024-2029 (%)
- Exhibits85: Data Table on Skateboards - Year-over-year growth 2024-2029 (%)
- Exhibits86: Chart on Others - Market size and forecast 2024-2029 ($ million)
- Exhibits87: Data Table on Others - Market size and forecast 2024-2029 ($ million)
- Exhibits88: Chart on Others - Year-over-year growth 2024-2029 (%)
- Exhibits89: Data Table on Others - Year-over-year growth 2024-2029 (%)
- Exhibits90: Market opportunity by Vehicle Type ($ million)
- Exhibits91: Data Table on Market opportunity by Vehicle Type ($ million)
- Exhibits92: Analysis of price sensitivity, lifecycle, customer purchase basket, adoption rates, and purchase criteria
- Exhibits93: Chart on Market share By Geographical Landscape 2024-2029 (%)
- Exhibits94: Data Table on Market share By Geographical Landscape 2024-2029 (%)
- Exhibits95: Chart on Geographic comparison
- Exhibits96: Data Table on Geographic comparison
- Exhibits97: Chart on APAC - Market size and forecast 2024-2029 ($ million)
- Exhibits98: Data Table on APAC - Market size and forecast 2024-2029 ($ million)
- Exhibits99: Chart on APAC - Year-over-year growth 2024-2029 (%)
- Exhibits100: Data Table on APAC - Year-over-year growth 2024-2029 (%)
- Exhibits101: Chart on Europe - Market size and forecast 2024-2029 ($ million)
- Exhibits102: Data Table on Europe - Market size and forecast 2024-2029 ($ million)
- Exhibits103: Chart on Europe - Year-over-year growth 2024-2029 (%)
- Exhibits104: Data Table on Europe - Year-over-year growth 2024-2029 (%)
- Exhibits105: Chart on North America - Market size and forecast 2024-2029 ($ million)
- Exhibits106: Data Table on North America - Market size and forecast 2024-2029 ($ million)
- Exhibits107: Chart on North America - Year-over-year growth 2024-2029 (%)
- Exhibits108: Data Table on North America - Year-over-year growth 2024-2029 (%)
- Exhibits109: Chart on Middle East and Africa - Market size and forecast 2024-2029 ($ million)
- Exhibits110: Data Table on Middle East and Africa - Market size and forecast 2024-2029 ($ million)
- Exhibits111: Chart on Middle East and Africa - Year-over-year growth 2024-2029 (%)
- Exhibits112: Data Table on Middle East and Africa - Year-over-year growth 2024-2029 (%)
- Exhibits113: Chart on South America - Market size and forecast 2024-2029 ($ million)
- Exhibits114: Data Table on South America - Market size and forecast 2024-2029 ($ million)
- Exhibits115: Chart on South America - Year-over-year growth 2024-2029 (%)
- Exhibits116: Data Table on South America - Year-over-year growth 2024-2029 (%)
- Exhibits117: Chart on China - Market size and forecast 2024-2029 ($ million)
- Exhibits118: Data Table on China - Market size and forecast 2024-2029 ($ million)
- Exhibits119: Chart on China - Year-over-year growth 2024-2029 (%)
- Exhibits120: Data Table on China - Year-over-year growth 2024-2029 (%)
- Exhibits121: Chart on US - Market size and forecast 2024-2029 ($ million)
- Exhibits122: Data Table on US - Market size and forecast 2024-2029 ($ million)
- Exhibits123: Chart on US - Year-over-year growth 2024-2029 (%)
- Exhibits124: Data Table on US - Year-over-year growth 2024-2029 (%)
- Exhibits125: Chart on Germany - Market size and forecast 2024-2029 ($ million)
- Exhibits126: Data Table on Germany - Market size and forecast 2024-2029 ($ million)
- Exhibits127: Chart on Germany - Year-over-year growth 2024-2029 (%)
- Exhibits128: Data Table on Germany - Year-over-year growth 2024-2029 (%)
- Exhibits129: Chart on India - Market size and forecast 2024-2029 ($ million)
- Exhibits130: Data Table on India - Market size and forecast 2024-2029 ($ million)
- Exhibits131: Chart on India - Year-over-year growth 2024-2029 (%)
- Exhibits132: Data Table on India - Year-over-year growth 2024-2029 (%)
- Exhibits133: Chart on UK - Market size and forecast 2024-2029 ($ million)
- Exhibits134: Data Table on UK - Market size and forecast 2024-2029 ($ million)
- Exhibits135: Chart on UK - Year-over-year growth 2024-2029 (%)
- Exhibits136: Data Table on UK - Year-over-year growth 2024-2029 (%)
- Exhibits137: Chart on Japan - Market size and forecast 2024-2029 ($ million)
- Exhibits138: Data Table on Japan - Market size and forecast 2024-2029 ($ million)
- Exhibits139: Chart on Japan - Year-over-year growth 2024-2029 (%)
- Exhibits140: Data Table on Japan - Year-over-year growth 2024-2029 (%)
- Exhibits141: Chart on France - Market size and forecast 2024-2029 ($ million)
- Exhibits142: Data Table on France - Market size and forecast 2024-2029 ($ million)
- Exhibits143: Chart on France - Year-over-year growth 2024-2029 (%)
- Exhibits144: Data Table on France - Year-over-year growth 2024-2029 (%)
- Exhibits145: Chart on South Korea - Market size and forecast 2024-2029 ($ million)
- Exhibits146: Data Table on South Korea - Market size and forecast 2024-2029 ($ million)
- Exhibits147: Chart on South Korea - Year-over-year growth 2024-2029 (%)
- Exhibits148: Data Table on South Korea - Year-over-year growth 2024-2029 (%)
- Exhibits149: Chart on Australia - Market size and forecast 2024-2029 ($ million)
- Exhibits150: Data Table on Australia - Market size and forecast 2024-2029 ($ million)
- Exhibits151: Chart on Australia - Year-over-year growth 2024-2029 (%)
- Exhibits152: Data Table on Australia - Year-over-year growth 2024-2029 (%)
- Exhibits153: Chart on Italy - Market size and forecast 2024-2029 ($ million)
- Exhibits154: Data Table on Italy - Market size and forecast 2024-2029 ($ million)
- Exhibits155: Chart on Italy - Year-over-year growth 2024-2029 (%)
- Exhibits156: Data Table on Italy - Year-over-year growth 2024-2029 (%)
- Exhibits157: Market opportunity By Geographical Landscape ($ million)
- Exhibits158: Data Tables on Market opportunity By Geographical Landscape ($ million)
- Exhibits159: Impact of drivers and challenges in 2024 and 2029
- Exhibits160: Overview on criticality of inputs and factors of differentiation
- Exhibits161: Overview on factors of disruption
- Exhibits162: Impact of key risks on business
- Exhibits163: Companies covered
- Exhibits164: Company ranking index
- Exhibits165: Matrix on companies position and classification
- Exhibits166: Beam Mobility Holdings Pte. Ltd. - Overview
- Exhibits167: Beam Mobility Holdings Pte. Ltd. - Product / Service
- Exhibits168: Beam Mobility Holdings Pte. Ltd. - Key offerings
- Exhibits169: SWOT
- Exhibits170: Bird Global Inc. - Overview
- Exhibits171: Bird Global Inc. - Business segments
- Exhibits172: Bird Global Inc. - Key offerings
- Exhibits173: Bird Global Inc. - Segment focus
- Exhibits174: SWOT
- Exhibits175: Bolt Technology OU - Overview
- Exhibits176: Bolt Technology OU - Product / Service
- Exhibits177: Bolt Technology OU - Key offerings
- Exhibits178: SWOT
- Exhibits179: COOLTRA MOTOS SLU - Overview
- Exhibits180: COOLTRA MOTOS SLU - Product / Service
- Exhibits181: COOLTRA MOTOS SLU - Key offerings
- Exhibits182: SWOT
- Exhibits183: CycleHop LLC - Overview
- Exhibits184: CycleHop LLC - Product / Service
- Exhibits185: CycleHop LLC - Key offerings
- Exhibits186: SWOT
- Exhibits187: ElectricFeel AG - Overview
- Exhibits188: ElectricFeel AG - Product / Service
- Exhibits189: ElectricFeel AG - Key offerings
- Exhibits190: SWOT
- Exhibits191: emTransit SRL - Overview
- Exhibits192: emTransit SRL - Product / Service
- Exhibits193: emTransit SRL - Key offerings
- Exhibits194: SWOT
- Exhibits195: EV RIDER LLC - Overview
- Exhibits196: EV RIDER LLC - Product / Service
- Exhibits197: EV RIDER LLC - Key offerings
- Exhibits198: SWOT
- Exhibits199: Golden Technologies - Overview
- Exhibits200: Golden Technologies - Product / Service
- Exhibits201: Golden Technologies - Key offerings
- Exhibits202: SWOT
- Exhibits203: Lyft Inc. - Overview
- Exhibits204: Lyft Inc. - Product / Service
- Exhibits205: Lyft Inc. - Key offerings
- Exhibits206: SWOT
- Exhibits207: Micro Mobility Systems AG - Overview
- Exhibits208: Micro Mobility Systems AG - Product / Service
- Exhibits209: Micro Mobility Systems AG - Key offerings
- Exhibits210: SWOT
- Exhibits211: Neuron Mobility Pte. Ltd. - Overview
- Exhibits212: Neuron Mobility Pte. Ltd. - Product / Service
- Exhibits213: Neuron Mobility Pte. Ltd. - Key offerings
- Exhibits214: SWOT
- Exhibits215: Neutron Holdings Inc. - Overview
- Exhibits216: Neutron Holdings Inc. - Product / Service
- Exhibits217: Neutron Holdings Inc. - Key offerings
- Exhibits218: SWOT
- Exhibits219: Pride Mobility Products Corp. - Overview
- Exhibits220: Pride Mobility Products Corp. - Product / Service
- Exhibits221: Pride Mobility Products Corp. - Key offerings
- Exhibits222: SWOT
- Exhibits223: Yulu Bikes Pvt. Ltd. - Overview
- Exhibits224: Yulu Bikes Pvt. Ltd. - Product / Service
- Exhibits225: Yulu Bikes Pvt. Ltd. - Key offerings
- Exhibits226: SWOT
- Exhibits227: Inclusions checklist
- Exhibits228: Exclusions checklist
- Exhibits229: Currency conversion rates for US$
- Exhibits230: Research methodology
- Exhibits231: Information sources
- Exhibits232: Data validation
- Exhibits233: Validation techniques employed for market sizing
- Exhibits234: Data synthesis
- Exhibits235: 360 degree market analysis
- Exhibits236: List of abbreviations
The micromobility market is forecasted to grow by USD 186548.5 mn during 2024-2029, accelerating at a CAGR of 26.4% during the forecast period. The report on the micromobility market provides a holistic analysis, market size and forecast, trends, growth drivers, and challenges, as well as vendor analysis covering around 25 vendors.
The report offers an up-to-date analysis regarding the current market scenario, the latest trends and drivers, and the overall market environment. The market is driven by increasing traffic congestion, rising trend of on-demand transportation services, and increasing awareness about green transportation modes.
| Market Scope | |
|---|---|
| Base Year | 2025 |
| End Year | 2029 |
| Series Year | 2025-2029 |
| Growth Momentum | Accelerate |
| YOY 2025 | 20.5% |
| CAGR | 26.4% |
| Incremental Value | $186548.5 mn |
The study was conducted using an objective combination of primary and secondary information including inputs from key participants in the industry. The report contains a comprehensive market size data, segment with regional analysis and vendor landscape in addition to an analysis of the key companies. Reports have historic and forecast data.
Technavio's micromobility market is segmented as below:
By Propulsion
- Human powered
- Electrically powered
By Type
- Docked
- Dock-less
By Vehicle Type
- Bicycles
- E-kick scooters
- Electric mopeds and scooters
- Skateboards
- Others
By Geographical Landscape
- APAC
- Europe
- North America
- Middle East and Africa
- South America
This study identifies the rising use of subscription and membership business models as one of the prime reasons driving the micromobility market growth during the next few years. Also, rising adoption of dockless bike-sharing services and increasing government initiatives for development of bike-sharing infrastructure will lead to sizable demand in the market.
The report on the micromobility market covers the following areas:
- Micromobility Market sizing
- Micromobility Market forecast
- Micromobility Market industry analysis
The robust vendor analysis is designed to help clients improve their market position, and in line with this, this report provides a detailed analysis of several leading micromobility market vendors that include Beam Mobility Holdings Pte. Ltd., Bird Global Inc., Bolt Technology OU, CITYSCOOT, COOLTRA MOTOS SLU, CycleHop LLC, Dynamic Bicycles Inc., Easymile SAS, ElectricFeel AG, emTransit SRL, EV RIDER LLC, Golden Technologies, Lyft Inc., Merits Health Products, Micro Mobility Systems AG, Neuron Mobility Pte. Ltd., Neutron Holdings Inc., Pride Mobility Products Corp., Vulog, and Yulu Bikes Pvt. Ltd.. Also, the micromobility market analysis report includes information on upcoming trends and challenges that will influence market growth. This is to help companies strategize and leverage all forthcoming growth opportunities.
The publisher presents a detailed picture of the market by the way of study, synthesis, and summation of data from multiple sources by an analysis of key parameters such as profit, pricing, competition, and promotions. It presents various market facets by identifying the key industry influencers. The data presented is comprehensive, reliable, and a result of extensive primary and secondary research. The market research reports provide a complete competitive landscape and an in-depth vendor selection methodology and analysis using qualitative and quantitative research to forecast accurate market growth.
Table of Contents
1 Executive Summary
- 1.1 Market overview
- Executive Summary - Chart on Market Overview
- Executive Summary - Data Table on Market Overview
- Executive Summary - Chart on Global Market Characteristics
- Executive Summary - Chart on Market By Geographical Landscape
- Executive Summary - Chart on Market Segmentation by Propulsion
- Executive Summary - Chart on Market Segmentation by Type
- Executive Summary - Chart on Market Segmentation by Vehicle Type
- Executive Summary - Chart on Incremental Growth
- Executive Summary - Data Table on Incremental Growth
- Executive Summary - Chart on Company Market Positioning
2 Technavio Analysis
- 2.1 Analysis of price sensitivity, lifecycle, customer purchase basket, adoption rates, and purchase criteria
- Analysis of price sensitivity, lifecycle, customer purchase basket, adoption rates, and purchase criteria
- 2.2 Criticality of inputs and Factors of differentiation
- Overview on criticality of inputs and factors of differentiation
- 2.3 Factors of disruption
- Overview on factors of disruption
- 2.4 Impact of drivers and challenges
- Impact of drivers and challenges in 2024 and 2029
3 Market Landscape
- 3.1 Market ecosystem
- Parent Market
- Data Table on - Parent Market
- 3.2 Market characteristics
- Market characteristics analysis
- 3.3 Value chain analysis
- Value chain analysis
4 Market Sizing
- 4.1 Market definition
- Offerings of companies included in the market definition
- 4.2 Market segment analysis
- Market segments
- 4.3 Market size 2024
- 4.4 Market outlook: Forecast for 2024-2029
- Chart on Global - Market size and forecast 2024-2029 ($ million)
- Data Table on Global - Market size and forecast 2024-2029 ($ million)
- Chart on Global Market: Year-over-year growth 2024-2029 (%)
- Data Table on Global Market: Year-over-year growth 2024-2029 (%)
5 Historic Market Size
- 5.1 Global Micromobility Market 2019 - 2023
- Historic Market Size - Data Table on Global Micromobility Market 2019 - 2023 ($ million)
- 5.2 Propulsion segment analysis 2019 - 2023
- Historic Market Size - Propulsion Segment 2019 - 2023 ($ million)
- 5.3 Type segment analysis 2019 - 2023
- Historic Market Size - Type Segment 2019 - 2023 ($ million)
- 5.4 Vehicle Type segment analysis 2019 - 2023
- Historic Market Size - Vehicle Type Segment 2019 - 2023 ($ million)
- 5.5 Geography segment analysis 2019 - 2023
- Historic Market Size - Geography Segment 2019 - 2023 ($ million)
- 5.6 Country segment analysis 2019 - 2023
- Historic Market Size - Country Segment 2019 - 2023 ($ million)
6 Qualitative Analysis
- 6.1 Impact of AI on Global Micromobility Market
7 Five Forces Analysis
- 7.1 Five forces summary
- Five forces analysis - Comparison between 2024 and 2029
- 7.2 Bargaining power of buyers
- Bargaining power of buyers - Impact of key factors 2024 and 2029
- 7.3 Bargaining power of suppliers
- Bargaining power of suppliers - Impact of key factors in 2024 and 2029
- 7.4 Threat of new entrants
- Threat of new entrants - Impact of key factors in 2024 and 2029
- 7.5 Threat of substitutes
- Threat of substitutes - Impact of key factors in 2024 and 2029
- 7.6 Threat of rivalry
- Threat of rivalry - Impact of key factors in 2024 and 2029
- 7.7 Market condition
- Chart on Market condition - Five forces 2024 and 2029
8 Market Segmentation by Propulsion
- 8.1 Market segments
- Chart on Propulsion - Market share 2024-2029 (%)
- Data Table on Propulsion - Market share 2024-2029 (%)
- 8.2 Comparison by Propulsion
- Chart on Comparison by Propulsion
- Data Table on Comparison by Propulsion
- 8.3 Human powered - Market size and forecast 2024-2029
- Chart on Human powered - Market size and forecast 2024-2029 ($ million)
- Data Table on Human powered - Market size and forecast 2024-2029 ($ million)
- Chart on Human powered - Year-over-year growth 2024-2029 (%)
- Data Table on Human powered - Year-over-year growth 2024-2029 (%)
- 8.4 Electrically powered - Market size and forecast 2024-2029
- Chart on Electrically powered - Market size and forecast 2024-2029 ($ million)
- Data Table on Electrically powered - Market size and forecast 2024-2029 ($ million)
- Chart on Electrically powered - Year-over-year growth 2024-2029 (%)
- Data Table on Electrically powered - Year-over-year growth 2024-2029 (%)
- 8.5 Market opportunity by Propulsion
- Market opportunity by Propulsion ($ million)
- Data Table on Market opportunity by Propulsion ($ million)
9 Market Segmentation by Type
- 9.1 Market segments
- Chart on Type - Market share 2024-2029 (%)
- Data Table on Type - Market share 2024-2029 (%)
- 9.2 Comparison by Type
- Chart on Comparison by Type
- Data Table on Comparison by Type
- 9.3 Docked - Market size and forecast 2024-2029
- Chart on Docked - Market size and forecast 2024-2029 ($ million)
- Data Table on Docked - Market size and forecast 2024-2029 ($ million)
- Chart on Docked - Year-over-year growth 2024-2029 (%)
- Data Table on Docked - Year-over-year growth 2024-2029 (%)
- 9.4 Dock-less - Market size and forecast 2024-2029
- Chart on Dock-less - Market size and forecast 2024-2029 ($ million)
- Data Table on Dock-less - Market size and forecast 2024-2029 ($ million)
- Chart on Dock-less - Year-over-year growth 2024-2029 (%)
- Data Table on Dock-less - Year-over-year growth 2024-2029 (%)
- 9.5 Market opportunity by Type
- Market opportunity by Type ($ million)
- Data Table on Market opportunity by Type ($ million)
10 Market Segmentation by Vehicle Type
- 10.1 Market segments
- Chart on Vehicle Type - Market share 2024-2029 (%)
- Data Table on Vehicle Type - Market share 2024-2029 (%)
- 10.2 Comparison by Vehicle Type
- Chart on Comparison by Vehicle Type
- Data Table on Comparison by Vehicle Type
- 10.3 Bicycles - Market size and forecast 2024-2029
- Chart on Bicycles - Market size and forecast 2024-2029 ($ million)
- Data Table on Bicycles - Market size and forecast 2024-2029 ($ million)
- Chart on Bicycles - Year-over-year growth 2024-2029 (%)
- Data Table on Bicycles - Year-over-year growth 2024-2029 (%)
- 10.4 E-kick scooters - Market size and forecast 2024-2029
- Chart on E-kick scooters - Market size and forecast 2024-2029 ($ million)
- Data Table on E-kick scooters - Market size and forecast 2024-2029 ($ million)
- Chart on E-kick scooters - Year-over-year growth 2024-2029 (%)
- Data Table on E-kick scooters - Year-over-year growth 2024-2029 (%)
- 10.5 Electric mopeds and scooters - Market size and forecast 2024-2029
- Chart on Electric mopeds and scooters - Market size and forecast 2024-2029 ($ million)
- Data Table on Electric mopeds and scooters - Market size and forecast 2024-2029 ($ million)
- Chart on Electric mopeds and scooters - Year-over-year growth 2024-2029 (%)
- Data Table on Electric mopeds and scooters - Year-over-year growth 2024-2029 (%)
- 10.6 Skateboards - Market size and forecast 2024-2029
- Chart on Skateboards - Market size and forecast 2024-2029 ($ million)
- Data Table on Skateboards - Market size and forecast 2024-2029 ($ million)
- Chart on Skateboards - Year-over-year growth 2024-2029 (%)
- Data Table on Skateboards - Year-over-year growth 2024-2029 (%)
- 10.7 Others - Market size and forecast 2024-2029
- Chart on Others - Market size and forecast 2024-2029 ($ million)
- Data Table on Others - Market size and forecast 2024-2029 ($ million)
- Chart on Others - Year-over-year growth 2024-2029 (%)
- Data Table on Others - Year-over-year growth 2024-2029 (%)
- 10.8 Market opportunity by Vehicle Type
- Market opportunity by Vehicle Type ($ million)
- Data Table on Market opportunity by Vehicle Type ($ million)
11 Customer Landscape
- 11.1 Customer landscape overview
- Analysis of price sensitivity, lifecycle, customer purchase basket, adoption rates, and purchase criteria
12 Geographic Landscape
- 12.1 Geographic segmentation
- Chart on Market share By Geographical Landscape 2024-2029 (%)
- Data Table on Market share By Geographical Landscape 2024-2029 (%)
- 12.2 Geographic comparison
- Chart on Geographic comparison
- Data Table on Geographic comparison
- 12.3 APAC - Market size and forecast 2024-2029
- Chart on APAC - Market size and forecast 2024-2029 ($ million)
- Data Table on APAC - Market size and forecast 2024-2029 ($ million)
- Chart on APAC - Year-over-year growth 2024-2029 (%)
- Data Table on APAC - Year-over-year growth 2024-2029 (%)
- 12.4 Europe - Market size and forecast 2024-2029
- Chart on Europe - Market size and forecast 2024-2029 ($ million)
- Data Table on Europe - Market size and forecast 2024-2029 ($ million)
- Chart on Europe - Year-over-year growth 2024-2029 (%)
- Data Table on Europe - Year-over-year growth 2024-2029 (%)
- 12.5 North America - Market size and forecast 2024-2029
- Chart on North America - Market size and forecast 2024-2029 ($ million)
- Data Table on North America - Market size and forecast 2024-2029 ($ million)
- Chart on North America - Year-over-year growth 2024-2029 (%)
- Data Table on North America - Year-over-year growth 2024-2029 (%)
- 12.6 Middle East and Africa - Market size and forecast 2024-2029
- Chart on Middle East and Africa - Market size and forecast 2024-2029 ($ million)
- Data Table on Middle East and Africa - Market size and forecast 2024-2029 ($ million)
- Chart on Middle East and Africa - Year-over-year growth 2024-2029 (%)
- Data Table on Middle East and Africa - Year-over-year growth 2024-2029 (%)
- 12.7 South America - Market size and forecast 2024-2029
- Chart on South America - Market size and forecast 2024-2029 ($ million)
- Data Table on South America - Market size and forecast 2024-2029 ($ million)
- Chart on South America - Year-over-year growth 2024-2029 (%)
- Data Table on South America - Year-over-year growth 2024-2029 (%)
- 12.8 China - Market size and forecast 2024-2029
- Chart on China - Market size and forecast 2024-2029 ($ million)
- Data Table on China - Market size and forecast 2024-2029 ($ million)
- Chart on China - Year-over-year growth 2024-2029 (%)
- Data Table on China - Year-over-year growth 2024-2029 (%)
- 12.9 US - Market size and forecast 2024-2029
- Chart on US - Market size and forecast 2024-2029 ($ million)
- Data Table on US - Market size and forecast 2024-2029 ($ million)
- Chart on US - Year-over-year growth 2024-2029 (%)
- Data Table on US - Year-over-year growth 2024-2029 (%)
- 12.10 Germany - Market size and forecast 2024-2029
- Chart on Germany - Market size and forecast 2024-2029 ($ million)
- Data Table on Germany - Market size and forecast 2024-2029 ($ million)
- Chart on Germany - Year-over-year growth 2024-2029 (%)
- Data Table on Germany - Year-over-year growth 2024-2029 (%)
- 12.11 India - Market size and forecast 2024-2029
- Chart on India - Market size and forecast 2024-2029 ($ million)
- Data Table on India - Market size and forecast 2024-2029 ($ million)
- Chart on India - Year-over-year growth 2024-2029 (%)
- Data Table on India - Year-over-year growth 2024-2029 (%)
- 12.12 UK - Market size and forecast 2024-2029
- Chart on UK - Market size and forecast 2024-2029 ($ million)
- Data Table on UK - Market size and forecast 2024-2029 ($ million)
- Chart on UK - Year-over-year growth 2024-2029 (%)
- Data Table on UK - Year-over-year growth 2024-2029 (%)
- 12.13 Japan - Market size and forecast 2024-2029
- Chart on Japan - Market size and forecast 2024-2029 ($ million)
- Data Table on Japan - Market size and forecast 2024-2029 ($ million)
- Chart on Japan - Year-over-year growth 2024-2029 (%)
- Data Table on Japan - Year-over-year growth 2024-2029 (%)
- 12.14 France - Market size and forecast 2024-2029
- Chart on France - Market size and forecast 2024-2029 ($ million)
- Data Table on France - Market size and forecast 2024-2029 ($ million)
- Chart on France - Year-over-year growth 2024-2029 (%)
- Data Table on France - Year-over-year growth 2024-2029 (%)
- 12.15 South Korea - Market size and forecast 2024-2029
- Chart on South Korea - Market size and forecast 2024-2029 ($ million)
- Data Table on South Korea - Market size and forecast 2024-2029 ($ million)
- Chart on South Korea - Year-over-year growth 2024-2029 (%)
- Data Table on South Korea - Year-over-year growth 2024-2029 (%)
- 12.16 Australia - Market size and forecast 2024-2029
- Chart on Australia - Market size and forecast 2024-2029 ($ million)
- Data Table on Australia - Market size and forecast 2024-2029 ($ million)
- Chart on Australia - Year-over-year growth 2024-2029 (%)
- Data Table on Australia - Year-over-year growth 2024-2029 (%)
- 12.17 Italy - Market size and forecast 2024-2029
- Chart on Italy - Market size and forecast 2024-2029 ($ million)
- Data Table on Italy - Market size and forecast 2024-2029 ($ million)
- Chart on Italy - Year-over-year growth 2024-2029 (%)
- Data Table on Italy - Year-over-year growth 2024-2029 (%)
- 12.18 Market opportunity By Geographical Landscape
- Market opportunity By Geographical Landscape ($ million)
- Data Tables on Market opportunity By Geographical Landscape ($ million)
13 Drivers, Challenges, and Opportunity/Restraints
- 13.1 Market drivers
- 13.2 Market challenges
- 13.3 Impact of drivers and challenges
- Impact of drivers and challenges in 2024 and 2029
- 13.4 Market opportunities/restraints
14 Competitive Landscape
- 14.1 Overview
- 14.2 Competitive Landscape
- Overview on criticality of inputs and factors of differentiation
- 14.3 Landscape disruption
- Overview on factors of disruption
- 14.4 Industry risks
- Impact of key risks on business
15 Competitive Analysis
- 15.1 Companies profiled
- Companies covered
- 15.2 Company ranking index
- Company ranking index
- 15.3 Market positioning of companies
- Matrix on companies position and classification
- 15.4 Beam Mobility Holdings Pte. Ltd.
- Beam Mobility Holdings Pte. Ltd. - Overview
- Beam Mobility Holdings Pte. Ltd. - Product / Service
- Beam Mobility Holdings Pte. Ltd. - Key offerings
- SWOT
- 15.5 Bird Global Inc.
- Bird Global Inc. - Overview
- Bird Global Inc. - Business segments
- Bird Global Inc. - Key offerings
- Bird Global Inc. - Segment focus
- SWOT
- 15.6 Bolt Technology OU
- Bolt Technology OU - Overview
- Bolt Technology OU - Product / Service
- Bolt Technology OU - Key offerings
- SWOT
- 15.7 COOLTRA MOTOS SLU
- COOLTRA MOTOS SLU - Overview
- COOLTRA MOTOS SLU - Product / Service
- COOLTRA MOTOS SLU - Key offerings
- SWOT
- 15.8 CycleHop LLC
- CycleHop LLC - Overview
- CycleHop LLC - Product / Service
- CycleHop LLC - Key offerings
- SWOT
- 15.9 ElectricFeel AG
- ElectricFeel AG - Overview
- ElectricFeel AG - Product / Service
- ElectricFeel AG - Key offerings
- SWOT
- 15.10 emTransit SRL
- emTransit SRL - Overview
- emTransit SRL - Product / Service
- emTransit SRL - Key offerings
- SWOT
- 15.11 EV RIDER LLC
- EV RIDER LLC - Overview
- EV RIDER LLC - Product / Service
- EV RIDER LLC - Key offerings
- SWOT
- 15.12 Golden Technologies
- Golden Technologies - Overview
- Golden Technologies - Product / Service
- Golden Technologies - Key offerings
- SWOT
- 15.13 Lyft Inc.
- Lyft Inc. - Overview
- Lyft Inc. - Product / Service
- Lyft Inc. - Key offerings
- SWOT
- 15.14 Micro Mobility Systems AG
- Micro Mobility Systems AG - Overview
- Micro Mobility Systems AG - Product / Service
- Micro Mobility Systems AG - Key offerings
- SWOT
- 15.15 Neuron Mobility Pte. Ltd.
- Neuron Mobility Pte. Ltd. - Overview
- Neuron Mobility Pte. Ltd. - Product / Service
- Neuron Mobility Pte. Ltd. - Key offerings
- SWOT
- 15.16 Neutron Holdings Inc.
- Neutron Holdings Inc. - Overview
- Neutron Holdings Inc. - Product / Service
- Neutron Holdings Inc. - Key offerings
- SWOT
- 15.17 Pride Mobility Products Corp.
- Pride Mobility Products Corp. - Overview
- Pride Mobility Products Corp. - Product / Service
- Pride Mobility Products Corp. - Key offerings
- SWOT
- 15.18 Yulu Bikes Pvt. Ltd.
- Yulu Bikes Pvt. Ltd. - Overview
- Yulu Bikes Pvt. Ltd. - Product / Service
- Yulu Bikes Pvt. Ltd. - Key offerings
- SWOT
16 Appendix
- 16.1 Scope of the report
- 16.2 Inclusions and exclusions checklist
- Inclusions checklist
- Exclusions checklist
- 16.3 Currency conversion rates for US$
- Currency conversion rates for US$
- 16.4 Research methodology
- Research methodology
- 16.5 Data procurement
- Information sources
- 16.6 Data validation
- Data validation
- 16.7 Validation techniques employed for market sizing
- Validation techniques employed for market sizing
- 16.8 Data synthesis
- Data synthesis
- 16.9 360 degree market analysis
- 360 degree market analysis
- 16.10 List of abbreviations
- List of abbreviations

