|
|
市場調査レポート
商品コード
1114009
乳製品代替品の市場規模、シェア、動向分析レポート:供給源別(大豆、アーモンド、ココナッツ、米、オーツ)、製品別(ミルク、ヨーグルト、チーズ、アイスクリーム、クリーマー)、流通チャネル別、セグメント予測、2022年~2030年Dairy Alternatives Market Size, Share & Trends Analysis Report By Source (Soy, Almond, Coconut, Rice, Oats), By Product (Milk, Yogurt, Cheese, Ice-cream, Creamers), By Distribution Channel, And Segment Forecasts, 2022 - 2030 |
||||||
|
|
|||||||
|
● お客様のご希望に応じて、既存データの加工や未掲載情報(例:国別セグメント)の追加などの対応が可能です。 詳細はお問い合わせください。 |
|||||||


| 乳製品代替品の市場規模、シェア、動向分析レポート:供給源別(大豆、アーモンド、ココナッツ、米、オーツ)、製品別(ミルク、ヨーグルト、チーズ、アイスクリーム、クリーマー)、流通チャネル別、セグメント予測、2022年~2030年 |
|
出版日: 2022年07月04日
発行: Grand View Research
ページ情報: 英文 165 Pages
納期: 2~10営業日
|
- 全表示
- 概要
- 図表
- 目次
乳製品代替品市場の成長と動向
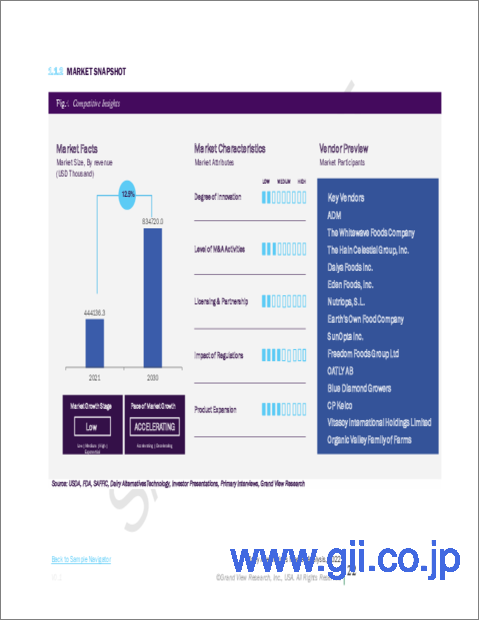
グランドビューリサーチ社の最新レポートによると、世界の乳製品代替品市場規模は2030年までに669億米ドルに達すると予測されています。
2022年から2030年までのCAGRは12.5%で拡大すると予測されています。植物由来の代替品に対する需要の高まりと、牛乳の代替品を活用する消費者の食生活の変化が、乳製品代替品の需要を促進しています。
牛乳アレルギーや乳糖不耐症の症例が増加していることが、市場をさらに押し上げると予想されます。乳糖不耐症の人々が乳製品代替品を選ぶようになってきているため、飲料メーカーはそれぞれの消費者層にアピールするために乳製品代替品を採用し、乳製品代替品の需要をさらに押し上げる要因となっています。
環境問題や道徳的な問題によって消費者の嗜好が変化し、菜食主義者や同様の食生活が大量に採用されるようになったことは、予測期間中に市場の成長にプラスの影響を与えると予想されます。欧州には確立された飲食品産業があり、菜食主義者の人口が大幅に増加しているため、同地域における乳製品代替品の成長率が高くなっています。
さらに、消費者はアーモンドミルクコーヒーやココナッツパンナコッタなど、よりバラエティに富んだ食品・飲料製品を選ぶようになっています。乳製品代替品を使った同様の料理は、ホテル、レストラン、カフェ、パッケージ食品などの主要産業で利用できるようになってきています。製品が入手しやすくなったことで、消費者は乳製品代替品やそれを使った製品を選ぶことが容易になりました。
アジア太平洋地域は、人口が増加している数多くの新興経済国で構成されているため、収益の面で最も支配的な地域となっています。中間層の増加と可処分所得の増加により、消費者は食品の選択肢に多様性を求めるようになり、さらに、西洋化した食品や食生活の動向に触れることで、この地域の市場はさらに拡大しています。
乳製品代替品の市場は、既存企業がすでに大きな市場シェアを獲得しているため競争が激しいですが、製品への需要の高まりを受け、現地の新興企業が市場に参入しています。プロセスや技術が単純であるため、新規参入が容易であり、その結果、市場での競合が増加しています。既存のプレーヤーは、新しい製品や牛乳の供給源を開発しています。例えば、サンフランシスコの新興企業がADMと共同で、酵母などの微生物叢を利用して動物性でない牛乳を生産しています。この製品は、原料を使わずに牛乳の利点をすべて備えていると期待されています。
乳製品代替品市場のレポートハイライト
原料別では、2021年に大豆が35.0%超の最大の売上シェアを占めています。豆乳は多くの国で伝統的に長く飲まれており、価格も手ごろで世界的に入手しやすいため、2021年の収益では最も優位な供給源セグメントとなっています
製品別では、乳糖不耐症の消費者やビーガン食を実践している消費者から植物由来の代替ミルクに対する高い需要があることから、2021年には牛乳が65.0%超の最大の売上シェアを占めています。成人や高齢者における高コレステロールの増加により、多くの消費者が乳製品の代わりに乳製品代替品を選ぶようになり、市場をさらに牽引している
流通チャネル別では、スーパーマーケットとハイパーマーケットが2021年の売上高シェア40.0%超で市場を牽引。北米や欧州などの先進地域はスーパーマーケットやハイパーマーケットの普及率が高く、一方、発展途上地域はスーパーマーケットやハイパーマーケットの数が増加しており、この流通チャネルの高い成長率に寄与している
2021年の市場規模は、アジア太平洋地域が40.0%超のシェアを占め、北米と欧州がそれぞれこれに続く。無菌包装で簡単に入手でき、便利な保管が可能なことから、予測期間中に製品の採用が増加すると予想される
植物由来および代替食品分野の市場拡大に伴い、同分野への投資が増加しています。例えば、EAT BEYOND GLOBAL HOLDINGS INC.という投資発行会社が、シェイクなどのヴィーガン飲料を扱うPlant Power Restaurant Group, LLCをポートフォリオに加えました。この取引は、ファーストフードを食べるが、菜食主義者の代替品を好むより多くの消費者層をターゲットにすることを目的としています。
目次
第1章 調査手法と範囲
- 市場セグメンテーションと範囲
- 市場の定義
- 情報調達
- 購入したデータベース
- GVRの内部データベース
- 二次情報と第三者の視点
- 1次調査
- 情報分析
- データ分析モデル
- 市場形成とデータ可視化
- データの検証と公開
第2章 エグゼクティブサマリー
- 市場の見通し
- セグメント別見通し
- 競合考察
第3章 市場変数、動向、および範囲
- 市場系統
- 浸透と成長の見通しのマッピング
- 業界バリューチェーン分析
- 主要原材料動向分析
- 製造動向
- 販売チャネル分析
- 技術フレームワーク
- 規制の枠組み
- 乳製品代替市場-市場力学
- 市場促進要因分析
- 市場制約分析
- 業界の課題
- ビジネス環境ツール分析:代替乳製品市場
- ポーターのファイブフォース分析
- 供給企業の交渉力
- 買い手の交渉力
- 代替の脅威
- 新規参入業者の脅威
- 競争企業間の敵対関係
- PESTLE分析
- 政治情勢
- 経済情勢
- 社会情勢
- テクノロジー情勢
- 環境情勢
- 法的情勢
- ポーターのファイブフォース分析
- 主要な戦略的取引と提携
- 市場戦略
- COVID-19の影響
第4章 代替乳製品市場:ソースの推定・動向分析
- 定義と範囲
- 乳製品代替市場:ソースの変動分析、2021 &2030
- 大豆
- アーモンド
- ココナッツ
- 米
- オーツ麦
- その他
第5章 乳製品代替市場:製品の推定・動向分析
- 乳製品代替市場:製品動向変動分析、2021 &2030
- 牛乳
- ヨーグルト
- チーズ
- アイスクリーム
- クリーマー
- その他
第6章 乳製品代替市場:流通チャネルの推定・動向分析
- 乳製品代替市場:流通チャネルの変動分析、2021年および2030年
- スーパーマーケット &ハイパーマーケット
- コンビニ
- オンライン小売
- その他
第7章 乳製品代替市場:地域推定・動向分析
- 乳製品代替市場:地域の変動分析、2021年および2030年
- 北米
- 米国
- カナダ
- メキシコ
- 欧州
- ドイツ
- 英国
- フランス
- イタリア
- スペイン
- アジア太平洋地域
- 中国
- インド
- 日本
- オーストラリア
- 中南米
- ブラジル
- 中東とアフリカ
- 南アフリカ
第8章 競合情勢
- Key Global Players, Their Initiatives, &Its Impact on the Market
- Key Company/Competition Categorization
- Vendor Landscape
- 主要ディストリビューターおよびチャネルパートナーのリスト
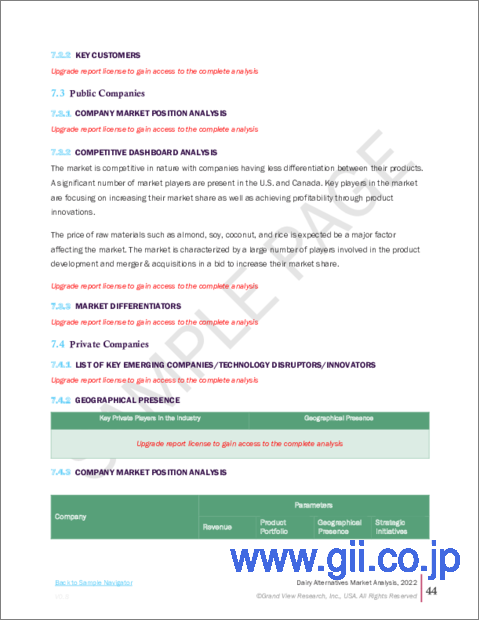
- Public Companies
- 会社の市況分析
- 企業の市場シェア/ランキング
- 競合ダッシュボード分析
- 市場の差別化要因
- シナジー分析
- Private Companies
- 主な新興企業
- 地理的存在
- 会社の市況分析
第9章 企業プロファイル
- ADM
- 会社概要
- 財務実績
- テクノロジーのベンチマーク
- 戦略的イニシアチブ
- The Whitewave Foods Company
- 会社概要
- 財務実績
- テクノロジーのベンチマーク
- 戦略的イニシアチブ
- The Hain Celestial Group, Inc.
- 会社概要
- 財務実績
- テクノロジーのベンチマーク
- 戦略的イニシアチブ
- Daiya Foods Inc.
- 会社概要
- 財務実績
- テクノロジーのベンチマーク
- 戦略的イニシアチブ
- Eden Foods, Inc.
- 会社概要
- 財務実績
- テクノロジーのベンチマーク
- 戦略的イニシアチブ
- Nutriops, SL
- 会社概要
- 財務実績
- テクノロジーのベンチマーク
- 戦略的イニシアチブ
- Earth's Own Food Company
- 会社概要
- 財務実績
- テクノロジーのベンチマーク
- 戦略的イニシアチブ
- SunOpta Inc.
- 会社概要
- 財務実績
- テクノロジーのベンチマーク
- 戦略的イニシアチブ
- Freedom Foods Group Ltd.
- 会社概要
- 財務実績
- テクノロジーのベンチマーク
- 戦略的イニシアチブ
- OATLY AB
- 会社概要
- 財務実績
- テクノロジーのベンチマーク
- Blue Diamond Growers
- 会社概要
- 財務実績
- テクノロジーのベンチマーク
- 戦略的イニシアチブ
- CP Kelco
- 会社概要
- 財務実績
- テクノロジーのベンチマーク
- 戦略的イニシアチブ
- Vitasoy International Holdings Limited
- 会社概要
- 財務実績
- テクノロジーのベンチマーク
- 戦略的イニシアチブ
- Organic Valley Family of Farms
- 会社概要
- 財務実績
- テクノロジーのベンチマーク
- Living Harvest Foods Inc.
- 会社概要
- 財務実績
- テクノロジーのベンチマーク
List of Tables
- Table 1 Global soy-based dairy alternatives market estimates and forecasts, 2017 - 2030 (USD Million)
- Table 2 Global almond-based dairy alternatives market estimates and forecasts, 2017 - 2030 (USD Million)
- Table 3 Global coconut-based dairy alternatives market estimates and forecasts, 2017 - 2030 (USD Million)
- Table 4 Global rice-based dairy alternatives market estimates and forecasts, 2017 - 2030 (USD Million)
- Table 5 Global oat-based dairy alternatives market estimates and forecasts, 2017 - 2030 (USD Million)
- Table 6 Global others-based dairy alternatives market estimates and forecasts, 2017 - 2030 (USD Million)
- Table 7 Global milk alternatives market estimates and forecasts, 2017 - 2030 (USD Million)
- Table 8 Global yogurt alternatives market estimates and forecasts, 2017 - 2030 (USD Million)
- Table 9 Global ice-cream alternatives market estimates and forecasts, 2017 - 2030 (USD Million)
- Table 10 Global cheese alternatives market estimates and forecasts, 2017 - 2030 (USD Million)
- Table 11 Global creamers alternatives market estimates and forecasts, 2017 - 2030 (USD Million)
- Table 12 Global others alternatives market estimates and forecasts, 2017 - 2030 (USD Million)
- Table 13 Global dairy alternatives market estimates and forecasts, by supermarkets & hypermarkets, 2017 - 2030 (USD Million)
- Table 14 Global dairy alternatives market estimates and forecasts, by convenience stores, 2017 - 2030 (USD Million)
- Table 15 Global dairy alternatives market estimates and forecasts, by online stores, 2017 - 2030 (USD Million)
- Table 16 Global dairy alternatives market estimates and forecasts, by others, 2017 - 2030 (USD Million)
- Table 17 North America dairy alternatives market estimates and forecasts, 2017 - 2030 (USD Million)
- Table 18 North America dairy alternatives market estimates and forecasts, by source, 2017 - 2030 (USD Million)
- Table 19 North America dairy alternatives market estimates and forecasts, by product, 2017 - 2030 (USD Million)
- Table 20 North America dairy alternatives market estimates and forecasts, by distribution channel,2017 - 2030 (USD Million)
- Table 21 U.S. dairy alternatives market estimates and forecasts, 2017 - 2030 (USD Million)
- Table 22 U.S. dairy alternatives market estimates and forecasts, by source, 2017 - 2030 (USD Million)
- Table 23 U.S. dairy alternatives market estimates and forecasts, by product, 2017 - 2030 (USD Million)
- Table 24 U.S. dairy alternatives market estimates and forecasts, by distribution channel, 2017 - 2030 (USD Million)
- Table 25 Canada dairy alternatives market estimates and forecasts, 2017 - 2030 (USD Million)
- Table 26 Canada dairy alternatives market estimates and forecasts, by source, 2017 - 2030 (USD Million)
- Table 27 Canada dairy alternatives market estimates and forecasts, by product, 2017 - 2030 (USD Million)
- Table 28 Canada dairy alternatives market estimates and forecasts, by distribution channel, 2017 - 2030 (USD Million)
- Table 29 Mexico dairy alternatives market estimates and forecasts, 2017 - 2030 (USD Million)
- Table 30 Mexico dairy alternatives market estimates and forecasts, by source, 2017 - 2030 (USD Million)
- Table 31 Mexico dairy alternatives market estimates and forecasts, by product, 2017 - 2030 (USD Million)
- Table 32 Mexico dairy alternatives market estimates and forecasts, by distribution channel, 2017 - 2030 (USD Million)
- Table 33 Europe dairy alternatives market estimates and forecasts, 2017 - 2030 (USD Million)
- Table 34 Europe dairy alternatives market estimates and forecasts, by source, 2017 - 2030 (USD Million)
- Table 35 Europe dairy alternatives market estimates and forecasts, by product, 2017 - 2030 (USD Million)
- Table 36 Europe dairy alternatives market estimates and forecasts, by distribution channel, 2017 - 2030 (USD Million)
- Table 37 Germany dairy alternatives market estimates and forecasts, 2017 - 2030 (USD Million)
- Table 38 Germany dairy alternatives market estimates and forecasts, by source, 2017 - 2030 (USD Million)
- Table 39 Germany dairy alternatives market estimates and forecasts, by product, 2017 - 2030 (USD Million)
- Table 40 Germany dairy alternatives market estimates and forecasts, by distribution channel, 2017 - 2030 (USD Million)
- Table 41 U.K. dairy alternatives market estimates and forecasts, 2017 - 2030 (USD Million)
- Table 42 U.K. dairy alternatives market estimates and forecasts, by source, 2017 - 2030 (USD Million)
- Table 43 U.K. dairy alternatives market estimates and forecasts, by product, 2017 - 2030 (USD Million)
- Table 44 U.K. dairy alternatives market estimates and forecasts, by distribution channel, 2017 - 2030 (USD Million)
- Table 45 France dairy alternatives market estimates and forecasts, 2017 - 2030 (USD Million)
- Table 46 France dairy alternatives market estimates and forecasts, by source, 2017 - 2030 (USD Million)
- Table 47 France dairy alternatives market estimates and forecasts, by product, 2017 - 2030 (USD Million)
- Table 48 France dairy alternatives market estimates and forecasts, by distribution channel, 2017 - 2030 (USD Million)
- Table 49 Spain dairy alternatives market estimates and forecasts, 2017 - 2030 (USD Million)
- Table 50 Spain dairy alternatives market estimates and forecasts, by source, 2017 - 2030 (USD Million)
- Table 51 Spain dairy alternatives market estimates and forecasts, by product, 2017 - 2030 (USD Million)
- Table 52 Spain dairy alternatives market estimates and forecasts, by distribution channel, 2017 - 2030 (USD Million)
- Table 53 Italy dairy alternatives market estimates and forecasts, 2017 - 2030 (USD Million)
- Table 54 Italy dairy alternatives market estimates and forecasts, by source, 2017 - 2030 (USD Million)
- Table 55 Italy dairy alternatives market estimates and forecasts, by product, 2017 - 2030 (USD Million)
- Table 56 Italy dairy alternatives market estimates and forecasts, by distribution channel, 2017 - 2030 (USD Million)
- Table 57 Asia Pacific dairy alternatives market estimates and forecasts, 2017 - 2030 (USD Million)
- Table 58 Asia Pacific dairy alternatives market estimates and forecasts, by source, 2017 - 2030 (USD Million)
- Table 59 Asia Pacific dairy alternatives market estimates and forecasts, by product, 2017 - 2030 (USD Million)
- Table 60 Asia Pacific dairy alternatives market estimates and forecasts, by distribution channel, 2017 - 2030 (USD Million)
- Table 61 China dairy alternatives market estimates and forecasts, 2017 - 2030 (USD Million)
- Table 62 China dairy alternatives market estimates and forecasts, by source, 2017 - 2030 (USD Million)
- Table 63 China dairy alternatives market estimates and forecasts, by product, 2017 - 2030 (USD Million)
- Table 64 China dairy alternatives market estimates and forecasts, by distribution channel, 2017 - 2030 (USD Million)
- Table 65 Japan dairy alternatives market estimates and forecasts, 2017 - 2030 (USD Million)
- Table 66 Japan dairy alternatives market estimates and forecasts, by source, 2017 - 2030 (USD Million)
- Table 67 Japan dairy alternatives market estimates and forecasts, by product, 2017 - 2030 (USD Million)
- Table 68 Japan dairy alternatives market estimates and forecasts, by distribution channel, 2017 - 2030 (USD Million)
- Table 69 India dairy alternatives market estimates and forecasts, 2017 - 2030 (USD Million)
- Table 70 India dairy alternatives market estimates and forecasts, by source, 2017 - 2030 (USD Million)
- Table 71 India dairy alternatives market estimates and forecasts, by product, 2017 - 2030 (USD Million)
- Table 72 India dairy alternatives market estimates and forecasts, by distribution channel, 2017 - 2030 (USD Million)
- Table 73 Australia dairy alternatives market estimates and forecasts, 2017 - 2030 (USD Million)
- Table 74 Australia dairy alternatives market estimates and forecasts, by source, 2017 - 2030 (USD Million)
- Table 75 Australia dairy alternatives market estimates and forecasts, by product, 2017 - 2030 (USD Million)
- Table 76 Australia dairy alternatives market estimates and forecasts, by distribution channel, 2017 - 2030 (USD Million)
- Table 77 Central & South America dairy alternatives market estimates and forecasts, 2017 - 2030 (USD Million)
- Table 78 Central & South America dairy alternatives market estimates and forecasts, by source, 2017 - 2030 (USD Million)
- Table 79 Central & South America dairy alternatives market estimates and forecasts, by product, 2017 - 2030 (USD Million)
- Table 80 Central & South America dairy alternatives market estimates and forecasts, by distribution channel, 2017 - 2030 (USD Million)
- Table 81 Brazil dairy alternatives market estimates and forecasts, 2017 - 2030 (USD Million)
- Table 82 Brazil dairy alternatives market estimates and forecasts, by source, 2017 - 2030 (USD Million)
- Table 83 Brazil dairy alternatives market estimates and forecasts, by product, 2017 - 2030 (USD Million)
- Table 84 Brazil dairy alternatives market estimates and forecasts, by distribution channel, 2017 - 2030 (USD Million)
- Table 85 Middle East & Africa dairy alternatives market estimates and forecasts, 2017 - 2030 (USD Million)
- Table 86 Middle East & Africa dairy alternatives market estimates and forecasts, by source, 2017 - 2030 (USD Million)
- Table 87 Middle East & Africa dairy alternatives market estimates and forecasts, by product, 2017 - 2030 (USD Million)
- Table 88 Middle East & Africa dairy alternatives market estimates and forecasts, by distribution channel, 2017 - 2030 (USD Million)
- Table 89 South Africa dairy alternatives market estimates and forecasts, 2017 - 2030 (USD Million)
- Table 90 South Africa dairy alternatives market estimates and forecasts, by source, 2017 - 2030 (USD Million)
- Table 91 South Africa dairy alternatives market estimates and forecasts, by product, 2017 - 2030 (USD Million)
- Table 92 South Africa dairy alternatives market estimates and forecasts, by distribution channel, 2017 - 2030 (USD Million)
List of Figures
- Fig. 1 Dairy Alternatives Market Segmentation
- Fig. 2 Dairy alternatives market & revenue, 2017 - 2030 (USD Million)
- Fig. 3 Porter's Analysis
- Fig. 4 Supply Chain Implications
- Fig. 5 Raw Materials Analysis
- Fig. 6 Per Capita Consumption of Dairy Products, by Country
- Fig. 7 Porter's Analysis
- Fig. 8 PESTEL Analysis
- Fig. 9 Strategy Framework
Dairy Alternatives Market Growth & Trends:
The global dairy alternatives market size is expected to reach USD 66.9 billion by 2030, according to a new report by Grand View Research, Inc. It is expected to expand at a CAGR of 12.5% from 2022 to 2030. The rise in the demand for plant-based alternatives and changing consumer diets utilizing milk alternatives are driving the demand for dairy alternatives.
The increasing occurrence of milk allergies or cases of lactose intolerance is expected to drive the market further. People with lactose intolerance are increasingly opting for milk alternatives, which has made beverages manufacturers adopt dairy alternatives to appeal to the respective consumer base, thus propelling the demand for dairy alternatives further.
Changing consumer preferences caused by environmental or moral concerns resulting in the mass adoption of vegan or similar diets is expected to positively impact the market growth over the forecast period. Europe has well-established food and beverages industry and has witnessed significant growth in the vegan population, resulting in a high growth rate of dairy alternatives in the region.
Moreover, consumers are opting for more variety in their food and beverage products such as almond milk coffee or coconut panna cotta. Similar dishes with dairy alternatives are becoming available across major industries such as hotels, restaurants, cafes, and in packaged foods. The increased availability of the products has made it easier for consumers to opt for dairy alternatives and products consisting of the same.
Asia Pacific has been the most dominant region in terms of revenue as it consists of numerous emerging economies with a growing population. The growing middle class and increasing disposable income have empowered the consumers to opt for variety in their food choices, Moreover, exposure to westernized foods and diet trends are driving the market further in the region.
The market for dairy alternatives is highly competitive as the established players have already captured a large market share, however, emerging local players are entering the market considering the realized demand for the product. The simplicity of the process and technology has made it easier for the new entrants to infiltrate the market and therefore increase competition in the market. The existing players have been coming up with new products and sources of milk. For instance, a start-up in San Francisco has collaborated with ADM to produce animal-free milk using microflora such as yeast. The product is expected to have all the benefits of cow milk without the raw material.
Dairy Alternatives Market Report Highlights:
- By source, soy held the largest revenue share of over 35.0% in 2021. Soy milk has been traditionally consumed for a long time in many countries and is affordable and easily available worldwide, making it the most dominant source segment in terms of revenue in 2021
- By product, milk accounted for the largest revenue share of over 65.0% in 2021 owing to the high demand for plant-based milk alternatives from lactose-intolerant consumers as well as consumers following a vegan diet. The increasing occurrences of high cholesterol in adults and the elderly have led to numerous consumers opting for dairy alternatives-based products instead of milk products, driving the market further
- By distribution channel, supermarkets and hypermarkets led the market with a revenue share of more than 40.0% in 2021. Developed regions such as North America and Europe have a higher penetration of supermarkets and hypermarkets; meanwhile developing regions are witnessing an increased number of supermarkets and hypermarkets contributing to the high growth rate of this distribution channel
- Asia Pacific dominated the market in 2021 with a share of over 40.0% in terms of revenue, which was followed by North America and Europe, respectively. The easy availability of the product in aseptic packaging enabling convenient storage is expected to result in the increased adoption of the product over the forecast period
- The investments related to the plant-based and alternative food sector are increasing as the market for the same is growing. For instance, an investment issuer called EAT BEYOND GLOBAL HOLDINGS INC. added Plant Power Restaurant Group, LLC to its portfolio, which has vegan beverages such as shakes. The deal aims to target a larger consumer base that eats fast food but prefers vegan alternatives
Table of Contents
Chapter 1. Methodology and Scope
- 1.1. Market Segmentation & Scope
- 1.2. Market Definition
- 1.3. Information Procurement
- 1.3.1. Purchased Database
- 1.3.2. GVR's Internal Database
- 1.3.3. Secondary Sources & Third-Party Perspectives
- 1.3.4. Primary Research
- 1.4. Information Analysis
- 1.4.1. Data Analysis Models
- 1.5. Market Formulation & Data Visualization
- 1.6. Data Validation & Publishing
Chapter 2. Executive Summary
- 2.1. Market Outlook
- 2.2. Segmental Outlook
- 2.3. Competitive Insights
Chapter 3. Market Variables, Trends, and Scope
- 3.1. Market Lineage
- 3.2. Penetration & Growth Prospect Mapping
- 3.3. Industry Value Chain Analysis
- 3.3.1. Major Raw Material Trends Analysis
- 3.3.2. Manufacturing Trends
- 3.4. Sales Channel Analysis
- 3.5. Technology Framework
- 3.6. Regulatory Framework
- 3.7. Dairy Alternatives Market - Market Dynamics
- 3.7.1. Market Driver Analysis
- 3.7.2. Market Restraint Analysis
- 3.7.3. Industry Challenges
- 3.8. Business Environmental Tools Analysis: Dairy Alternatives Market
- 3.8.1. Porter's Five Forces Analysis
- 3.8.1.1. Bargaining Power of Suppliers
- 3.8.1.2. Bargaining Power of Buyers
- 3.8.1.3. Threat of Substitution
- 3.8.1.4. Threat of New Entrants
- 3.8.1.5. Competitive Rivalry
- 3.8.2. PESTLE Analysis
- 3.8.2.1. Political Landscape
- 3.8.2.2. Economic Landscape
- 3.8.2.3. Social Landscape
- 3.8.2.4. Technology Landscape
- 3.8.2.5. Environmental Landscape
- 3.8.2.6. Legal Landscape
- 3.8.1. Porter's Five Forces Analysis
- 3.9. Major Strategic Deals & Alliances
- 3.10. Market Strategies
- 3.10.1. Impact of COVID-19
Chapter 4. Dairy Alternatives market: Source Estimates & Trend Analysis
- 4.1. Definitions & Scope
- 4.2. Dairy Alternatives market: Source Movement Analysis, 2021 & 2030
- 4.3. Soy
- 4.3.1. Market estimates and forecasts, 2017 - 2030 (USD Million)
- 4.4. Almond
- 4.4.1. Market estimates and forecasts, 2017 - 2030 (USD Million)
- 4.5. Coconut
- 4.5.1. Market estimates and forecasts, 2017 - 2030 (USD Million)
- 4.6. Rice
- 4.6.1. Market estimates and forecasts, 2017 - 2030 (USD Million)
- 4.7. Oats
- 4.7.1. Market estimates and forecasts, 2017 - 2030 (USD Million)
- 4.8. Others
- 4.8.1. Market estimates and forecasts, 2017 - 2030 (USD Million)
Chapter 5. Dairy Alternatives market: Product Estimates & Trend Analysis
- 5.1. Dairy Alternatives market: Product Movement Analysis, 2021 & 2030
- 5.2. Milk
- 5.2.1. Market estimates and forecasts, 2017 - 2030 (USD Million)
- 5.3. Yogurt
- 5.3.1. Market estimates and forecasts, 2017 - 2030 (USD Million)
- 5.4. Cheese
- 5.4.1. Market estimates and forecasts, 2017 - 2030 (USD Million)
- 5.5. Ice-cream
- 5.5.1. Market estimates and forecasts, 2017 - 2030 (USD Million)
- 5.6. Creamer
- 5.6.1. Market estimates and forecasts, 2017 - 2030 (USD Million)
- 5.7. Others
- 5.7.1. Market estimates and forecasts, 2017 - 2030 (USD Million)
Chapter 6. Dairy Alternatives Market: Distribution Channel Estimates & Trend Analysis
- 6.1. Dairy Alternatives Market: Distribution Channel Movement Analysis, 2021 & 2030
- 6.2. Supermarket & Hypermarket
- 6.2.1. Market estimates and forecasts, 2017 - 2030 (USD Million)
- 6.3. Convenience Store
- 6.3.1. Market estimates and forecasts, 2017 - 2030 (USD Million)
- 6.4. Online Retail
- 6.4.1. Market estimates and forecasts, 2017 - 2030 (USD Million)
- 6.5. Others
- 6.5.1. Market estimates and forecasts, 2017 - 2030 (USD Million)
Chapter 7. Dairy Alternatives market: Regional Estimates & Trend Analysis
- 7.1. Dairy Alternatives market: Regional movement analysis, 2021 & 2030
- 7.2. North America
- 7.2.1. Market estimates and forecasts, 2017 - 2030 (USD Million)
- 7.2.2. Market estimates and forecasts, by source, 2017 - 2030 (USD Million)
- 7.2.3. Market estimates and forecasts, by product, 2017 - 2030 (USD Million)
- 7.2.4. Market estimates and forecasts, by distribution channel, 2017 - 2030 (USD Million)
- 7.2.5. U.S.
- 7.2.5.1. Market estimates and forecasts, 2017 - 2030 (USD Million)
- 7.2.5.2. Market estimates and forecasts, by source, 2017 - 2030 (USD Million)
- 7.2.5.3. Market estimates and forecasts, by product, 2017 - 2030 (USD Million)
- 7.2.5.4. Market estimates and forecasts, by distribution channel, 2017 - 2030 (USD Million)
- 7.2.6. Canada
- 7.2.6.1. Market estimates and forecasts, 2017 - 2030 (USD Million)
- 7.2.6.2. Market estimates and forecasts, by source, 2017 - 2030 (USD Million)
- 7.2.6.3. Market estimates and forecasts, by product, 2017 - 2030 (USD Million)
- 7.2.6.4. Market estimates and forecasts, by distribution channel, 2017 - 2030 (USD Million)
- 7.2.7. Mexico
- 7.2.7.1. Market estimates and forecasts, 2017 - 2030 (USD Million)
- 7.2.7.2. Market estimates and forecasts, by source, 2017 - 2030 (USD Million)
- 7.2.7.3. Market estimates and forecasts, by product, 2017 - 2030 (USD Million)
- 7.2.7.4. Market estimates and forecasts, by distribution channel, 2017 - 2030 (USD Million)
- 7.3. Europe
- 7.3.1. Market estimates and forecasts, 2017 - 2030 (USD Million)
- 7.3.2. Market estimates and forecasts, by source, 2017 - 2030 (USD Million)
- 7.3.3. Market estimates and forecasts, by product, 2017 - 2030 (USD Million)
- 7.3.4. Market estimates and forecasts, by distribution channel, 2017 - 2030 (USD Million)
- 7.3.5. Germany
- 7.3.5.1. Market estimates and forecasts, 2017 - 2030 (USD Million)
- 7.3.5.2. Market estimates and forecasts, by source, 2017 - 2030 (USD Million)
- 7.3.5.3. Market estimates and forecasts, by product, 2017 - 2030 (USD Million)
- 7.3.5.4. Market estimates and forecasts, by distribution channel, 2017 - 2030 (USD Million)
- 7.3.6. U.K.
- 7.3.6.1. Market estimates and forecasts, 2017 - 2030 (USD Million)
- 7.3.6.2. Market estimates and forecasts, by source, 2017 - 2030 (USD Million)
- 7.3.6.3. Market estimates and forecasts, by product, 2017 - 2030 (USD Million)
- 7.3.6.4. Market estimates and forecasts, by distribution channel, 2017 - 2030 (USD Million)
- 7.3.7. France
- 7.3.7.1. Market estimates and forecasts, 2017 - 2030 (USD Million)
- 7.3.7.2. Market estimates and forecasts, by source, 2017 - 2030 (USD Million)
- 7.3.7.3. Market estimates and forecasts, by product, 2017 - 2030 (USD Million)
- 7.3.7.4. Market estimates and forecasts, by distribution channel, 2017 - 2030 (USD Million)
- 7.3.8. Italy
- 7.3.8.1. Market estimates and forecasts, 2017 - 2030 (USD Million)
- 7.3.8.2. Market estimates and forecasts, by source, 2017 - 2030 (USD Million)
- 7.3.8.3. Market estimates and forecasts, by product, 2017 - 2030 (USD Million)
- 7.3.8.4. Market estimates and forecasts, by distribution channel, 2017 - 2030 (USD Million)
- 7.3.9. Spain
- 7.3.9.1. Market estimates and forecasts, 2017 - 2030 (USD Million)
- 7.3.9.2. Market estimates and forecasts, by source, 2017 - 2030 (USD Million)
- 7.3.9.3. Market estimates and forecasts, by product, 2017 - 2030 (USD Million)
- 7.3.9.4. Market estimates and forecasts, by distribution channel, 2017 - 2030 (USD Million)
- 7.4. Asia Pacific
- 7.4.1. Market estimates and forecasts, 2017 - 2030 (USD Million)
- 7.4.2. Market estimates and forecasts, by source, 2017 - 2030 (USD Million)
- 7.4.3. Market estimates and forecasts, by product, 2017 - 2030 (USD Million)
- 7.4.4. Market estimates and forecasts, by distribution channel, 2017 - 2030 (USD Million)
- 7.4.5. China
- 7.4.5.1. Market estimates and forecasts, 2017 - 2030 (USD Million)
- 7.4.5.2. Market estimates and forecasts, by source, 2017 - 2030 (USD Million)
- 7.4.5.3. Market estimates and forecasts, by product, 2017 - 2030 (USD Million)
- 7.4.5.4. Market estimates and forecasts, by distribution channel, 2017 - 2030 (USD Million)
- 7.4.6. India
- 7.4.6.1. Market estimates and forecasts, 2017 - 2030 (USD Million)
- 7.4.6.2. Market estimates and forecasts, by source, 2017 - 2030 (USD Million)
- 7.4.6.3. Market estimates and forecasts, by product, 2017 - 2030 (USD Million)
- 7.4.6.4. Market estimates and forecasts, by distribution channel, 2017 - 2030 (USD Million)
- 7.4.7. Japan
- 7.4.7.1. Market estimates and forecasts, 2017 - 2030 (USD Million)
- 7.4.7.2. Market estimates and forecasts, by source, 2017 - 2030 (USD Million)
- 7.4.7.3. Market estimates and forecasts, by product, 2017 - 2030 (USD Million)
- 7.4.7.4. Market estimates and forecasts, by distribution channel, 2017 - 2030 (USD Million)
- 7.4.8. Australia
- 7.4.8.1. Market estimates and forecasts, 2017 - 2030 (USD Million)
- 7.4.8.2. Market estimates and forecasts, by source, 2017 - 2030 (USD Million)
- 7.4.8.3. Market estimates and forecasts, by product, 2017 - 2030 (USD Million)
- 7.4.8.4. Market estimates and forecasts, by distribution channel, 2017 - 2030 (USD Million)
- 7.5. Central & South America
- 7.5.1. Market estimates and forecasts, 2017 - 2030 (USD Million)
- 7.5.2. Market estimates and forecasts, by source, 2017 - 2030 (USD Million)
- 7.5.3. Market estimates and forecasts, by product, 2017 - 2030 (USD Million)
- 7.5.4. Market estimates and forecasts, by distribution channel, 2017 - 2030 (USD Million)
- 7.5.5. Brazil
- 7.5.5.1. Market estimates and forecasts, 2017 - 2030 (USD Million)
- 7.5.5.2. Market estimates and forecasts, by source, 2017 - 2030 (USD Million)
- 7.5.5.3. Market estimates and forecasts, by product, 2017 - 2030 (USD Million)
- 7.5.5.4. Market estimates and forecasts, by distribution channel, 2017 - 2030 (USD Million)
- 7.6. Middle East & Africa
- 7.6.1. Market estimates and forecasts, 2017 - 2030 (USD Million)
- 7.6.2. Market estimates and forecasts, by source, 2017 - 2030 (USD Million)
- 7.6.3. Market estimates and forecasts, by product, 2017 - 2030 (USD Million)
- 7.6.4. Market estimates and forecasts, by distribution channel, 2017 - 2030 (USD Million)
- 7.6.5. South Africa
- 7.6.5.1. Market estimates and forecasts, 2017 - 2030 (USD Million)
- 7.6.5.2. Market estimates and forecasts, by source, 2017 - 2030 (USD Million)
- 7.6.5.3. Market estimates and forecasts, by product, 2017 - 2030 (USD Million)
- 7.6.5.4. Market estimates and forecasts, by distribution channel, 2017 - 2030 (USD Million)
Chapter 8. Competitive Landscape
- 8.1. Key Global Players, Their Initiatives, & Its Impact on the Market
- 8.2. Key Company/Competition Categorization
- 8.3. Vendor Landscape
- 8.3.1. List of Key Distributors & Channel Partners
- 8.4. Public Companies
- 8.4.1. Company Market Position Analysis
- 8.4.2. Company Market Share/Ranking
- 8.4.3. Competitive Dashboard Analysis
- 8.4.3.1. Market Differentiators
- 8.4.3.2. Synergy Analysis
- 8.5. Private Companies
- 8.5.1. Key Emerging Companies
- 8.5.2. Geographical Presence
- 8.5.3. Company Market Position Analysis
Chapter 9. Company Profiles
- 9.1. ADM
- 9.1.1. Company overview
- 9.1.2. Financial performance
- 9.1.3. Technology benchmarking
- 9.1.4. Strategic initiatives
- 9.2. The Whitewave Foods Company
- 9.2.1. Company overview
- 9.2.2. Financial performance
- 9.2.3. Technology benchmarking
- 9.2.4. Strategic initiatives
- 9.3. The Hain Celestial Group, Inc.
- 9.3.1. Company overview
- 9.3.2. Financial performance
- 9.3.3. Technology benchmarking
- 9.3.4. Strategic initiatives
- 9.4. Daiya Foods Inc.
- 9.4.1. Company overview
- 9.4.2. Financial performance
- 9.4.3. Technology benchmarking
- 9.4.4. Strategic initiatives
- 9.5. Eden Foods, Inc.
- 9.5.1. Company overview
- 9.5.2. Financial performance
- 9.5.3. Technology benchmarking
- 9.5.4. Strategic initiatives
- 9.6. Nutriops, S.L.
- 9.6.1. Company overview
- 9.6.2. Financial performance
- 9.6.3. Technology benchmarking
- 9.6.4. Strategic initiatives
- 9.7. Earth's Own Food Company
- 9.7.1. Company overview
- 9.7.2. Financial performance
- 9.7.3. Technology benchmarking
- 9.7.4. Strategic initiatives
- 9.8. SunOpta Inc.
- 9.8.1. Company overview
- 9.8.2. Financial performance
- 9.8.3. Technology benchmarking
- 9.8.4. Strategic initiatives
- 9.9. Freedom Foods Group Ltd.
- 9.9.1. Company overview
- 9.9.2. Financial performance
- 9.9.3. Technology benchmarking
- 9.9.4. Strategic initiatives
- 9.10. OATLY AB
- 9.10.1. Company overview
- 9.10.2. Financial performance
- 9.10.3. Technology benchmarking
- 9.11. Blue Diamond Growers
- 9.11.1. Company overview
- 9.11.2. Financial performance
- 9.11.3. Technology benchmarking
- 9.11.4. Strategic initiatives
- 9.12. CP Kelco
- 9.12.1. Company overview
- 9.12.2. Financial performance
- 9.12.3. Technology benchmarking
- 9.12.4. Strategic initiatives
- 9.13. Vitasoy International Holdings Limited
- 9.13.1. Company overview
- 9.13.2. Financial performance
- 9.13.3. Technology benchmarking
- 9.13.4. Strategic initiatives
- 9.14. Organic Valley Family of Farms
- 9.14.1. Company overview
- 9.14.2. Financial performance
- 9.14.3. Technology benchmarking
- 9.15. Living Harvest Foods Inc.
- 9.15.1. Company overview
- 9.15.2. Financial performance
- 9.15.3. Technology benchmarking