|
|
市場調査レポート
商品コード
1701391
コアバンキングソフトウェアの市場規模、シェア、動向分析レポート:コンポーネント別、展開別、最終用途別、地域別、セグメント別予測、2025年~2030年Core Banking Software Market Size, Share & Trends Analysis Report By Component (Solution, Service), By Deployment (Cloud, On-premise), By End-use (Banks, Financial Institutions), By Region, And Segment Forecasts, 2025 - 2030 |
||||||
|
|||||||
カスタマイズ可能
|
|||||||

| コアバンキングソフトウェアの市場規模、シェア、動向分析レポート:コンポーネント別、展開別、最終用途別、地域別、セグメント別予測、2025年~2030年 |
|
出版日: 2025年03月26日
発行: Grand View Research
ページ情報: 英文 130 Pages
納期: 2~10営業日
|

全表示
- 概要
- 図表
- 目次
コアバンキングソフトウェア市場の成長と動向
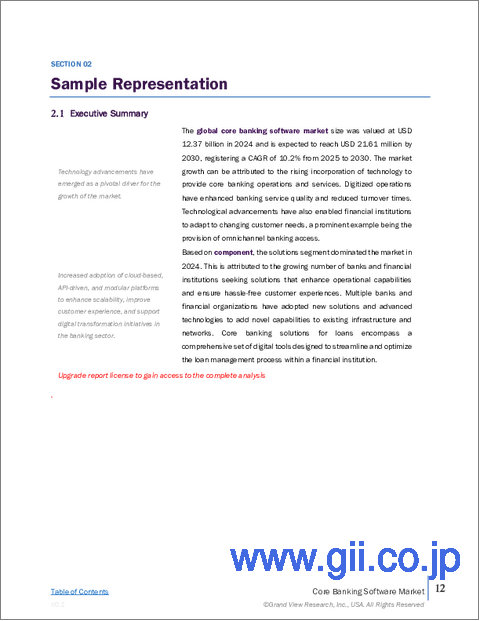
Grand View Research, Inc.の最新レポートによると、世界のコアバンキングソフトウェア市場規模は、2025~2030年にかけてCAGR 10.2%で拡大し、2030年には216億1,000万米ドルに達すると推定されています。
同市場の拡大は、銀行や金融機関によるコアバンキング技術の採用が世界規模で急増していることに起因しています。この技術的進歩により、世界中の多くの銀行でフロント、ミドル、バックオフィス業務の同期化が促進されています。
コアバンキングソフトウェアによって、銀行や金融機関は業務の規模を拡大し、規模の経済を実現することができます。さらに、デジタル銀行やオンライン銀行の台頭により、便利で使いやすいチャネルに対する顧客の嗜好が変化しています。コアバンキングソフトウェアソリューションは、伝統的銀行の技術革新、新商品の迅速な発売、市場投入までの時間の短縮を支援します。
近年、銀行が利用できる構造化データと非構造化データの量は大幅に増加しています。自動化により、銀行は先進的分析ツールを活用して顧客データを調査し、パターンや動向を特定することができます。予測分析により、銀行は顧客の嗜好や行動、潜在的なニーズを予測し、対象を絞ったタイムリーな提案や推奨を行うことができます。
パンデミックは、適応するための技術を持たない金融機関に悪影響を与えました。当初、銀行などの企業は驚きを隠せなかったが、業務継続のための技術強化の必要性に気づいた。デジタルトランスフォーメーションへの取り組みの加速は、予測期間中の市場成長にとって好材料となることが期待されます。
コアバンキングソフトウェア市場レポートハイライト
- ソリューションセグメントでは、エンタープライズカスタマーソリューションセグメントが予測期間中に大きく成長すると予想されます。エンタープライズカスタマーソリューションは、顧客が銀行で行うあらゆる取引を銀行が効率的に追跡・処理するのに役立ちます。また、業務の効率化にも役立ちます。
- コアバンキングのマネージドサービスモデルは、優れた使いやすさ、包括的な機能性、バグ解決、タイムリーな機能強化を保証することで、銀行や金融機関に競争上の優位性を記載しています。現代の金融機関では、複数の複雑なシステムを同時に運用し、シームレスなサービス提供と最適な可用性を確保する必要があります。このような側面から、予測される期間を通じてマネージドサービスへの需要が高まると予想されます。
- オンサイトで展開される従来のインフラでは、多額の初期費用と継続的な維持費が必要となります。クラウドコンピューティングは、金融機関が消費主導型のアプローチに基づいてリソースを調達できるため、コストのかかるハードウェアやインフラの要件を払拭します。この財務的に効率的なパラダイムは、銀行の情報技術支出の最適化を支援します。
- 銀行の生産性と業務効率を高める必要性が高まっていることから、予測期間を通じて銀行セクターにおけるコアバンキングソフトウェアの普及が進むと予測されます。コアバンキングソフトウェアによって、顧客は自分の口座を世界に管理できるようになり、同時に銀行業務や取引の複雑さも合理化されます。
- アジア太平洋は、予測期間中に最も急成長する市場になると予測されています。成長の主要要因は、スマートフォンとデジタルサービスの高い普及率です。さらに、若者の間で最新技術の利用に対する意識が高まっていることも、成長の原動力になると予想されます。
目次
第1章 調査手法と範囲
第2章 エグゼクティブサマリー
第3章 コアバンキングソフトウェアの変数、動向、範囲
- 市場系統の展望
- 市場力学
- 市場促進要因分析
- 市場抑制要因分析
- 産業の課題
- コアバンキングソフトウェア分析ツール
- 産業分析-ポーターのファイブフォース分析
- PESTEL分析
第4章 コアバンキングソフトウェア市場:コンポーネント別、推定・動向分析
- セグメントダッシュボード
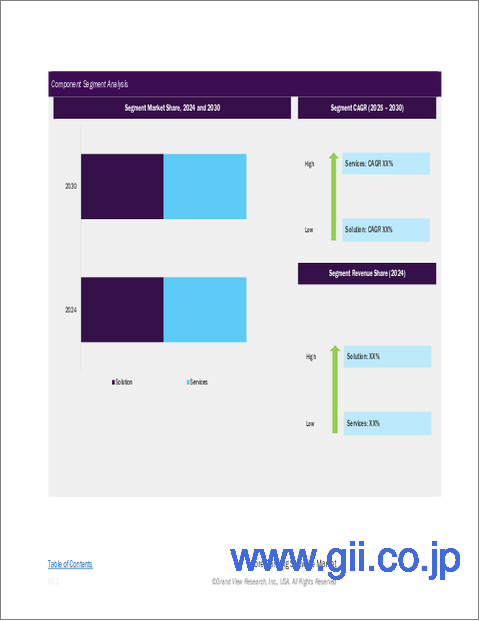
- コアバンキングソフトウェア市場:コンポーネント変動分析、100万米ドル、2024年と2030年
- ソリューション
- 預金
- ローン
- エンタープライズ顧客ソリューション
- その他
- サービス
- プロフェッショナルサービス
- マネージドサービス
第5章 コアバンキングソフトウェア市場:展開別、推定・動向分析
- セグメントダッシュボード
- コアバンキングソフトウェア市場:展開変動分析、100万米ドル、2024年と2030年
- クラウド
- オンプレミス
第6章 コアバンキングソフトウェア市場:最終用途別、推定・動向分析
- セグメントダッシュボード
- コアバンキングソフトウェア市場:最終用途変動分析、100万米ドル、2024年と2030年
- 銀行
- 金融機関
- その他
第7章 コアバンキングソフトウェア市場の地域別、推定・動向分析
- コアバンキングソフトウェア市場シェア(地域別、2024年と2030年、100万米ドル)
- 北米
- 北米のコアバンキングソフトウェア市場推定・予測、2018~2030年
- 米国
- カナダ
- 欧州
- 欧州のコアバンキングソフトウェア市場推定・予測、2018~2030年
- 英国
- ドイツ
- フランス
- アジア太平洋
- アジア太平洋のコアバンキングソフトウェア市場推定・予測、2018~2030年
- 中国
- インド
- 日本
- オーストラリア
- 韓国
- ラテンアメリカ
- ラテンアメリカのコアバンキングソフトウェア市場推定・予測、2018~2030年
- ブラジル
- メキシコ
- 中東・アフリカ
- 中東・アフリカのコアバンキングソフトウェア市場推定・予測、2018~2030年
- アラブ首長国連邦
- サウジアラビア
- 南アフリカ
第8章 競合情勢
- 企業分類
- 企業の市場ポジショニング
- 企業ヒートマップ分析
- 企業プロファイル/上場企業
- Capgemini
- Finastra
- FIS
- Fiserv, Inc.
- HCL Technologies Limited
- Infosys Limited
- Jack Henry & Associates, Inc.
- Oracle Corporation
- Temenos Group
- Unisys
List of Tables
- Table 1 Global core banking software market, by region, 2018 - 2030 (USD Million)
- Table 2 Global core banking software market, by component, 2018 - 2030 (USD Million)
- Table 3 Global core banking software market, by deployment, 2018 - 2030 (USD Million)
- Table 4 Global core banking software market, by end use, 2018 - 2030 (USD Million)
- Table 5 North America core banking software market, by country, 2018 - 2030 (USD Million)
- Table 6 North America core banking software market, by component, 2018 - 2030 (USD Million)
- Table 7 North America core banking software market, by deployment, 2018 - 2030 (USD Million)
- Table 8 North America core banking software market, by end use, 2018 - 2030 (USD Million)
- Table 9 U.S. core banking software market, by component, 2018 - 2030 (USD Million)
- Table 10 U.S. core banking software market, by deployment, 2018 - 2030 (USD Million)
- Table 11 U.S. core banking software market, by end use, 2018 - 2030 (USD Million)
- Table 12 Canada core banking software market, by component, 2018 - 2030 (USD Million)
- Table 13 Canada core banking software market, by deployment, 2018 - 2030 (USD Million)
- Table 14 Canada core banking software market, by end use, 2018 - 2030 (USD Million)
- Table 15 Europe core banking software market, by country, 2018 - 2030 (USD Million)
- Table 16 Europe core banking software market, by component, 2018 - 2030 (USD Million)
- Table 17 Europe core banking software market, by deployment, 2018 - 2030 (USD Million)
- Table 18 Europe core banking software market, by end use, 2018 - 2030 (USD Million)
- Table 19 UK core banking software market, by component, 2018 - 2030 (USD Million)
- Table 20 UK core banking software market, by deployment, 2018 - 2030 (USD Million)
- Table 21 UK core banking software market, by end use, 2018 - 2030 (USD Million)
- Table 22 Germany core banking software market, by component, 2018 - 2030 (USD Million)
- Table 23 Germany core banking software market, by deployment, 2018 - 2030 (USD Million)
- Table 24 Germany core banking software market, by end use, 2018 - 2030 (USD Million)
- Table 25 France core banking software market, by component, 2018 - 2030 (USD Million)
- Table 26 France core banking software market, by deployment, 2018 - 2030 (USD Million)
- Table 27 France core banking software market, by end use, 2018 - 2030 (USD Million)
- Table 28 Asia Pacific core banking software market, by country, 2018 - 2030 (USD Million)
- Table 29 Asia Pacific core banking software market, by component, 2018 - 2030 (USD Million)
- Table 30 Asia Pacific core banking software market, by deployment, 2018 - 2030 (USD Million)
- Table 31 Asia Pacific core banking software market, by end use, 2018 - 2030 (USD Million)
- Table 32 China core banking software market, by component, 2018 - 2030 (USD Million)
- Table 33 China core banking software market, by deployment, 2018 - 2030 (USD Million)
- Table 34 China core banking software market, by end use, 2018 - 2030 (USD Million)
- Table 35 India core banking software market, by component, 2018 - 2030 (USD Million)
- Table 36 India core banking software market, by deployment, 2018 - 2030 (USD Million)
- Table 37 India core banking software market, by end use, 2018 - 2030 (USD Million)
- Table 38 Japan core banking software market, by component, 2018 - 2030 (USD Million)
- Table 39 Japan core banking software market, by deployment, 2018 - 2030 (USD Million)
- Table 40 Japan core banking software market, by end use, 2018 - 2030 (USD Million)
- Table 41 South Korea core banking software market, by component, 2018 - 2030 (USD Million)
- Table 42 South Korea core banking software market, by deployment, 2018 - 2030 (USD Million)
- Table 43 South Korea core banking software market, by end use, 2018 - 2030 (USD Million)
- Table 44 Australia core banking software market, by component, 2018 - 2030 (USD Million)
- Table 45 Australia core banking software market, by deployment, 2018 - 2030 (USD Million)
- Table 46 Australia core banking software market, by end use, 2018 - 2030 (USD Million)
- Table 47 Latin America core banking software market, by country, 2018 - 2030 (USD Million)
- Table 48 Latin America core banking software market, by component, 2018 - 2030 (USD Million)
- Table 49 Latin America core banking software market, by deployment, 2018 - 2030 (USD Million)
- Table 50 Latin America core banking software market, by end use, 2018 - 2030 (USD Million)
- Table 51 Brazil core banking software market, by component, 2018 - 2030 (USD Million)
- Table 52 Brazil core banking software market, by deployment, 2018 - 2030 (USD Million)
- Table 53 Brazil core banking software market, by end use, 2018 - 2030 (USD Million)
- Table 54 Mexico core banking software market, by component, 2018 - 2030 (USD Million)
- Table 55 Mexico core banking software market, by deployment, 2018 - 2030 (USD Million)
- Table 56 Mexico core banking software market, by end use, 2018 - 2030 (USD Million)
- Table 57 MEA core banking software market, by country, 2018 - 2030 (USD Million)
- Table 58 MEA core banking software market, by component, 2018 - 2030 (USD Million)
- Table 59 MEA core banking software market, by deployment, 2018 - 2030 (USD Million)
- Table 60 MEA core banking software market, by end use, 2018 - 2030 (USD Million)
- Table 61 UAE core banking software market, by component, 2018 - 2030 (USD Million)
- Table 62 UAE core banking software market, by deployment, 2018 - 2030 (USD Million)
- Table 63 UAE core banking software market, by end use, 2018 - 2030 (USD Million)
- Table 64 Saudi Arabia core banking software market, by component, 2018 - 2030 (USD Million)
- Table 65 Saudi Arabia core banking software market, by deployment, 2018 - 2030 (USD Million)
- Table 66 Saudi Arabia core banking software market, by end use, 2018 - 2030 (USD Million)
- Table 67 South Africa core banking software market, by component, 2018 - 2030 (USD Million)
- Table 68 South Africa core banking software market, by deployment, 2018 - 2030 (USD Million)
- Table 69 South Africa core banking software market, by end use, 2018 - 2030 (USD Million)
List of Figures
- Fig. 1 Core banking software market segmentation
- Fig. 2 Market research process
- Fig. 3 Information procurement
- Fig. 4 Primary research pattern
- Fig. 5 Market research approaches
- Fig. 6 Value chain-based sizing & forecasting
- Fig. 7 Parent market analysis
- Fig. 8 Market formulation & validation
- Fig. 9 Core banking software market snapshot
- Fig. 10 Core banking software market segment snapshot
- Fig. 11 Core banking software market competitive landscape snapshot
- Fig. 12 Market research process
- Fig. 13 Market driver relevance analysis (Current & future impact)
- Fig. 14 Market restraint relevance analysis (Current & future impact)
- Fig. 15 Core banking software market: Component outlook key takeaways (USD Million)
- Fig. 16 Core banking software market: Component movement analysis 2024 & 2030 (USD Million)
- Fig. 17 Solution market revenue estimates and forecasts, 2018 - 2030 (USD Million)
- Fig. 18 Deposits market revenue estimates and forecasts, 2018 - 2030 (USD Million)
- Fig. 19 Loans market revenue estimates and forecasts, 2018 - 2030 (USD Million)
- Fig. 20 Enterprise customer solutions market revenue estimates and forecasts, 2018 - 2030 (USD Million)
- Fig. 21 Others market revenue estimates and forecasts, 2018 - 2030 (USD Million)
- Fig. 22 Service market revenue estimates and forecasts, 2018 - 2030 (USD Million)
- Fig. 23 Professional service market revenue estimates and forecasts, 2018 - 2030 (USD Million)
- Fig. 24 Managed service market revenue estimates and forecasts, 2018 - 2030 (USD Million)
- Fig. 25 Core banking software market: Deployment outlook key takeaways (USD Million)
- Fig. 26 Core banking software market: Deployment movement analysis 2024 & 2030 (USD Million)
- Fig. 27 Cloud deployment market revenue estimates and forecasts, 2018 - 2030 (USD Million)
- Fig. 28 On-premise deployment market revenue estimates and forecasts, 2018 - 2030 (USD Million)
- Fig. 29 Core banking software market: End Use outlook key takeaways (USD Million)
- Fig. 30 Core banking software market: End Use movement analysis 2024 & 2030 (USD Million)
- Fig. 31 Banks market revenue estimates and forecasts, 2018 - 2030 (USD Million)
- Fig. 32 Financial institution market revenue estimates and forecasts, 2018 - 2030 (USD Million)
- Fig. 33 Others market revenue estimates and forecasts, 2018 - 2030 (USD Million)
- Fig. 34 Regional marketplace: Key takeaways
- Fig. 35 Core banking software market: Regional outlook, 2024 & 2030, USD Million
- Fig. 36 North America Core banking software market estimates and forecasts, 2018 - 2030 (USD Million)
- Fig. 37 U.S. Core banking software market estimates and forecasts, 2018 - 2030 (USD Million)
- Fig. 38 Canada Core banking software market estimates and forecasts, 2018 - 2030 (USD Million)
- Fig. 39 Europe Core banking software market estimates and forecasts, 2018 - 2030 (USD Million
- Fig. 40 UK Core banking software market estimates and forecasts, 2018 - 2030 (USD Million)
- Fig. 41 Germany Core banking software market estimates and forecasts, 2018 - 2030 (USD Million)
- Fig. 42 France Core banking software market estimates and forecasts, 2018 - 2030 (USD Million)
- Fig. 43 Asia Pacific Core banking software market estimates and forecasts, 2018 - 2030 (USD Million)
- Fig. 44 China Core banking software market estimates and forecasts, 2018 - 2030 (USD Million)
- Fig. 45 India Core banking software market estimates and forecasts, 2018 - 2030 (USD Million)
- Fig. 46 Japan Core banking software market estimates and forecasts, 2018 - 2030 (USD Million)
- Fig. 47 South Korea Core banking software market estimates and forecasts, 2018 - 2030 (USD Million)
- Fig. 48 Australia Core banking software market estimates and forecasts, 2018 - 2030 (USD Million)
- Fig. 49 Latin America Core banking software market estimates and forecasts, 2018 - 2030 (USD Million)
- Fig. 50 Brazil Core banking software market estimates and forecasts, 2018 - 2030 (USD Million)
- Fig. 51 Mexico Core banking software market estimates and forecasts, 2018 - 2030 (USD Million)
- Fig. 52 MEA Core banking software market estimates and forecasts, 2018 - 2030 (USD Million)
- Fig. 53 UAE Core banking software market estimates and forecasts, 2018 - 2030 (USD Million)
- Fig. 54 Saudi Arabia Core banking software market estimates and forecasts, 2018 - 2030 (USD Million)
- Fig. 55 South Africa Core banking software market estimates and forecasts, 2018 - 2030 (USD Million)
- Fig. 56 Strategy framework
- Fig. 57 Company categorization
Core Banking Software Market Growth & Trends:
The global core banking software market size is estimated to reach USD 21.61 billion by 2030, expanding at a CAGR of 10.2% from 2025 to 2030, according to a new report by Grand View Research, Inc. The expansion of the market can be accredited to the upsurge in the embrace of core banking technology by banks and financial institutions on a global scale. This technological advancement is facilitating the synchronization of front, middle, and back-office operations for numerous banks worldwide.
Core banking software enables banks and financial institutions to scale operations and achieve economies of scale. Moreover, the rise of digital and online banks has changed customer preferences for convenient and easy-to-use channels. Core banking software solutions help traditional banks innovate, launch new products quickly, and reduce time to market.
In recent years, the amount of structured and unstructured data available to banks has increased significantly. Automation enables banks to leverage advanced analytics tools to study customer data and identify patterns and trends. With predictive analytics, banks can anticipate customer preferences, behavior, and potential needs, enabling them to offer targeted and timely offers and recommendations.
The pandemic adversely affected financial institutions that lacked the technology to adapt. While initially, firms, such as banks, were taken aback, they realized the need for technological enhancements for continued operations. The accelerated digital transformation initiatives are expected to bode well for market growth over the forecast period.
Core Banking Software Market Report Highlights:
- Within the solutions segment, the enterprise customer solutions segment is expected to grow significantly over the forecast period. Enterprise customer solutions help banks effectively track and process every transaction that a customer does at a bank. It also helps in improving the efficiency of operations
- The core banking managed services model provides banks and financial institutions with a competitive advantage by guaranteeing superior user-friendliness, comprehensive functionality, bug resolution, and timely enhancements. Contemporary financial institutions require several intricate systems to operate concurrently, ensuring seamless service provision and optimal availability. This aspect is anticipated to bolster the requirement for managed services throughout the projected timeframe
- Traditional infrastructure deployed on-site necessitates substantial initial expenditures and continuous upkeep expenses. Cloud computing eradicates the requirement for costly hardware and infrastructure, as financial institutions can procure resources based on a consumption-driven approach. This financially efficient paradigm assists banks in optimizing their information technology expenditures
- The growing necessity to enhance the productivity and operational effectiveness of banks is projected to propel the uptake of core banking software within the banking sector throughout the forecast period. Core banking software empowers customers to oversee their accounts globally, concurrently streamlining the intricacies of banking operations and transactions
- The Asia Pacific region is anticipated to emerge as the fastest-growing market over the forecast period. The primary drivers of growth include the high penetration of smartphones and digital services. Moreover, rising awareness of the use of the latest technology among the youth is expected to drive growth
Table of Contents
Chapter 1. Methodology and Scope
- 1.1. Market Segmentation and Scope
- 1.2. Research Methodology
- 1.2.1. Information Procurement
- 1.3. Information or Data Analysis
- 1.4. Methodology
- 1.5. Research Scope and Assumptions
- 1.6. Market Formulation & Validation
- 1.7. List of Data Sources
Chapter 2. Executive Summary
- 2.1. Market Outlook
- 2.2. Segment Outlook
- 2.3. Competitive Insights
Chapter 3. Core Banking Software Variables, Trends, & Scope
- 3.1. Market Lineage Outlook
- 3.2. Market Dynamics
- 3.2.1. Market Drivers Analysis
- 3.2.2. Market Restraints Analysis
- 3.2.3. Industry Challenge
- 3.3. Core banking software Analysis Tools
- 3.3.1. Industry Analysis - Porter's
- 3.3.1.1. Bargaining Power of the Suppliers
- 3.3.1.2. Bargaining Power of the Buyers
- 3.3.1.3. Threats of Substitution
- 3.3.1.4. Threats from New Entrants
- 3.3.1.5. Competitive Rivalry
- 3.3.2. PESTEL Analysis
- 3.3.1. Industry Analysis - Porter's
Chapter 4. Core Banking Software Market: Component Estimates & Trend Analysis
- 4.1. Segment Dashboard
- 4.2. Core Banking Software Market: Component Movement Analysis, USD Million, 2024 & 2030
- 4.3. Solution
- 4.3.1. Solution Market Revenue Estimates and Forecasts, 2018 - 2030 (USD Million)
- 4.3.2. Deposits
- 4.3.2.1. Deposits Market Revenue Estimates and Forecasts, 2018 - 2030 (USD Million)
- 4.3.3. Loans
- 4.3.3.1. Loans Market Revenue Estimates and Forecasts, 2018 - 2030 (USD Million)
- 4.3.4. Enterprise Customer Solutions
- 4.3.4.1. Enterprise Customer Solutions Market Revenue Estimates and Forecasts, 2018 - 2030 (USD Million)
- 4.3.5. Others
- 4.3.5.1. Others Market Revenue Estimates and Forecasts, 2018 - 2030 (USD Million)
- 4.4. Service
- 4.4.1. Service Market Revenue Estimates and Forecasts, 2018 - 2030 (USD Million)
- 4.4.2. Professional Service
- 4.4.2.1. Professional Service Market Revenue Estimates and Forecasts, 2018 - 2030 (USD Million)
- 4.4.3. Managed Service
- 4.4.3.1. Managed Service Market Revenue Estimates and Forecasts, 2018 - 2030 (USD Million)
Chapter 5. Core Banking Software Market: Deployment Estimates & Trend Analysis
- 5.1. Segment Dashboard
- 5.2. Core Banking Software Market: Deployment Movement Analysis, USD Million, 2024 & 2030
- 5.3. Cloud
- 5.3.1. Cloud Market Revenue Estimates and Forecasts, 2018 - 2030 (USD Million)
- 5.4. On-premise
- 5.4.1. On-premise Market Revenue Estimates and Forecasts, 2018 - 2030 (USD Million)
Chapter 6. Core Banking Software Market: End Use Estimates & Trend Analysis
- 6.1. Segment Dashboard
- 6.2. Core Banking Software Market: End Use Movement Analysis, USD Million, 2024 & 2030
- 6.3. Banks
- 6.3.1. Banks Market Revenue Estimates and Forecasts, 2018 - 2030 (USD Million)
- 6.4. Financial Institutions
- 6.4.1. Financial Institutions Market Revenue Estimates and Forecasts, 2018 - 2030 (USD Million)
- 6.5. Others
- 6.5.1. Others Market Revenue Estimates and Forecasts, 2018 - 2030 (USD Million)
Chapter 7. Core Banking Software Market Region Estimates & Trend Analysis
- 7.1. Core Banking Software Market Share, By Region, 2024 & 2030, USD Million
- 7.2. North America
- 7.2.1. North America Core Banking Software Market Estimates and Forecasts, 2018 - 2030 (USD Million)
- 7.2.2. U.S.
- 7.2.2.1. U.S. Core Banking Software Market Estimates and Forecasts, 2018 - 2030 (USD Million)
- 7.2.3. Canada
- 7.2.3.1. Canada Core Banking Software Market Estimates and Forecasts, 2018 - 2030 (USD Million)
- 7.3. Europe
- 7.3.1. Europe Core Banking Software Market Estimates and Forecasts, 2018 - 2030 (USD Million)
- 7.3.2. UK
- 7.3.2.1. UK Core Banking Software Market Estimates and Forecasts, 2018 - 2030 (USD Million)
- 7.3.3. Germany
- 7.3.3.1. Germany Core Banking Software Market Estimates and Forecasts, 2018 - 2030 (USD Million)
- 7.3.4. France
- 7.3.4.1. France Core Banking Software Market Estimates and Forecasts, 2018 - 2030 (USD Million)
- 7.4. Asia Pacific
- 7.4.1. Asia Pacific Core Banking Software Market Estimates and Forecasts, 2018 - 2030 (USD Million)
- 7.4.2. China
- 7.4.2.1. China Core Banking Software Market Estimates and Forecasts, 2018 - 2030 (USD Million)
- 7.4.3. India
- 7.4.3.1. India Core Banking Software Market Estimates and Forecasts, 2018 - 2030 (USD Million)
- 7.4.4. Japan
- 7.4.4.1. Japan Core Banking Software Market Estimates and Forecasts, 2018 - 2030 (USD Million)
- 7.4.5. Australia
- 7.4.5.1. Australia Core Banking Software Market Estimates and Forecasts, 2018 - 2030 (USD Million)
- 7.4.6. South Korea
- 7.4.6.1. South Korea Core Banking Software Market Estimates and Forecasts, 2018 - 2030 (USD Million)
- 7.5. Latin America
- 7.5.1. Latin America Core Banking Software Market Estimates and Forecasts, 2018 - 2030 (USD Million)
- 7.5.2. Brazil
- 7.5.2.1. Brazil Core Banking Software Market Estimates and Forecasts, 2018 - 2030 (USD Million)
- 7.5.3. Mexico
- 7.5.3.1. Mexico Core Banking Software Market Estimates and Forecasts, 2018 - 2030 (USD Million)
- 7.6. MEA
- 7.6.1. MEA Core Banking Software Market Estimates and Forecasts, 2018 - 2030 (USD Million)
- 7.6.2. UAE
- 7.6.2.1. UAE Core Banking Software Market Estimates and Forecasts, 2018 - 2030 (USD Million)
- 7.6.3. KSA
- 7.6.3.1. KSA Core Banking Software Market Estimates and Forecasts, 2018 - 2030 (USD Million)
- 7.6.4. South Africa
- 7.6.4.1. South Africa Core Banking Software Market Estimates and Forecasts, 2018 - 2030 (USD Million)
Chapter 8. Competitive Landscape
- 8.1. Company Categorization
- 8.2. Company Market Positioning
- 8.3. Company Heat Map Analysis
- 8.4. Company Profiles/Listing
- 8.4.1. Capgemini
- 8.4.1.1. Participant's Overview
- 8.4.1.2. Financial Performance
- 8.4.1.3. Application Benchmarking
- 8.4.1.4. Strategic Initiatives
- 8.4.2. Finastra
- 8.4.2.1. Participant's Overview
- 8.4.2.2. Financial Performance
- 8.4.2.3. Application Benchmarking
- 8.4.2.4. Strategic Initiatives
- 8.4.3. FIS
- 8.4.3.1. Participant's Overview
- 8.4.3.2. Financial Performance
- 8.4.3.3. Application Benchmarking
- 8.4.3.4. Strategic Initiatives
- 8.4.4. Fiserv, Inc.
- 8.4.4.1. Participant's Overview
- 8.4.4.2. Financial Performance
- 8.4.4.3. Application Benchmarking
- 8.4.4.4. Strategic Initiatives
- 8.4.5. HCL Technologies Limited
- 8.4.5.1. Participant's Overview
- 8.4.5.2. Financial Performance
- 8.4.5.3. Application Benchmarking
- 8.4.5.4. Strategic Initiatives
- 8.4.6. Infosys Limited
- 8.4.6.1. Participant's Overview
- 8.4.6.2. Financial Performance
- 8.4.6.3. Application Benchmarking
- 8.4.6.4. Strategic Initiatives
- 8.4.7. Jack Henry & Associates, Inc.
- 8.4.7.1. Participant's Overview
- 8.4.7.2. Financial Performance
- 8.4.7.3. Application Benchmarking
- 8.4.7.4. Strategic Initiatives
- 8.4.8. Oracle Corporation
- 8.4.8.1. Participant's Overview
- 8.4.8.2. Financial Performance
- 8.4.8.3. Application Benchmarking
- 8.4.8.4. Strategic Initiatives
- 8.4.9. Temenos Group
- 8.4.9.1. Participant's Overview
- 8.4.9.2. Financial Performance
- 8.4.9.3. Application Benchmarking
- 8.4.9.4. Strategic Initiatives
- 8.4.10. Unisys
- 8.4.10.1. Participant's Overview
- 8.4.10.2. Financial Performance
- 8.4.10.3. Application Benchmarking
- 8.4.10.4. Strategic Initiatives
- 8.4.1. Capgemini
