|
|
市場調査レポート
商品コード
1679582
ガス置換包装の市場規模、シェア、動向分析レポート:包装材料別、包装ガスタイプ別、用途別、地域別、セグメント予測、2025-2030年Modified Atmosphere Packaging Market Size, Share & Trends Analysis Report By Packaging Material (Polyethylene, Polypropylene), By Packaging Gas Type (Nitrogen, Carbon Dioxide), By Application, By Region, And Segment Forecasts, 2025 - 2030 |
||||||
|
|||||||
カスタマイズ可能
|
|||||||

| ガス置換包装の市場規模、シェア、動向分析レポート:包装材料別、包装ガスタイプ別、用途別、地域別、セグメント予測、2025-2030年 |
|
出版日: 2025年02月27日
発行: Grand View Research
ページ情報: 英文 110 Pages
納期: 2~10営業日
|

全表示
- 概要
- 図表
- 目次
ガス置換包装市場の成長と動向
Grand View Research, Inc.の最新レポートによると、世界のガス置換包装市場規模は2030年までに261億8,000万米ドルに達すると予測され、2025~2030年のCAGRは7.94%で成長すると予測されています。
ガス置換包装(MAP)市場は、世界の食品包装産業の重要なセグメントであり、賞味期限の延長、製品の鮮度維持、食品廃棄物の削減の必要性に後押しされています。MAPは、包装内の自然大気を特定のガス組成-通常、窒素、二酸化炭素、酸素の混合-で置換し、微生物の増殖と酸化を遅らせるものです。この技術は、生鮮食品、食肉、魚介類、乳製品、ベーカリー製品など、さまざまな食品セグメントで広く採用されており、生鮮食品の保管・輸送中の鮮度維持を保証しています。最小限の加工と防腐剤フリーの食品に対する消費者の需要が高まる中、MAPは利便性、安全性、持続可能性のバランスを求めるメーカーにとって不可欠な包装ソリューションとなっています。
ガス置換包装市場の成長促進要因は、食品サプライチェーンのグローバリゼーションが進んでいることです。国際貿易やeコマースの拡大により食品が長距離輸送されるようになり、品質と安全性を維持するための先進包装ソリューションの必要性が高まっています。さらに、ハイバリアフィルムやリアルタイムの鮮度インジケータを備えたスマート包装技術など、包装資材の技術革新が進んでいることも、MAPの有効性をさらに高めています。厳しい食品安全規制や食品廃棄物削減の取り組みに対する意識の高まりも、特に消費者と小売業者の双方が賞味期限の延長と環境負荷の低減を優先する新興国市場でのMAPの採用を後押ししています。
市場関係者は、合併、買収、提携など様々な戦略的取り組みに注力しています。例えば、2024年3月、ProAmpacはSammiブランドと提携し、北米でサンドイッチ用のガス置換包装(MAP)を発表しました。この包装は繊維ベースで、カートンボードと薄い透明フィルムを使用し、サンドイッチの鮮度を長く保つと同時に、顧客に製品を見せることができます。
ガス置換包装市場レポートハイライト
- 包装材料別では、ポリエチレン(PE)が2024年に81億9,000万米ドルの最大の売上シェアを占めました。
- 包装ガスタイプ別では、二酸化炭素が市場を独占し、2024年に44.17%以上の最大収益シェアを占めました。
- 用途別では、果物と野菜が市場をリードし、2024年に39.33%以上の最大収益シェアを占めます。
- 地域別では、アジア太平洋がガス置換包装市場を独占しました。この地域では多国籍スーパーマーケットチェーンやファーストフードブランドの急速な拡大により、加工肉、乳製品、ベーカリー製品へのMAPの使用が増加しています。
- アジア太平洋では中国がガス置換包装の主要メーカーであり、2024年には同地域の収益市場シェアの約41%を占めました。
目次
第1章 調査手法と範囲
第2章 エグゼクティブサマリー
第3章 ガス置換包装市場の変数、動向、範囲
- 世界のガス置換包装市場の展望
- 産業バリューチェーン分析
- 技術概要
- 循環型経済の影響
- 平均価格動向分析、2018~2030年
- 価格設定に影響を与える主要要因
- 規制の枠組み
- 施策とインセンティブプラン
- 標準とコンプライアンス
- 規制影響分析
- 市場力学
- 市場促進要因分析
- 市場抑制要因分析
- 産業の課題
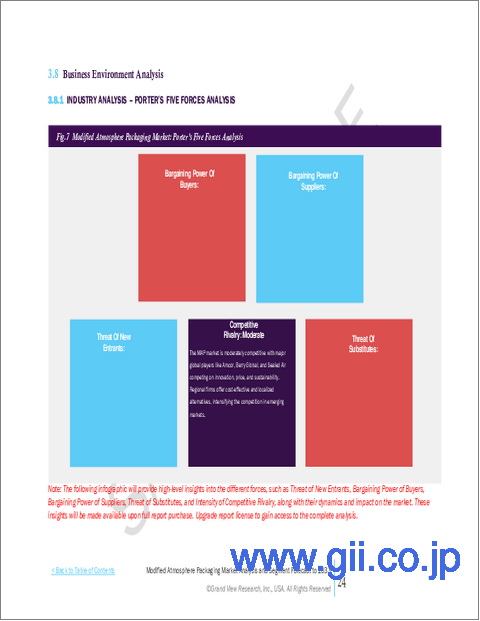
- ポーターのファイブフォース分析
- サプライヤーの力
- 買い手の力
- 代替の脅威
- 新規参入の脅威
- 競争企業間の敵対関係
- PESTEL分析
- 政治
- 経済
- 社会
- 技術
- 環境
- 法的
第4章 ガス置換包装市場:包装材料の展望の推定と予測
- ガス置換包装市場:包装材料変動分析、2024年と2030年
- ポリ塩化ビニル(PVC)
- ポリエチレン(PE)
- ポリプロピレン(PP)
- その他
第5章 ガス置換包装市場:包装ガスタイプの展望の推定と予測
- ガス置換包装市場:包装ガスタイプ変動分析、2024年と2030年
- 酸素
- 窒素
- 二酸化炭素
- その他
第6章 ガス置換包装市場:用途の展望の推定と予測
- ガス置換包装市場:用途変動分析、2024年と2030年
- 果物と野菜
- 鶏肉、魚介類、肉類
- パン・菓子類
- その他
第7章 ガス置換包装市場の地域展望の推定と予測
- 地域スナップショット
- ガス置換包装市場:地域変動分析、2024年と2030年
- 北米
- 市場推定・予測、2018~2030年
- 包装材料別、2018~2030年
- 包装ガスタイプ別、2018~2030年
- 用途別、2018~2030年
- 米国
- カナダ
- メキシコ
- 欧州
- 市場推定・予測、2018~2030年
- 包装材料別、2018~2030年
- 包装ガスタイプ別、2018~2030年
- 用途別、2018~2030年
- 英国
- ドイツ
- フランス
- イタリア
- アジア太平洋
- 市場推定・予測、2018~2030年
- 包装材料別、2018~2030年
- 包装ガスタイプ別、2018~2030年
- 用途別、2018~2030年
- 中国
- インド
- 日本
- 中南米
- 市場推定・予測、2018~2030年
- 包装材料別、2018~2030年
- 包装ガスタイプ別、2018~2030年
- 用途別、2018~2030年
- ブラジル
- アルゼンチン
- 中東・アフリカ
- 市場推定・予測、2018~2030年
- 包装材料別、2018~2030年
- 包装ガスタイプ別、2018~2030年
- 用途別、2018~2030年
- GCC諸国
- 南アフリカ
第8章 競合情勢
- 主要市場参入企業による最近の動向と影響分析
- ベンダー情勢
- 企業分類
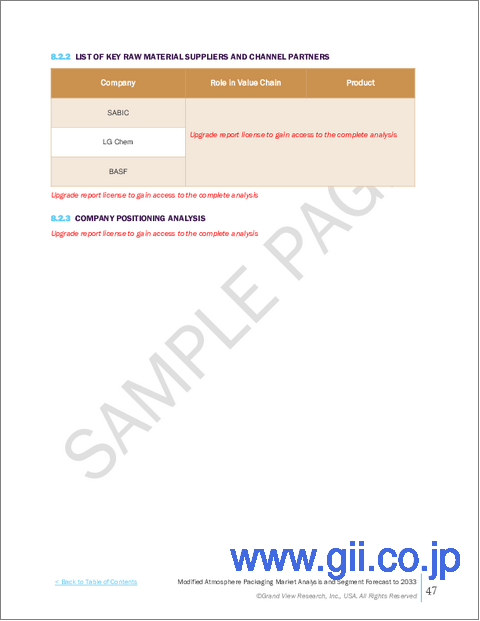
- 主要販売代理店とチャネルパートナー一覧
- 潜在顧客/エンドユーザー一覧
- 競争の力学
- 企業の市場シェア分析と市場ポジショニング
- 競合ベンチマーキング
- 戦略マッピング
- ヒートマップ分析
- 企業プロファイル/上場企業
- 参入企業概要
List of Tables
- Table 1 List of Abbreviations
- Table 2 Packaging material market estimates and forecasts, 2018 - 2030 (USD Million)
- Table 3 Polyvinyl chloride (PVC) market estimates and forecasts, 2018 - 2030 (USD Million)
- Table 4 Polyethylene (PE) market estimates and forecasts, 2018 - 2030 (USD Million)
- Table 5 Polypropylene (PP) market estimates and forecasts, 2018 - 2030 (USD Million)
- Table 6 Others market estimates and forecasts, 2018 - 2030 (USD Million)
- Table 7 Packaging gas type market estimates and forecasts, 2018 - 2030 (USD Million)
- Table 8 Oxygen market estimates and forecasts, 2018 - 2030 (USD Million)
- Table 9 Nitrogen market estimates and forecasts, 2018 - 2030 (USD Million)
- Table 10 Carbon dioxide market estimates and forecasts, 2018 - 2030 (USD Million)
- Table 11 Others market estimates and forecasts, 2018 - 2030 (USD Million)
- Table 12 Application market estimates and forecasts, 2018 - 2030 (USD Million)
- Table 13 Fruits and vegetables market estimates and forecasts, 2018 - 2030 (USD Million)
- Table 14 Poultry, seafood, and meat market estimates and forecasts, 2018 - 2030 (USD Million)
- Table 15 Bakery and confectionery market estimates and forecasts, 2018 - 2030 (USD Million)
- Table 16 Other Applications market estimates and forecasts, 2018 - 2030 (USD Million)
- Table 17 North America modified atmosphere packaging market estimates and forecasts, by packaging material, 2018 - 2030 (USD Million)
- Table 18 North America modified atmosphere packaging market estimates and forecasts, by packaging gas type, 2018 - 2030 (USD Million)
- Table 19 North America modified atmosphere packaging market estimates and forecasts, by application, 2018 - 2030 (USD Million)
- Table 20 U.S. modified atmosphere packaging market estimates and forecasts, by packaging material, 2018 - 2030 (USD Million)
- Table 21 U.S. modified atmosphere packaging market estimates and forecasts, by packaging gas type, 2018 - 2030 (USD Million)
- Table 22 U.S. modified atmosphere packaging market estimates and forecasts, by application, 2018 - 2030 (USD Million)
- Table 23 Canada modified atmosphere packaging market estimates and forecasts, by packaging material, 2018 - 2030 (USD Million)
- Table 24 Canada modified atmosphere packaging market estimates and forecasts, by packaging gas type, 2018 - 2030 (USD Million)
- Table 25 Canada modified atmosphere packaging market estimates and forecasts, by application, 2018 - 2030 (USD Million)
- Table 26 Mexico modified atmosphere packaging market estimates and forecasts, by packaging material, 2018 - 2030 (USD Million)
- Table 27 Mexico modified atmosphere packaging market estimates and forecasts, by packaging gas type, 2018 - 2030 (USD Million)
- Table 28 Mexico modified atmosphere packaging market estimates and forecasts, by application, 2018 - 2030 (USD Million)
- Table 29 Europe modified atmosphere packaging market estimates and forecasts, by packaging material, 2018 - 2030 (USD Million)
- Table 30 Europe modified atmosphere packaging market estimates and forecasts, by packaging gas type, 2018 - 2030 (USD Million)
- Table 31 Europe modified atmosphere packaging market estimates and forecasts, by application, 2018 - 2030 (USD Million)
- Table 32 Germany modified atmosphere packaging market estimates and forecasts, by packaging material, 2018 - 2030 (USD Million)
- Table 33 Germany modified atmosphere packaging market estimates and forecasts, by packaging gas type, 2018 - 2030 (USD Million)
- Table 34 Germany modified atmosphere packaging market estimates and forecasts, by application, 2018 - 2030 (USD Million)
- Table 35 UK modified atmosphere packaging market estimates and forecasts, by packaging material, 2018 - 2030 (USD Million)
- Table 36 UK modified atmosphere packaging market estimates and forecasts, by packaging gas type, 2018 - 2030 (USD Million)
- Table 37 UK modified atmosphere packaging market estimates and forecasts, by application, 2018 - 2030 (USD Million)
- Table 38 France modified atmosphere packaging market estimates and forecasts, by packaging material, 2018 - 2030 (USD Million)
- Table 39 France modified atmosphere packaging market estimates and forecasts, by packaging gas type, 2018 - 2030 (USD Million)
- Table 40 France modified atmosphere packaging market estimates and forecasts, by application, 2018 - 2030 (USD Million)
- Table 41 Italy modified atmosphere packaging market estimates and forecasts, by packaging material, 2018 - 2030 (USD Million)
- Table 42 Italy modified atmosphere packaging market estimates and forecasts, by packaging gas type, 2018 - 2030 (USD Million)
- Table 43 Italy modified atmosphere packaging market estimates and forecasts, by application, 2018 - 2030 (USD Million)
- Table 44 Spain modified atmosphere packaging market estimates and forecasts, by packaging material, 2018 - 2030 (USD Million)
- Table 45 Spain modified atmosphere packaging market estimates and forecasts, by packaging gas type, 2018 - 2030 (USD Million)
- Table 46 Spain modified atmosphere packaging market estimates and forecasts, by application, 2018 - 2030 (USD Million)
- Table 47 Asia Pacific modified atmosphere packaging market estimates and forecasts, by packaging material, 2018 - 2030 (USD Million)
- Table 48 Asia Pacific modified atmosphere packaging market estimates and forecasts, by packaging gas type, 2018 - 2030 (USD Million)
- Table 49 Asia Pacific modified atmosphere packaging market estimates and forecasts, by application, 2018 - 2030 (USD Million)
- Table 50 China modified atmosphere packaging market estimates and forecasts, by packaging material, 2018 - 2030 (USD Million)
- Table 51 China modified atmosphere packaging market estimates and forecasts, by packaging gas type, 2018 - 2030 (USD Million)
- Table 52 China modified atmosphere packaging market estimates and forecasts, by application, 2018 - 2030 (USD Million)
- Table 53 India modified atmosphere packaging market estimates and forecasts, by packaging material, 2018 - 2030 (USD Million)
- Table 54 India modified atmosphere packaging market estimates and forecasts, by packaging gas type, 2018 - 2030 (USD Million)
- Table 55 India modified atmosphere packaging market estimates and forecasts, by application, 2018 - 2030 (USD Million)
- Table 56 Japan modified atmosphere packaging market estimates and forecasts, by packaging material, 2018 - 2030 (USD Million)
- Table 57 Japan modified atmosphere packaging market estimates and forecasts, by packaging gas type, 2018 - 2030 (USD Million)
- Table 58 Japan modified atmosphere packaging market estimates and forecasts, by application, 2018 - 2030 (USD Million)
- Table 59 South Korea modified atmosphere packaging market estimates and forecasts, by packaging material, 2018 - 2030 (USD Million)
- Table 60 South Korea modified atmosphere packaging market estimates and forecasts, by packaging gas type, 2018 - 2030 (USD Million)
- Table 61 South Korea modified atmosphere packaging market estimates and forecasts, by application, 2018 - 2030 (USD Million)
- Table 62 Australia modified atmosphere packaging market estimates and forecasts, by packaging material, 2018 - 2030 (USD Million)
- Table 63 Australia modified atmosphere packaging market estimates and forecasts, by packaging gas type, 2018 - 2030 (USD Million)
- Table 64 Australia modified atmosphere packaging market estimates and forecasts, by application, 2018 - 2030 (USD Million)
- Table 65 Central & South America modified atmosphere packaging market estimates and forecasts, by packaging material, 2018 - 2030 (USD Million)
- Table 66 Central & South America modified atmosphere packaging market estimates and forecasts, by packaging gas type, 2018 - 2030 (USD Million)
- Table 67 Central & South America modified atmosphere packaging market estimates and forecasts, by application, 2018 - 2030 (USD Million)
- Table 68 Brazil modified atmosphere packaging market estimates and forecasts, by packaging material, 2018 - 2030 (USD Million)
- Table 69 Brazil modified atmosphere packaging market estimates and forecasts, by packaging gas type, 2018 - 2030 (USD Million)
- Table 70 Brazil modified atmosphere packaging market estimates and forecasts, by application, 2018 - 2030 (USD Million)
- Table 71 Argentina modified atmosphere packaging market estimates and forecasts, by packaging material, 2018 - 2030 (USD Million)
- Table 72 Argentina modified atmosphere packaging market estimates and forecasts, by packaging gas type, 2018 - 2030 (USD Million)
- Table 73 Argentina modified atmosphere packaging market estimates and forecasts, by application, 2018 - 2030 (USD Million)
- Table 74 Middle East Africa modified atmosphere packaging market estimates and forecasts, by packaging material, 2018 - 2030 (USD Million)
- Table 75 Middle East Africa modified atmosphere packaging market estimates and forecasts, by packaging gas type, 2018 - 2030 (USD Million)
- Table 76 Middle East Africa modified atmosphere packaging market estimates and forecasts, by application, 2018 - 2030 (USD Million)
- Table 77 Saudi Arabia modified atmosphere packaging market estimates and forecasts, by packaging material, 2018 - 2030 (USD Million)
- Table 78 Saudi Arabia modified atmosphere packaging market estimates and forecasts, by packaging gas type, 2018 - 2030 (USD Million)
- Table 79 Saudi Arabia modified atmosphere packaging market estimates and forecasts, by application, 2018 - 2030 (USD Million)
- Table 80 UAE modified atmosphere packaging market estimates and forecasts, by packaging material, 2018 - 2030 (USD Million)
- Table 81 UAE modified atmosphere packaging market estimates and forecasts, by packaging gas type, 2018 - 2030 (USD Million)
- Table 82 UAE modified atmosphere packaging market estimates and forecasts, by application, 2018 - 2030 (USD Million)
- Table 83 South Africa modified atmosphere packaging market estimates and forecasts, by packaging material, 2018 - 2030 (USD Million)
- Table 84 South Africa modified atmosphere packaging market estimates and forecasts, by packaging gas type, 2018 - 2030 (USD Million)
- Table 85 South Africa modified atmosphere packaging market estimates and forecasts, by application, 2018 - 2030 (USD Million)
List of Figures
- Fig. 1 Market segmentation
- Fig. 2 Information procurement
- Fig. 3 Data Analysis Models
- Fig. 4 Market Formulation and Validation
- Fig. 5 Market snapshot
- Fig. 6 Segmental outlook- Plastic packaging material, packaging gas type, and application
- Fig. 7 Competitive outlook
- Fig. 8 Value chain analysis
- Fig. 9 Market dynamics
- Fig. 10 Porter's Analysis
- Fig. 11 PESTEL Analysis
- Fig. 12 Modified Atmosphere Packaging Market, by Packaging Material: Key takeaways
- Fig. 13 Modified Atmosphere Packaging Market, by Packaging Material: Market share, 2024 & 2030
- Fig. 14 Modified Atmosphere Packaging Market, by Packaging Gas Type: Key takeaways
- Fig. 15 Modified Atmosphere Packaging Market, by Packaging Gas Type: Market share, 2024 & 2030
- Fig. 16 Modified Atmosphere Packaging Market, by Application: Key takeaways
- Fig. 17 Modified Atmosphere Packaging Market, by Application: Market share, 2024 & 2030
- Fig. 18 Modified Atmosphere Packaging Market, by Region: Key takeaways
- Fig. 19 Modified Atmosphere Packaging Market, by Region: Market share, 2024 & 2030
Modified Atmosphere Packaging Market Growth and Trends:
The global modified atmosphere packaging market size is anticipated to reach USD 26.18 billion by 2030 and is anticipated to grow at a CAGR of 7.94% from 2025 to 2030, according to a new report by Grand View Research, Inc. The Modified Atmosphere Packaging (MAP) market is a crucial segment of the global food packaging industry, driven by the need to extend shelf-life, maintain product freshness, and reduce food waste. MAP involves replacing the natural atmosphere inside a package with a specific gas composition-typically a mix of nitrogen, carbon dioxide, and oxygen-to slow microbial growth and oxidation. This technology is widely adopted across various food segments, including fresh produce, meat, seafood, dairy, and bakery products, ensuring that perishable goods remain fresh during storage and transportation. With rising consumer demand for minimally processed and preservative-free food, MAP has become an essential packaging solution for manufacturers seeking to balance convenience, safety, and sustainability.
A primary driver for the growth of the modified atmosphere packaging market is the increasing globalization of the food supply chain. As food products are transported over longer distances due to international trade and e-commerce expansion, the need for advanced packaging solutions to maintain quality and safety has intensified. Additionally, ongoing innovations in packaging materials, such as high-barrier films and smart packaging technologies with real-time freshness indicators, are further enhancing the effectiveness of MAP. Stringent food safety regulations and growing awareness of food waste reduction initiatives are also encouraging the adoption of MAP, particularly in developed markets where both consumers and retailers prioritize extended shelf-life and reduced environmental impact.
The market players are focusing on various strategic initiatives such as mergers, acquisitions, and collaborations. For instance, in March 2024, ProAmpac introduced a modified atmosphere sandwich pack (MAP) in North America, partnering with the brand Sammi. This packaging is fiber-based, using carton board and a thin transparent film to keep sandwiches fresh longer while also letting customers see the product.
Modified Atmosphere Packaging Market Report Highlights:
- Based on packaging material, polyethylene (PE) held the largest revenue share of USD 8.19 billion in 2024.
- Based on packaging gas type, carbon dioxide dominated the market, accounted for the largest revenue share of over 44.17% in 2024.
- Based on application, fruits and vegetables led the market and accounted for the largest revenue share of over 39.33% in 2024.
- Based on region, the Asia Pacific dominated the modified atmosphere packaging market. The rapid expansion of multinational supermarket chains and fast-food brands in the region is increasing the use of MAP for processed meats, dairy, and bakery products.
- China was the leading manufacturer of modified atmosphere packaging in the Asia Pacific region and captured around 41% of the revenue market share in 2024 in this region.
Table of Contents
Chapter 1. Methodology and Scope
- 1.1. Market Segmentation & Scope
- 1.2. Market Definition
- 1.3. Information Procurement
- 1.3.1. Purchased Database
- 1.3.2. GVR's Internal Database
- 1.3.3. Secondary Materials & Third-Party Perspectives
- 1.3.4. Primary Research
- 1.4. Information Analysis
- 1.4.1. Data Analysis Models
- 1.5. Market Formulation & Data Visualization
- 1.6. Data Validation & Publishing
Chapter 2. Executive Summary
- 2.1. Market Insights
- 2.2. Segmental Outlook
- 2.3. Competitive Outlook
Chapter 3. Modified Atmosphere Packaging Market Variables, Trends & Scope
- 3.1. Global Modified Atmosphere Packaging Market Outlook
- 3.2. Industry Value Chain Analysis
- 3.3. Technology Overview
- 3.4. Impact of Circular Economy
- 3.5. Average Price Trend Analysis, 2018 to 2030 (USD/kg)
- 3.5.1. Key Factors Influencing Pricing
- 3.6. Regulatory Framework
- 3.6.1. Policies and Incentive Plans
- 3.6.2. Standards and Compliances
- 3.6.3. Regulatory Impact Analysis
- 3.7. Market Dynamics
- 3.7.1. Market Driver Analysis
- 3.7.2. Market Restraint Analysis
- 3.7.3. Industry Challenges
- 3.8. Porter's Five Forces Analysis
- 3.8.1. Supplier Power
- 3.8.2. Buyer Power
- 3.8.3. Substitution Threat
- 3.8.4. Threat from New Entrant
- 3.8.5. Competitive Rivalry
- 3.9. PESTEL Analysis
- 3.9.1. Political Landscape
- 3.9.2. Economic Landscape
- 3.9.3. Social Landscape
- 3.9.4. Technological Landscape
- 3.9.5. Environmental Landscape
- 3.9.6. Legal Landscape
Chapter 4. Modified Atmosphere Packaging Market: Packaging Material Outlook Estimates & Forecasts
- 4.1. Modified Atmosphere Packaging Market: Packaging Material Movement Analysis, 2024 & 2030
- 4.1.1. Polyvinyl Chloride (PVC)
- 4.1.1.1. Market estimates and forecast, 2018 - 2030 (USD Million)
- 4.1.2. Polyethylene (PE)
- 4.1.2.1. Market estimates and forecast, 2018 - 2030 (USD Million)
- 4.1.3. Polypropylene (PP)
- 4.1.3.1. Market estimates and forecast, 2018 - 2030 (USD Million)
- 4.1.4. Others
- 4.1.4.1. Market estimates and forecast, 2018 - 2030 (USD Million)
- 4.1.1. Polyvinyl Chloride (PVC)
Chapter 5. Modified Atmosphere Packaging Market: Packaging Gas Type Outlook Estimates & Forecasts
- 5.1. Modified Atmosphere Packaging Market: Packaging Gas Type Movement Analysis, 2024 & 2030
- 5.1.1. Oxygen
- 5.1.1.1. Market estimates and forecast, 2018 - 2030 (USD Million)
- 5.1.2. Nitrogen
- 5.1.2.1. Market estimates and forecast, 2018 - 2030 (USD Million)
- 5.1.3. Carbon dioxide
- 5.1.3.1. Market estimates and forecast, 2018 - 2030 (USD Million)
- 5.1.4. Others
- 5.1.4.1. Market estimates and forecast, 2018 - 2030 (USD Million)
- 5.1.1. Oxygen
Chapter 6. Modified Atmosphere Packaging Market: Application Outlook Estimates & Forecasts
- 6.1. Modified Atmosphere Packaging Market: Application Movement Analysis, 2024 & 2030
- 6.1.1. Fruits and vegetables
- 6.1.1.1. Market estimates and forecast, 2018 - 2030 (USD Million)
- 6.1.2. Poultry, seafood, and meat
- 6.1.2.1. Market estimates and forecast, 2018 - 2030 (USD Million)
- 6.1.3. Bakery and confectionery
- 6.1.3.1. Market estimates and forecast, 2018 - 2030 (USD Million)
- 6.1.4. Other Applications
- 6.1.4.1. Market estimates and forecast, 2018 - 2030 (USD Million)
- 6.1.1. Fruits and vegetables
Chapter 7. Modified Atmosphere Packaging Market Regional Outlook Estimates & Forecasts
- 7.1. Regional Snapshot
- 7.2. Modified Atmosphere Packaging Market: Regional Movement Analysis, 2024 & 2030
- 7.3. North America
- 7.3.1. Market estimates and forecast, 2018 - 2030 (USD Million)
- 7.3.2. Market estimates and forecast, by packaging material, 2018 - 2030 (USD Million)
- 7.3.3. Market estimates and forecast, by packaging gas type, 2018 - 2030 (USD Million)
- 7.3.4. Market estimates and forecast, by application, 2018 - 2030 (USD Million)
- 7.3.5. U.S.
- 7.3.5.1. Market estimates and forecast, 2018 - 2030 (USD Million)
- 7.3.5.2. Market estimates and forecast, by packaging material, 2018 - 2030 (USD Million)
- 7.3.5.3. Market estimates and forecast, by packaging gas type, 2018 - 2030 (USD Million)
- 7.3.5.4. Market estimates and forecast, by application, 2018 - 2030 (USD Million)
- 7.3.6. Canada
- 7.3.6.1. Market estimates and forecast, 2018 - 2030 (USD Million)
- 7.3.6.2. Market estimates and forecast, by packaging material, 2018 - 2030 (USD Million)
- 7.3.6.3. Market estimates and forecast, by packaging gas type, 2018 - 2030 (USD Million)
- 7.3.6.4. Market estimates and forecast, by application, 2018 - 2030 (USD Million)
- 7.3.7. Mexico
- 7.3.7.1. Market estimates and forecast, 2018 - 2030 (USD Million)
- 7.3.7.2. Market estimates and forecast, by packaging material, 2018 - 2030 (USD Million)
- 7.3.7.3. Market estimates and forecast, by packaging gas type, 2018 - 2030 (USD Million)
- 7.3.7.4. Market estimates and forecast, by application, 2018 - 2030 (USD Million)
- 7.4. Europe
- 7.4.1. Market estimates and forecast, 2018 - 2030 (USD Million)
- 7.4.2. Market estimates and forecast, by packaging material, 2018 - 2030 (USD Million)
- 7.4.3. Market estimates and forecast, by packaging gas type, 2018 - 2030 (USD Million)
- 7.4.4. Market estimates and forecast, by application, 2018 - 2030 (USD Million)
- 7.4.5. UK
- 7.4.5.1. Market estimates and forecast, 2018 - 2030 (USD Million)
- 7.4.5.2. Market estimates and forecast, by packaging material, 2018 - 2030 (USD Million)
- 7.4.5.3. Market estimates and forecast, by packaging gas type, 2018 - 2030 (USD Million)
- 7.4.5.4. Market estimates and forecast, by application, 2018 - 2030 (USD Million)
- 7.4.6. Germany
- 7.4.6.1. Market estimates and forecast, 2018 - 2030 (USD Million)
- 7.4.6.2. Market estimates and forecast, by packaging material, 2018 - 2030 (USD Million)
- 7.4.6.3. Market estimates and forecast, by packaging gas type, 2018 - 2030 (USD Million)
- 7.4.6.4. Market estimates and forecast, by application, 2018 - 2030 (USD Million)
- 7.4.7. France
- 7.4.7.1. Market estimates and forecast, 2018 - 2030 (USD Million)
- 7.4.7.2. Market estimates and forecast, by packaging material, 2018 - 2030 (USD Million)
- 7.4.7.3. Market estimates and forecast, by packaging gas type, 2018 - 2030 (USD Million)
- 7.4.7.4. Market estimates and forecast, by application, 2018 - 2030 (USD Million)
- 7.4.8. Italy
- 7.4.8.1. Market estimates and forecast, 2018 - 2030 (USD Million)
- 7.4.8.2. Market estimates and forecast, by packaging material, 2018 - 2030 (USD Million)
- 7.4.8.3. Market estimates and forecast, by packaging gas type, 2018 - 2030 (USD Million)
- 7.4.8.4. Market estimates and forecast, by application, 2018 - 2030 (USD Million)
- 7.5. Asia Pacific
- 7.5.1. Market estimates and forecast, 2018 - 2030 (USD Million)
- 7.5.2. Market estimates and forecast, by packaging material, 2018 - 2030 (USD Million)
- 7.5.3. Market estimates and forecast, by packaging gas type, 2018 - 2030 (USD Million)
- 7.5.4. Market estimates and forecast, by application, 2018 - 2030 (USD Million)
- 7.5.5. China
- 7.5.5.1. Market estimates and forecast, 2018 - 2030 (USD Million)
- 7.5.5.2. Market estimates and forecast, by packaging material, 2018 - 2030 (USD Million)
- 7.5.5.3. Market estimates and forecast, by packaging gas type, 2018 - 2030 (USD Million)
- 7.5.5.4. Market estimates and forecast, by application, 2018 - 2030 (USD Million)
- 7.5.6. India
- 7.5.6.1. Market estimates and forecast, 2018 - 2030 (USD Million)
- 7.5.6.2. Market estimates and forecast, by packaging material, 2018 - 2030 (USD Million)
- 7.5.6.3. Market estimates and forecast, by packaging gas type, 2018 - 2030 (USD Million)
- 7.5.6.4. Market estimates and forecast, by application, 2018 - 2030 (USD Million)
- 7.5.7. Japan
- 7.5.7.1. Market estimates and forecast, 2018 - 2030 (USD Million)
- 7.5.7.2. Market estimates and forecast, by packaging material, 2018 - 2030 (USD Million)
- 7.5.7.3. Market estimates and forecast, by packaging gas type, 2018 - 2030 (USD Million)
- 7.5.7.4. Market estimates and forecast, by application, 2018 - 2030 (USD Million)
- 7.6. Central & South America
- 7.6.1. Market estimates and forecast, 2018 - 2030 (USD Million)
- 7.6.2. Market estimates and forecast, by packaging material, 2018 - 2030 (USD Million)
- 7.6.3. Market estimates and forecast, by packaging gas type, 2018 - 2030 (USD Million)
- 7.6.4. Market estimates and forecast, by application, 2018 - 2030 (USD Million)
- 7.6.5. Brazil
- 7.6.5.1. Market estimates and forecast, 2018 - 2030 (USD Million)
- 7.6.5.2. Market estimates and forecast, by packaging material, 2018 - 2030 (USD Million)
- 7.6.5.3. Market estimates and forecast, by packaging gas type, 2018 - 2030 (USD Million)
- 7.6.5.4. Market estimates and forecast, by application, 2018 - 2030 (USD Million)
- 7.6.6. Argentina
- 7.6.6.1. Market estimates and forecast, 2018 - 2030 (USD Million)
- 7.6.6.2. Market estimates and forecast, by packaging material, 2018 - 2030 (USD Million)
- 7.6.6.3. Market estimates and forecast, by packaging gas type, 2018 - 2030 (USD Million)
- 7.6.6.4. Market estimates and forecast, by application, 2018 - 2030 (USD Million)
- 7.7. Middle East & Africa
- 7.7.1. Market estimates and forecast, 2018 - 2030 (USD Million)
- 7.7.2. Market estimates and forecast, by packaging material, 2018 - 2030 (USD Million)
- 7.7.3. Market estimates and forecast, by packaging gas type, 2018 - 2030 (USD Million)
- 7.7.4. Market estimates and forecast, by application, 2018 - 2030 (USD Million)
- 7.7.5. GCC Countries
- 7.7.5.1. Market estimates and forecast, 2018 - 2030 (USD Million)
- 7.7.5.2. Market estimates and forecast, by packaging material, 2018 - 2030 (USD Million)
- 7.7.5.3. Market estimates and forecast, by packaging gas type, 2018 - 2030 (USD Million)
- 7.7.5.4. Market estimates and forecast, by application, 2018 - 2030 (USD Million)
- 7.7.6. South Africa
- 7.7.6.1. Market estimates and forecast, 2018 - 2030 (USD Million)
- 7.7.6.2. Market estimates and forecast, by packaging material, 2018 - 2030 (USD Million)
- 7.7.6.3. Market estimates and forecast, by packaging gas type, 2018 - 2030 (USD Million)
- 7.7.6.4. Market estimates and forecast, by application, 2018 - 2030 (USD Million)
Chapter 8. Competitive Landscape
- 8.1. Recent Developments & Impact Analysis, By Key Market Participants
- 8.2. Vendor Landscape
- 8.2.1. Company categorization
- 8.2.2. List of Key Distributors and channel Partners
- 8.2.3. List of Potential Customers/End-users
- 8.3. Competitive Dynamics
- 8.3.1. Company Market Share Analysis & Market Positioning
- 8.3.2. Competitive Benchmarking
- 8.3.3. Strategy Mapping
- 8.3.4. Heat Map Analysis
- 8.4. Company Profiles/Listing
- 8.4.1. Participant's overview
- 8.4.2. Financial performance
- 8.4.3. Product benchmarking
- 8.4.3.1. Air Products and Chemicals, Inc.
- 8.4.3.2. Linde plc
- 8.4.3.3. Praxair, Inc.
- 8.4.3.4. Amcor plc
- 8.4.3.5. Berry Global, Inc.
- 8.4.3.6. Sealed Air Corporation
- 8.4.3.7. MULTIVAC Group
- 8.4.3.8. Multisorb Technologies Inc.
- 8.4.3.9. Colpac Limited
