|
|
市場調査レポート
商品コード
1433684
スムージーの市場規模、シェア、動向分析レポート:製品別、流通チャネル別、地域別、セグメント別予測、2024年~2030年Smoothies Market Size, Share & Trends Analysis Report By Product (Fruit-based, Dairy-based), By Distribution Channel (Restaurants, Smoothie Bars, Supermarkets & Convenience Stores), By Region, And Segment Forecasts, 2024 - 2030 |
||||||
|
|||||||
カスタマイズ可能
|
|||||||

| スムージーの市場規模、シェア、動向分析レポート:製品別、流通チャネル別、地域別、セグメント別予測、2024年~2030年 |
|
出版日: 2024年01月04日
発行: Grand View Research
ページ情報: 英文 80 Pages
納期: 2~10営業日
|

全表示
- 概要
- 図表
- 目次
スムージー市場の成長と動向:
Grand View Research, Inc.の最新レポートによると、世界のスムージー市場規模は2024年から2030年にかけてCAGR 9.3%で成長し、2030年には230億8,000万米ドルに達する見込みです。
スムージー消費の世界の増加は、健康と利便性の動向の相乗効果によってもたらされています。消費者がますます健康的なライフスタイルを優先するようになる中、スムージーは便利で栄養価の高い選択肢の代表であり、果物、野菜、多くの場合タンパク質が豊富な添加物のブレンドを提供します。バランスの取れた食生活の重要性に対する意識の高まりと、外出先でも栄養を摂りたいという願望が、栄養目標を達成するための手軽で簡単な方法としてスムージーの人気を牽引すると予想されます。
スムージーの市場は、健康とウェルネスに対する消費者の意識の高まりによって、近年著しい成長を遂げています。食生活に対する意識が高まるにつれ、栄養価が高く手軽な飲食品に対する需要が高まっています。果物や野菜をブレンドし、サプリメントを加えることも多いスムージーは、必須栄養素を素早くおいしく摂取する方法を提供することで、この需要に応えています。スムージーが消費者の嗜好の主流に浸透していることは、カフェやジュースバー、さらには食料品店の包装済み商品として一般的に見られるようになったことからも明らかです。
メーカーは、さまざまな健康目標に沿った製品を発売することで、こうした嗜好の進化に対応しています。例えば、2022年10月、冷凍食品ブランドのブレンダー・バイツ(Blender Bites)は、新製品の発売を通じて免疫力サポートを強調しました。このブランドは、特にスムージー用の、プレミアムでオーガニック、かつ植物由来の小分け済み冷凍機能性食品を製造していることで知られ、免疫系機能の天然サポーターである高濃度のビタミンAによって免疫力を高めるように設計された革新的なスムージー、デイリー・ディフェンCを発売しました。このスムージーにはビタミンCとEも豊富に含まれ、15種類の有機ビタミンとミネラルがブレンドされています。現在の健康動向に合わせて、Daily Defen-Cは生姜、ウコン、プロバイオティクスなどの人気成分を取り入れ、消費者に包括的で健康志向の選択肢を提供しています。
市場関係者はまた、乳幼児に健康志向で栄養豊富な選択肢を優先する消費者をターゲットにしています。例えば、2023年1月、著名な保存可能な乳幼児用食品ブランドであるセレニティ・キッズは、乳製品不使用のスムージー+プロテインパウチの新製品4種類を発表しました。これらの画期的なベビーフード製品は、牧草飼育のコラーゲンから抽出したタンパク質を組み込んだ市場初の製品です。ベリー・バターナッツ、サツマイモ・スパイス、パンプキン・スパイス、キャロット・ビートの革新的なフレーバーで、それぞれ乳幼児向けに高品質で栄養豊富な選択肢を提供しています。
スムージー市場レポートのハイライト
- 製品別では、フルーツベーススムージーセグメントが2023年に51.6%収益シェアを占めました。果物は、必須ビタミン、ミネラル、抗酸化物質を含む栄養成分で広く認知されています。このため、消費者はフルーツベーススムージーを健康やウェルネスと結びつけることが多くなっています。
- スムージー・バーを通じたスムージーの販売は、2023年の売上シェアの44.0%を占めました。スムージーバーは、消費者に特定の果物、野菜、ベース、添加物を選んで飲み物をカスタマイズするオプションを提供します。
- 2023年売上高シェアは45.5%で、北米が市場を独占しました。北米における健康飲料人気高まりが地域市場成長に大きく寄与しています。
目次
第1章 調査手法と範囲
第2章 エグゼクティブサマリー
第3章 スムージー市場の変数、動向、範囲
- 市場系統の見通し
- 業界のバリューチェーン分析
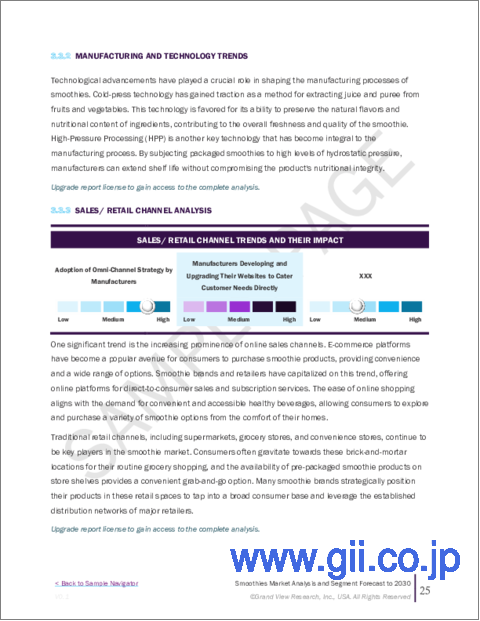
- 販売/小売チャネル分析
- 利益率分析
- 市場力学
- 市場促進要因分析
- 市場抑制要因分析
- 業界の課題
- 業界の機会
- 事業環境分析
- 業界分析- ポーターのファイブフォース分析
- 市場参入戦略
第4章 消費者行動分析
- 消費者の動向と好み
- 購入決定に影響を与える要因
- 消費者向け製品の採用
- 所見と推奨事項
第5章 スムージー市場:製品推定・動向分析
- 製品変動分析と市場シェア、2023年と2030年
- フルーツベース
- 乳製品ベース
- その他
第6章 ムージー市場:流通チャネルの推定・動向分析
- 流通チャネルの変動分析と市場シェア、2023年と2030年
- レストラン
- スムージーバー
- スーパーマーケット・コンビニエンスストア
- その他
第7章 スムージー市場:地域推定・動向分析
- 地域変動分析と市場シェア、2023年と2030年
- 北米
- 市場推計・予測、2018~2030年
- 製品別、2018~2030年
- 流通チャネル別、2018~2030年
- 米国
- カナダ
- メキシコ
- 欧州
- 市場推計・予測、2018~2030年
- 製品別、2018~2030年
- 流通チャネル別、2018~2030年
- 英国
- ドイツ
- イタリア
- フランス
- ロシア
- アジア太平洋地域
- 市場推計・予測、2018~2030年
- 製品別、2018~2030年
- 流通チャネル別、2018~2030年
- 中国
- 日本
- インド
- オーストラリア
- 中南米
- 市場推計・予測、2018~2030年
- 製品別、2018~2030年
- 流通チャネル別、2018~2030年
- ブラジル
- アルゼンチン
- 中東とアフリカ
- 市場推計・予測、2018~2030年
- 製品別、2018~2030年
- 流通チャネル別、2018~2030年
- 南アフリカ
- サウジアラビア
第8章 競合分析
- 主要な市場参入企業による最近の動向と影響分析
- 企業の分類
- 参入企業の概要
- 財務実績
- 製品のベンチマーク
- 企業の市場シェア分析、2023年(%)
- 企業ヒートマップ分析
- 戦略マッピング
- このセクションで分析される主要企業のリストは次のとおりです。
- Barfresh Food Group, Inc.
- Bolthouse Farms
- Ella's Kitchen Ltd
- innocent ltd
- Jamba Juice LLC
- Maui Wowi Hawaiian Coffees &Smoothies
- Smoothie King
- Suja Juice
- Tropical Smoothie Cafe
- The Smoothie Company
List of Tables
- Table 1 Smoothies market - Driving factor market analysis.
- Table 2 Smoothies market - Restraint factor market analysis
- Table 3 Smoothies market estimates & forecasts, by product (USD Million)
- Table 4 Smoothies market estimates & forecasts, by distribution channel (USD Million)
- Table 5 Smoothies market: Regional key takeaways
- Table 6 Smoothies market estimates & forecasts, by region (USD Million)
- Table 7 North America smoothies market estimates & forecasts, by product (USD Million)
- Table 8 North America smoothies market estimates & forecasts, by distribution channel (USD Million)
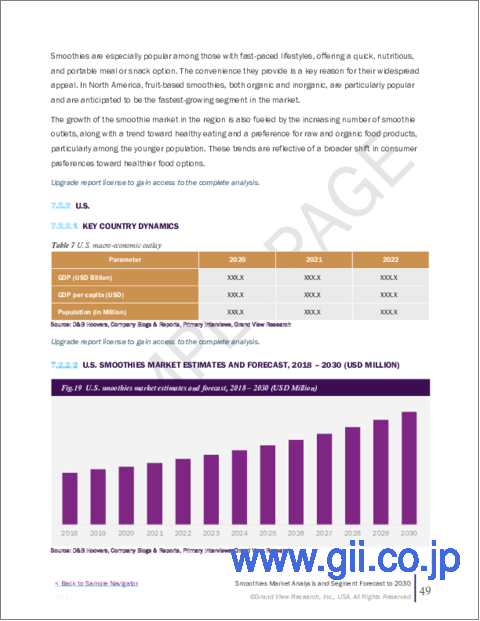
- Table 9 U.S. macro-economic outlay
- Table 10 U.S. smoothies market estimates & forecasts, by product (USD Million)
- Table 11 U.S. smoothies market estimates & forecasts, by distribution channel (USD Million)
- Table 12 Mexico macro-economic outlay
- Table 13 Canada smoothies market estimates & forecasts, by product (USD Million)
- Table 14 Canada smoothies market estimates & forecasts, by distribution channel (USD Million)
- Table 15 Mexico macro-economic outlay
- Table 16 Mexico smoothies market estimates & forecasts, by product (USD Million)
- Table 17 Mexico smoothies market estimates & forecasts, by distribution channel (USD Million)
- Table 18 Europe smoothies market estimates & forecasts, by product (USD Million)
- Table 19 Europe smoothies market estimates & forecasts, by distribution channel (USD Million)
- Table 20 UK macro-economic outlay
- Table 21 UK smoothies market estimates & forecasts, by product (USD Million)
- Table 22 UK smoothies market estimates & forecasts, by distribution channel (USD Million)
- Table 23 Germany macro-economic outlay
- Table 24 Germany smoothies market estimates & forecasts, by product (USD Million)
- Table 25 Germany smoothies market estimates & forecasts, by distribution channel (USD Million)
- Table 26 France macro-economic outlay
- Table 27 France smoothies market estimates & forecasts, by product (USD Million)
- Table 28 France smoothies market estimates & forecasts, by distribution channel (USD Million)
- Table 29 Russia macro-economic outlay
- Table 30 Russia smoothies market estimates & forecasts, by product (USD Million)
- Table 31 Russia smoothies market estimates & forecasts, by distribution channel (USD Million)
- Table 32 Italy macro-economic outlay
- Table 33 Italy smoothies market estimates & forecasts, by product (USD Million)
- Table 34 Italy smoothies market estimates & forecasts, by distribution channel (USD Million)
- Table 35 Asia Pacific smoothies market estimates & forecasts, by product (USD Million)
- Table 36 Asia Pacific smoothies market estimates & forecasts, by distribution channel (USD Million)
- Table 37 China macro-economic outlay
- Table 38 China smoothies market estimates & forecasts, by product (USD Million)
- Table 39 China smoothies market estimates & forecasts, by distribution channel (USD Million)
- Table 40 India macro-economic outlay
- Table 41 India smoothies market estimates & forecasts, by product (USD Million)
- Table 42 India smoothies market estimates & forecasts, by distribution channel (USD Million)
- Table 43 Japan macro-economic outlay
- Table 44 Japan smoothies market estimates & forecasts, by product (USD Million)
- Table 45 Japan smoothies market estimates & forecasts, by distribution channel (USD Million)
- Table 46 Australia macro-economic outlay
- Table 47 Australia smoothies market estimates & forecasts, by product (USD Million)
- Table 48 Australia smoothies market estimates & forecasts, by distribution channel (USD Million)
- Table 49 Central & South America smoothies market estimates & forecasts, by product (USD Million)
- Table 50 Central & South America smoothies market estimates & forecasts, by distribution channel (USD Million)
- Table 51 Brazil macro-economic outlay
- Table 52 Brazil smoothies market estimates & forecasts, by product (USD Million)
- Table 53 Brazil smoothies market estimates & forecasts, by distribution channel (USD Million)
- Table 54 Argentina macro-economic outlay
- Table 55 Argentina smoothies market estimates & forecasts, by product (USD Million)
- Table 56 Argentina smoothies market estimates & forecasts, by distribution channel (USD Million)
- Table 57 Middle East & Africa smoothies market estimates & forecasts, by product (USD Million)
- Table 58 Middle East & Africa smoothies market estimates & forecasts, by distribution channel (USD Million)
- Table 59 Saudi Arabia macro-economic outlay
- Table 60 Saudi Arabia smoothies market estimates & forecasts, by product (USD Million)
- Table 61 Saudi Arabia smoothies market estimates & forecasts, by distribution channel (USD Million)
- Table 62 South Africa macro-economic outlay
- Table 63 South Africa smoothies market estimates & forecasts, by product (USD Million)
- Table 64 South Africa smoothies market estimates & forecasts, by distribution channel (USD Million)
- Table 65 Company categorization
- Table 66 Company market share analysis, 2023 (in %)
List of Figures
- Fig. 1 Smoothies market segmentation
- Fig. 2 Information procurement
- Fig. 3 Primary research pattern
- Fig. 4 Primary research approaches
- Fig. 5 Primary research process
- Fig. 6 Market snapshot
- Fig. 7 Product segment snapshot
- Fig. 8 Distribution channel segment snapshot
- Fig. 9 Competitive landscape snapshot
- Fig. 10 Global smoothies market size, 2017 to 2030 (USD Billion)
- Fig. 11 Smoothies market: Penetration & growth prospect mapping
- Fig. 12 Smoothies market: Value chain analysis
- Fig. 13 Market Dynamics
- Fig. 14 Smoothies Market: Porter's five forces analysis
- Fig. 15 Global smoothies market: Roadmap
- Fig. 16 Factors affecting buying decisions for smoothies
- Fig. 17 Smoothies market, by product: Key takeaways
- Fig. 18 Smoothies market, by product: Market share, 2023 & 2030
- Fig. 19 Fruit-based smoothies market estimates & forecasts, 2018 - 2030 (USD Million)
- Fig. 20 Dairy-based smoothies market estimates & forecasts, 2018 - 2030 (USD Million)
- Fig. 21 Other-product type smoothies market estimates & forecasts, 2018 - 2030 (USD Million)
- Fig. 22 Smoothies market, by distribution channel: Key takeaways
- Fig. 23 Smoothies market, by distribution channel: Market share, 2023 & 2030
- Fig. 24 Smoothies market estimates & forecasts through restaurants, 2018 - 2030 (USD Million)
- Fig. 25 Smoothies market estimates & forecasts through smoothie bars, 2018 - 2030 (USD Million)
- Fig. 26 Smoothies market estimates & forecasts through supermarkets & convenience stores, 2018 - 2030 (USD Million)
- Fig. 27 Smoothies market estimates & forecasts through other channels, 2018 - 2030 (USD Million)
- Fig. 28 Smoothies market size (2023 & 2030; USD Million) and CAGR (2024 - 2030; in %), by region
- Fig. 29 North America smoothies market estimates & forecasts, 2018 - 2030 (USD Million)
- Fig. 30 U.S. smoothies market estimates & forecasts, 2018 - 2030 (USD Million)
- Fig. 31 Canada smoothies market estimates & forecasts, 2018 - 2030 (USD Million)
- Fig. 32 Mexico smoothies market estimates & forecasts, 2018 - 2030 (USD Million)
- Fig. 33 Europe smoothies market estimates & forecasts, 2018 - 2030 (USD Million)
- Fig. 34 UK smoothies market estimates & forecasts, 2018 - 2030 (USD Million)
- Fig. 35 Germany smoothies market estimates & forecasts, 2018 - 2030 (USD Million)
- Fig. 36 France smoothies market estimates & forecasts, 2018 - 2030 (USD Million)
- Fig. 37 Russia smoothies market estimates & forecasts, 2018 - 2030 (USD Million)
- Fig. 38 Italy smoothies market estimates & forecasts, 2018 - 2030 (USD Million)
- Fig. 39 Asia Pacific smoothies market estimates & forecasts, 2018 - 2030 (USD Million)
- Fig. 40 China smoothies market estimates & forecasts, 2018 - 2030 (USD Million)
- Fig. 41 India smoothies market estimates & forecasts, 2018 - 2030 (USD Million)
- Fig. 42 Japan smoothies market estimates & forecasts, 2018 - 2030 (USD Million)
- Fig. 43 Australia smoothies market estimates & forecasts, 2018 - 2030 (USD Million)
- Fig. 44 Central & South America smoothies market estimates & forecasts, 2018 - 2030 (USD Million)
- Fig. 45 Brazil smoothies market estimates & forecasts, 2018 - 2030 (USD Million)
- Fig. 46 Argentina smoothies market estimates & forecasts, 2018 - 2030 (USD Million)
- Fig. 47 Middle East & Africa smoothies market estimates & forecasts, 2018 - 2030 (USD Million)
- Fig. 48 Saudi Arabia smoothies market estimates & forecasts, 2018 - 2030 (USD Million)
- Fig. 49 South Africa smoothies market estimates & forecasts, 2018 - 2030 (USD Million)
- Fig. 50 Key smoothies company market share analysis, 2023
Smoothies Market Growth & Trends:
The global smoothies market size is expected to reach USD 23.08 billion by 2030, growing at a CAGR of 9.3% from 2024 to 2030, according to a new report by Grand View Research, Inc. The global rise in smoothie consumption is driven by a synergy of health and convenience trends. As consumers increasingly prioritize healthier lifestyles, smoothies represent a convenient and nutritious option, offering a blend of fruits, vegetables, and often protein-rich additives. The growing awareness of the importance of a balanced diet and the desire for on-the-go nutrition is expected to drive the popularity of smoothies as a quick and easy way to meet nutritional goals.
The market for smoothies has experienced significant growth in recent years, driven by increasing consumer awareness of health and wellness. As people became more conscious of their dietary choices, the demand for nutritious and convenient food and beverage options has risen. Smoothies, with their blend of fruits, vegetables, and often added supplements, cater to this demand by offering a quick and tasty way to consume essential nutrients. The penetration of smoothies into mainstream consumer preferences is evident, as they are now commonly found in cafes, juice bars, and even as pre-packaged products in grocery stores.
Manufacturers are responding to these evolving preferences by launching products that align with various health goals. For instance, in October 2022, Blender Bites, a frozen food brand, emphasized immunity support through the launch of a new product. Known for producing premium, organic, and plant-based pre-portioned frozen functional foods, especially for smoothies, the brand introduced Daily Defen-C, an innovative smoothie designed to boost immunity through high levels of vitamin A, a natural supporter of immune system function. The smoothie is also rich in vitamins C and E and includes a blend of 15 organic vitamins and minerals. To align with current health trends, Daily Defen-C incorporates popular ingredients like ginger, turmeric, and probiotics, providing a comprehensive and health-conscious option for consumers.
The market players are also targeting consumers who prioritize health-conscious and nutrient-rich options for their babies and toddlers. For instance, in January 2023, Serenity Kids, a prominent shelf-stable baby and toddler food brand, unveiled four new Dairy-Free Smoothie + Protein pouch varieties. These groundbreaking baby food products were the first in the market to incorporate protein from grass-fed collagen. The innovative flavors are Berry Butternut, Sweet Potato Spice, Pumpkin Spice, and Carrot& Beet, each offering high-quality and nutrient-rich options for babies and toddlers.
Smoothies Market Report Highlights:
- Based on product, the fruit-based smoothie segment dominated with a revenue share of 51.6% in 2023. Fruits are widely recognized for their nutritional content, including essential vitamins, minerals, and antioxidants. This has led consumers to often associate fruit-based smoothies with health and wellness.
- The sales of smoothies through smoothie bars accounted for a 44.0% of the revenue share in 2023. Smoothie bars offer consumers the option to customize their drinks by choosing specific fruits, vegetables, bases, and add-ins.
- North America dominated the market with a revenue share of 45.5% in 2023. The increasing popularity of healthy beverages in North America is significantly contributing to the growth regional market.
Table of Contents
Chapter 1. Methodology and Scope
- 1.1. Market Segmentation & Scope
- 1.2. Market Definition
- 1.3. Information Procurement
- 1.3.1. Purchased Database
- 1.3.2. GVR's Internal Database
- 1.3.3. Secondary Products & Third-Party Perspectives
- 1.3.4. Primary Research
- 1.4. Information Analysis
- 1.4.1. Data Analysis Models
- 1.5. Market Formulation & Data Visualization
- 1.6. Data Validation & Publishing
Chapter 2. Executive Summary
- 2.1. Market Outlook
- 2.2. Segmental Outlook
- 2.3. Regional Outlook
Chapter 3. Smoothies Market Variables, Trends & Scope
- 3.1. Market Lineage Outlook
- 3.2. Industry Value Chain Analysis
- 3.2.1. Sales/Retail Channel Analysis
- 3.2.2. Profit Margin Analysis
- 3.3. Market Dynamics
- 3.3.1. Market Driver Analysis
- 3.3.2. Market Restraint Analysis
- 3.3.3. Industry Challenges
- 3.3.4. Industry Opportunities
- 3.4. Business Environment Analysis
- 3.4.1. Industry Analysis - Porter's
- 3.4.1.1. Supplier Power
- 3.4.1.2. Buyer Power
- 3.4.1.3. Substitution Threat
- 3.4.1.4. Threat from New Entrants
- 3.4.1.5. Competitive Rivalry
- 3.4.1. Industry Analysis - Porter's
- 3.5. Market Entry Strategies
Chapter 4. Consumer Behavior Analysis
- 4.1. Consumer Trends and Preferences
- 4.2. Factors Affecting Buying Decision
- 4.3. Consumer Product Adoption
- 4.4. Observations & Recommendations
Chapter 5. Smoothies Market: Product Estimates & Trend Analysis
- 5.1. Product Movement Analysis & Market Share, 2023 & 2030
- 5.2. Fruit-based
- 5.2.1. Market estimates and forecast, 2018 - 2030 (USD Million)
- 5.3. Dairy-based
- 5.3.1. Market estimates and forecast, 2018 - 2030 (USD Million)
- 5.4. Others
- 5.4.1. Market estimates and forecast, 2018 - 2030 (USD Million)
Chapter 6. moothies Market: Distribution Channel Estimates & Trend Analysis
- 6.1. Distribution Channel Movement Analysis & Market Share, 2023 & 2030
- 6.2. Restaurants
- 6.2.1. Market estimates and forecast, 2018 - 2030 (USD Million)
- 6.3. Smoothies Bars
- 6.3.1. Market estimates and forecast, 2018 - 2030 (USD Million)
- 6.4. Supermarkets & Convienience Stores
- 6.4.1. Market estimates and forecast, 2018 - 2030 (USD Million)
- 6.5. Others
- 6.5.1. Market estimates and forecast, 2018 - 2030 (USD Million)
Chapter 7. Smoothies Market: Regional Estimates & Trend Analysis
- 7.1. Regional Movement Analysis & Market Share, 2023 & 2030
- 7.2. North America
- 7.2.1. Market estimates and forecast, 2018 - 2030 (USD Million)
- 7.2.2. Market estimates and forecast, by product, 2018 - 2030 (USD Million)
- 7.2.3. Market estimates and forecast, by distribution channel, 2018 - 2030 (USD Million)
- 7.2.4. U.S.
- 7.2.4.1. Market estimates and forecast, 2018 - 2030 (USD Million)
- 7.2.4.2. Market estimates and forecast, by product, 2018 - 2030 (USD Million)
- 7.2.4.3. Market estimates and forecast, by distribution channel, 2018 - 2030 (USD Million)
- 7.2.5. Canada
- 7.2.5.1. Market estimates and forecast, 2018 - 2030 (USD Million)
- 7.2.5.2. Market estimates and forecast, by product, 2018 - 2030 (USD Million)
- 7.2.5.3. Market estimates and forecast, by distribution channel, 2018 - 2030 (USD Million)
- 7.2.6. Mexico
- 7.2.6.1. Market estimates and forecast, 2018 - 2030 (USD Million)
- 7.2.6.2. Market estimates and forecast, by product, 2018 - 2030 (USD Million)
- 7.2.6.3. Market estimates and forecast, by distribution channel, 2018 - 2030 (USD Million)
- 7.3. Europe
- 7.3.1. Market estimates and forecast, 2018 - 2030 (USD Million)
- 7.3.2. Market estimates and forecast, by product, 2018 - 2030 (USD Million)
- 7.3.3. Market estimates and forecast, by distribution channel, 2018 - 2030 (USD Million)
- 7.3.4. UK
- 7.3.4.1. Market estimates and forecast, 2018 - 2030 (USD Million)
- 7.3.4.2. Market estimates and forecast, by product, 2018 - 2030 (USD Million)
- 7.3.4.3. Market estimates and forecast, by distribution channel, 2018 - 2030 (USD Million)
- 7.3.5. Germany
- 7.3.5.1. Market estimates and forecast, 2018 - 2030 (USD Million)
- 7.3.5.2. Market estimates and forecast, by product, 2018 - 2030 (USD Million)
- 7.3.5.3. Market estimates and forecast, by distribution channel, 2018 - 2030 (USD Million)
- 7.3.6. Italy
- 7.3.6.1. Market estimates and forecast, 2018 - 2030 (USD Million)
- 7.3.6.2. Market estimates and forecast, by product, 2018 - 2030 (USD Million)
- 7.3.6.3. Market estimates and forecast, by distribution channel, 2018 - 2030 (USD Million)
- 7.3.7. France
- 7.3.7.1. Market estimates and forecast, 2018 - 2030 (USD Million)
- 7.3.7.2. Market estimates and forecast, by product, 2018 - 2030 (USD Million)
- 7.3.7.3. Market estimates and forecast, by distribution channel, 2018 - 2030 (USD Million)
- 7.3.8. Russia
- 7.3.8.1. Market estimates and forecast, 2018 - 2030 (USD Million)
- 7.3.8.2. Market estimates and forecast, by product, 2018 - 2030 (USD Million)
- 7.3.8.3. Market estimates and forecast, by distribution channel, 2018 - 2030 (USD Million)
- 7.4. Asia Pacific
- 7.4.1. Market estimates and forecast, 2018 - 2030 (USD Million)
- 7.4.2. Market estimates and forecast, by product, 2018 - 2030 (USD Million)
- 7.4.3. Market estimates and forecast, by distribution channel, 2018 - 2030 (USD Million)
- 7.4.4. China
- 7.4.4.1. Market estimates and forecast, 2018 - 2030 (USD Million)
- 7.4.4.2. Market estimates and forecast, by product, 2018 - 2030 (USD Million)
- 7.4.4.3. Market estimates and forecast, by distribution channel, 2018 - 2030 (USD Million)
- 7.4.5. Japan
- 7.4.5.1. Market estimates and forecast, 2018 - 2030 (USD Million)
- 7.4.5.2. Market estimates and forecast, by product, 2018 - 2030 (USD Million)
- 7.4.5.3. Market estimates and forecast, by distribution channel, 2018 - 2030 (USD Million)
- 7.4.6. India
- 7.4.6.1. Market estimates and forecast, 2018 - 2030 (USD Million)
- 7.4.6.2. Market estimates and forecast, by product, 2018 - 2030 (USD Million)
- 7.4.6.3. Market estimates and forecast, by distribution channel, 2018 - 2030 (USD Million)
- 7.4.7. Australia
- 7.4.7.1. Market estimates and forecast, 2018 - 2030 (USD Million)
- 7.4.7.2. Market estimates and forecast, by product, 2018 - 2030 (USD Million)
- 7.4.7.3. Market estimates and forecast, by distribution channel, 2018 - 2030 (USD Million)
- 7.5. Central & South America
- 7.5.1. Market estimates and forecast, 2018 - 2030 (USD Million)
- 7.5.2. Market estimates and forecast, by product, 2018 - 2030 (USD Million)
- 7.5.3. Market estimates and forecast, by distribution channel, 2018 - 2030 (USD Million)
- 7.5.4. Brazil
- 7.5.4.1. Market estimates and forecast, 2018 - 2030 (USD Million)
- 7.5.4.2. Market estimates and forecast, by product, 2018 - 2030 (USD Million)
- 7.5.4.3. Market estimates and forecast, by distribution channel, 2018 - 2030 (USD Million)
- 7.5.5. Argentina
- 7.5.5.1. Market estimates and forecast, 2018 - 2030 (USD Million)
- 7.5.5.2. Market estimates and forecast, by product, 2018 - 2030 (USD Million)
- 7.5.5.3. Market estimates and forecast, by distribution channel, 2018 - 2030 (USD Million)
- 7.6. Middle East & Africa
- 7.6.1. Market estimates and forecast, 2018 - 2030 (USD Million)
- 7.6.2. Market estimates and forecast, by product, 2018 - 2030 (USD Million)
- 7.6.3. Market estimates and forecast, by distribution channel, 2018 - 2030 (USD Million)
- 7.6.4. South Africa
- 7.6.4.1. Market estimates and forecast, 2018 - 2030 (USD Million)
- 7.6.4.2. Market estimates and forecast, by product, 2018 - 2030 (USD Million)
- 7.6.4.3. Market estimates and forecast, by distribution channel, 2018 - 2030 (USD Million)
- 7.6.5. Saudi Arabia
- 7.6.5.1. Market estimates and forecast, 2018 - 2030 (USD Million)
- 7.6.5.2. Market estimates and forecast, by product, 2018 - 2030 (USD Million)
- 7.6.5.3. Market estimates and forecast, by distribution channel, 2018 - 2030 (USD Million)
Chapter 8. Competitive Analysis
- 8.1. Recent developments & impact analysis, by key market participants
- 8.2. Company Categorization
- 8.3. Participant's Overview
- 8.4. Financial Performance
- 8.5. Product Benchmarking
- 8.6. Company Market Share Analysis, 2023 (%)
- 8.7. Company Heat Map Analysis
- 8.8. Strategy Mapping
- 8.9. List of key companies analyzed in this section include:
- 8.9.1. Barfresh Food Group, Inc.
- 8.9.2. Bolthouse Farms
- 8.9.3. Ella's Kitchen Ltd
- 8.9.4. innocent ltd
- 8.9.5. Jamba Juice LLC
- 8.9.6. Maui Wowi Hawaiian Coffees & Smoothies
- 8.9.7. Smoothie King
- 8.9.8. Suja Juice
- 8.9.9. Tropical Smoothie Cafe
- 8.9.10. The Smoothie Company

