
|
市場調査レポート
商品コード
1801915
海洋タンパク質加水分解物の市場機会、成長促進要因、産業動向分析、2025年~2034年予測Marine Protein Hydrolysate Market Opportunity, Growth Drivers, Industry Trend Analysis, and Forecast 2025 - 2034 |
||||||
カスタマイズ可能
|
|||||||
| 海洋タンパク質加水分解物の市場機会、成長促進要因、産業動向分析、2025年~2034年予測 |
|
出版日: 2025年08月14日
発行: Global Market Insights Inc.
ページ情報: 英文 210 Pages
納期: 2~3営業日
|

全表示
- 概要
- 目次
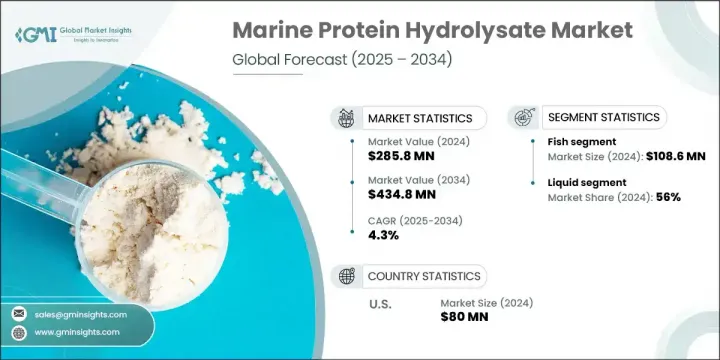
海洋タンパク質加水分解物の世界市場は、2024年に2億8,580万米ドルと評価され、CAGR4.3%で成長し、2034年までには4億3,480万米ドルに達すると推定されています。
この成長の原動力は、食品・飲料、水産飼料、栄養補助食品、医薬品の各分野における需要の高まりです。クリーンラベル原料や持続可能な調達への注目が高まる中、海洋タンパク質加水分解物はその機能的・栄養的利点から人気を集めています。特に欧州のような成分規制の厳しい地域では、天然添加物としての利用が増加しています。加工技術の継続的な進歩と健康志向の消費者層の世界の拡大が、技術革新と市場拡大に拍車をかけています。さらに、持続可能な原材料への移行と環境に優しい生産ソリューションへのニーズが、特に健康主導の経済圏で市場の成長を支えています。
このような進展にもかかわらず、業界は依然として供給サイドの課題に直面しています。海洋タンパク質加水分解物は、基材として魚類、甲殻類、藻類に大きく依存しています。環境の変化、乱獲、規制の制限は、しばしば入手性を妨げ、コストの変動につながります。これらの要因は生産と価格設定の不安定につながり、サプライチェーン全体に影響を及ぼし、市場の一貫した成長に対する潜在的な障壁となります。
| 市場範囲 | |
|---|---|
| 開始年 | 2024年 |
| 予測年 | 2025年~2034年 |
| 開始金額 | 2億8,580万米ドル |
| 予測金額 | 4億3,480万米ドル |
| CAGR | 4.3% |
魚類セグメントは、その豊富なタンパク質プロファイル、消化性、動物飼料、サプリメント、機能性食品との適合性を背景に、2024年に1億860万米ドルを創出しました。調達と加工のインフラが確立されているため、魚由来の加水分解物は動物栄養と食事の両分野で好ましい選択肢となっています。甲殻類もまた、その生物活性化合物の濃縮度と、コスト効率に優れ、廃棄物を削減する加水分解物生産における役割の増大により、重要な位置を占めています。これらの変種は、その栄養学的利点により、水産養殖や栄養補助食品にますます利用されるようになっています。
液体製剤セグメントは2024年に56%のシェアを占めました。溶解性に優れ、応用が容易なため、養殖飼料や液体栄養補助食品に特に適しています。液体は他の製剤と難なく混合し、特に水生環境では飼料転換と栄養吸収を改善します。これらの特性により、液状海洋タンパク質加水分解物は、栄養補助食品および機能性飲料の両産業において非常に魅力的なものとなっています。
米国の海洋タンパク質加水分解物市場は2024年に8,000万米ドルを生み出しました。この地域は先進的な健康製品を重視し、強力な食品・サプリメント製造インフラが引き続き需要を押し上げています。クリーンラベルの栄養と持続可能性への注目が高まる中、海洋由来の原料はスポーツ栄養、機能性食品、ウェルネス処方により頻繁に取り入れられています。イノベーションと高い規制基準の遵守が、米国を拠点とする産業全体の市場上昇を牽引しています。
海洋タンパク質加水分解物の世界市場で事業を展開する主要企業には、Copalis、Hofseth BioCare、Aker BioMarine、SAMPI、Scanbio、Bio-Marine Ingredients、Socropole、Marutham Bio Ages Innovations、Symriseなどがあります。市場での存在感を高めるため、海洋タンパク質加水分解物分野の企業は、不安定な海洋生態系への依存を減らすため、原料調達ネットワークの拡大に注力しています。加工技術への戦略的投資は、歩留まり、純度、製品の一貫性の向上に役立っています。各ブランドはまた、水産飼料、スポーツ栄養、臨床栄養など特定の最終用途産業向けに処方をカスタマイズしています。研究機関との共同開発により、機能性が実証された生物活性化合物の開発で先行することができます。健康志向の高まる消費者層を取り込むため、企業はクリーンラベルやトレーサビリティのあるサプライチェーンを売りにしています。
目次
第1章 調査手法と範囲
第2章 エグゼクティブサマリー
第3章 業界考察
- 業界エコシステム分析
- サプライヤーの情勢
- 利益率
- 各段階での付加価値
- バリューチェーンに影響を与える要因
- ディスラプション
- 業界への影響要因
- 成長促進要因
- 業界の潜在的リスク・課題
- 市場機会
- 成長可能性分析
- 規制情勢
- 北米
- 欧州
- アジア太平洋
- ラテンアメリカ
- 中東・アフリカ
- ポーターの分析
- PESTEL分析
- テクノロジーとイノベーションの情勢
- 現在の技術動向
- 新興技術
- 価格動向
- 地域別
- ソース別
- 将来の市場動向
- テクノロジーとイノベーションの情勢
- 現在の技術動向
- 新興技術
- 特許情勢
- 貿易統計(HSコード)(注:貿易統計は主要国のみ提供されます)
- 主要輸入国
- 主要輸出国
- 持続可能性と環境側面
- 持続可能な慣行
- 廃棄物削減戦略
- 生産におけるエネルギー効率
- 環境に優しい取り組み
- カーボンフットプリントの考慮
第4章 競合情勢
- イントロダクション
- 企業の市場シェア分析
- 地域別
- 北米
- 欧州
- アジア太平洋
- ラテンアメリカ
- 中東・アフリカ
- 地域別
- 企業マトリックス分析
- 主要市場企業の競合分析
- 競合ポジショニングマトリックス
- 主な発展
- 合併と買収
- パートナーシップとコラボレーション
- 新製品の発売
- 拡張計画
第5章 市場推計・予測:ソース別、2021年~2034年
- 主要動向
- 魚
- 甲殻類
- 藻類
第6章 市場推計・予測:形態別、2021年~2034年
- 主要動向
- 液体
- 粉末
第7章 市場推計・予測:用途別、2021年~2034年
- 主要動向
- 食品・飲料
- 動物飼料
- 医薬品
- その他
第8章 市場推計・予測:地域別、2021年~2034年
- 主要動向
- 北米
- 米国
- カナダ
- 欧州
- ドイツ
- 英国
- フランス
- スペイン
- イタリア
- その他欧州地域
- アジア太平洋
- 中国
- インド
- 日本
- オーストラリア
- 韓国
- その他アジア太平洋
- ラテンアメリカ
- ブラジル
- メキシコ
- アルゼンチン
- その他ラテンアメリカ地域
- 中東・アフリカ
- サウジアラビア
- 南アフリカ
- アラブ首長国連邦
- その他中東・アフリカ地域
第9章 企業プロファイル
- Copalis
- Symrise
- Hofseth BioCare
- Scanbio
- Socropole
- Bio-Marine Ingredients
- Aker BioMarine
- Marutham Bio Ages Innovations
- SAMPI
The Global Marine Protein Hydrolysate Market was valued at USD 285.8 million in 2024 and is estimated to grow at a CAGR of 4.3% to reach USD 434.8 million by 2034. This growth is being driven by rising demand across food and beverage, aquafeed, nutraceutical, and pharmaceutical sectors. As the focus on clean-label ingredients and sustainable sourcing intensifies, marine protein hydrolysates are gaining popularity for their functional and nutritional benefits. Their use as a natural additive is increasing, especially in regions with strict ingredient regulations, such as Europe. Ongoing advancements in processing technologies and expanding health-conscious consumer bases globally are fueling innovation and market expansion. Additionally, the transition toward sustainable raw materials and the need for eco-friendly production solutions support market growth, especially in health-driven economies.
Despite this progress, the industry remains challenged by supply-side issues. Marine protein hydrolysates heavily depend on fish, crustaceans, and algae as base materials. Environmental changes, overfishing, and regulatory limits often disrupt availability and lead to cost fluctuations. These factors contribute to instability in production and pricing, affecting the overall supply chain and posing a potential barrier to consistent growth in the market.
| Market Scope | |
|---|---|
| Start Year | 2024 |
| Forecast Year | 2025-2034 |
| Start Value | $285.8 Million |
| Forecast Value | $434.8 Million |
| CAGR | 4.3% |
The fish segment generated USD 108.6 million in 2024 backed by its rich protein profile, digestibility, and compatibility with animal feed, supplements, and functional foods. The established sourcing and processing infrastructure make fish-based hydrolysates a preferred option in both animal nutrition and dietary sectors. Crustaceans are also significant due to their concentration of bioactive compounds and their growing role in cost-efficient, waste-reducing hydrolysate production. These variants are increasingly utilized in aquaculture and nutraceuticals due to their nutritional advantages.
The liquid formulations segment held 56% share in 2024. Their superior solubility and easy application make them particularly suitable for aquaculture feeds and liquid dietary supplements. Liquids blend effortlessly with other formulations, improving feed conversion and nutrient absorption, especially in aquatic environments. These properties make liquid marine protein hydrolysates highly attractive in both nutraceutical and functional beverage industries.
U.S. Marine Protein Hydrolysate Market was valued at USD 80 million in 2024. The region's emphasis on advanced health products and strong food and supplement manufacturing infrastructure continues to boost demand. With increasing attention to clean-label nutrition and sustainability, marine-based ingredients are being incorporated more frequently into sports nutrition, functional foods, and wellness formulations. Innovation and adherence to high regulatory standards drive the market's upward trajectory across U.S.-based industries.
Key players operating in the Global Marine Protein Hydrolysate Market include Copalis, Hofseth BioCare, Aker BioMarine, SAMPI, Scanbio, Bio-Marine Ingredients, Socropole, Marutham Bio Ages Innovations, and Symrise. To strengthen their market presence, companies in the marine protein hydrolysate space are focusing on expanding raw material sourcing networks to reduce dependency on volatile marine ecosystems. Strategic investments in processing technologies are helping improve yield, purity, and product consistency. Brands are also tailoring formulations for specific end-use industries such as aquafeed, sports nutrition, and clinical nutrition. Collaborations with research institutions allow players to stay ahead in developing bioactive compounds with proven functional benefits. To tap into growing health-conscious consumer segments, businesses are marketing clean-label and traceable supply chain claims.
Table of Contents
Chapter 1 Methodology & Scope
- 1.1 Market scope and definition
- 1.2 Research design
- 1.2.1 Research approach
- 1.2.2 Data collection methods
- 1.3 Data mining sources
- 1.3.1 Global
- 1.3.2 Regional/Country
- 1.4 Base estimates and calculations
- 1.4.1 Base year calculation
- 1.4.2 Key trends for market estimation
- 1.5 Primary research and validation
- 1.5.1 Primary sources
- 1.6 Forecast model
- 1.7 Research assumptions and limitations
Chapter 2 Executive Summary
- 2.1 Industry 360° synopsis
- 2.2 Key market trends
- 2.2.1 Source trends
- 2.2.2 Form trends
- 2.2.3 Application trends
- 2.2.4 Regional trends
- 2.3 TAM Analysis, 2025-2034
- 2.4 CXO perspectives: Strategic imperatives
- 2.4.1 Executive decision points
- 2.4.2 Critical success factors
- 2.5 Future Outlook and Strategic Recommendations
Chapter 3 Industry Insights
- 3.1 Industry ecosystem analysis
- 3.1.1 Supplier landscape
- 3.1.2 Profit margin
- 3.1.3 Value addition at each stage
- 3.1.4 Factor affecting the value chain
- 3.1.5 Disruptions
- 3.2 Industry impact forces
- 3.2.1 Growth drivers
- 3.2.2 Industry pitfalls and challenges
- 3.2.3 Market opportunities
- 3.3 Growth potential analysis
- 3.4 Regulatory landscape
- 3.4.1 North America
- 3.4.2 Europe
- 3.4.3 Asia Pacific
- 3.4.4 Latin America
- 3.4.5 Middle East & Africa
- 3.5 Porter’s analysis
- 3.6 PESTEL analysis
- 3.7 Technology and Innovation landscape
- 3.7.1 Current technological trends
- 3.7.2 Emerging technologies
- 3.8 Price trends
- 3.8.1 By region
- 3.8.2 By Source
- 3.9 Future market trends
- 3.10 Technology and Innovation landscape
- 3.10.1 Current technological trends
- 3.10.2 Emerging technologies
- 3.11 Patent Landscape
- 3.12 Trade statistics (HS code) (Note: the trade statistics will be provided for key countries only)
- 3.12.1 Major importing countries
- 3.12.2 Major exporting countries
- 3.13 Sustainability and environmental aspects
- 3.13.1 Sustainable practices
- 3.13.2 Waste reduction strategies
- 3.13.3 Energy efficiency in production
- 3.13.4 Eco-friendly initiatives
- 3.14 Carbon footprint consideration
Chapter 4 Competitive Landscape, 2024
- 4.1 Introduction
- 4.2 Company market share analysis
- 4.2.1 By region
- 4.2.1.1 North America
- 4.2.1.2 Europe
- 4.2.1.3 Asia Pacific
- 4.2.1.4 LATAM
- 4.2.1.5 MEA
- 4.2.1 By region
- 4.3 Company matrix analysis
- 4.4 Competitive analysis of major market players
- 4.5 Competitive positioning matrix
- 4.6 Key developments
- 4.6.1 Mergers & acquisitions
- 4.6.2 Partnerships & collaborations
- 4.6.3 New product launches
- 4.6.4 Expansion plans
Chapter 5 Market Estimates and Forecast, By Source, 2021-2034 (USD Million) (Kilo Tons)
- 5.1 Key trends
- 5.2 Fish
- 5.3 Crustaceans
- 5.4 Algae
Chapter 6 Market Estimates and Forecast, By Form, 2021-2034 (USD Million) (Kilo Tons)
- 6.1 Key trends
- 6.2 Liquid
- 6.3 Powder
Chapter 7 Market Estimates and Forecast, By Application, 2021-2034 (USD Million) (Kilo Tons)
- 7.1 Key trends
- 7.2 Food and beverages
- 7.3 Animal feed
- 7.4 Pharmaceuticals
- 7.5 Others
Chapter 8 Market Estimates and Forecast, By Region, 2021-2034 (USD Million) (Kilo Tons)
- 8.1 Key trends
- 8.2 North America
- 8.2.1 U.S.
- 8.2.2 Canada
- 8.3 Europe
- 8.3.1 Germany
- 8.3.2 UK
- 8.3.3 France
- 8.3.4 Spain
- 8.3.5 Italy
- 8.3.6 Rest of Europe
- 8.4 Asia Pacific
- 8.4.1 China
- 8.4.2 India
- 8.4.3 Japan
- 8.4.4 Australia
- 8.4.5 South Korea
- 8.4.6 Rest of Asia Pacific
- 8.5 Latin America
- 8.5.1 Brazil
- 8.5.2 Mexico
- 8.5.3 Argentina
- 8.5.4 Rest of Latin America
- 8.6 Middle East and Africa
- 8.6.1 Saudi Arabia
- 8.6.2 South Africa
- 8.6.3 UAE
- 8.6.4 Rest of Middle East and Africa
Chapter 9 Company Profiles
- 9.1 Copalis
- 9.2 Symrise
- 9.3 Hofseth BioCare
- 9.4 Scanbio
- 9.5 Socropole
- 9.6 Bio-Marine Ingredients
- 9.7 Aker BioMarine
- 9.8 Marutham Bio Ages Innovations
- 9.9 SAMPI

