
コネクテッドTV市場の機会、成長促進要因、産業動向分析、2025年~2034年の予測
Connected TV Market Opportunity, Growth Drivers, Industry Trend Analysis, and Forecast 2025-2034- 発行日
- ページ情報
- 英文 487 Pages
- 納期
- 2~3営業日
- 商品コード
- 1699423
- カスタマイズ可能 お客様のご希望に応じて、既存データの加工や未掲載情報(例:国別セグメント)の追加などの対応が可能です。詳細はお問い合わせください。
- 翻訳ツール提供対象 PDF対応AI翻訳ツールの無料貸し出しサービスのご利用が可能です
概要
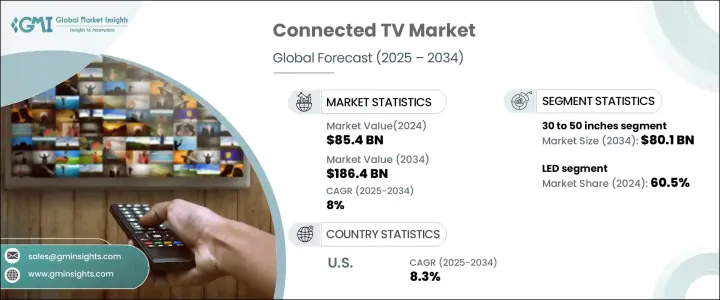
コネクテッドTVの世界市場規模は2024年に854億米ドルとなり、2025年から2034年にかけてCAGR 8%で堅調に拡大すると予測されています。
この着実な成長には、Netflix、Hulu、Amazon Prime Video、Disney+といったストリーミング・プラットフォームの人気急上昇が寄与しています。より多くの消費者が従来のケーブルや衛星放送の契約からオンデマンドのデジタル・コンテンツに移行するにつれて、コネクテッドTVは現代のホーム・エンターテイメントの好ましいメディアとなっています。高速インターネットの普及とスマートホームエコシステムの採用拡大が、市場拡大をさらに加速させています。4Kや8Kの解像度、音声アシスタントの統合、AI主導のコンテンツ推薦などの強化された機能により、コネクテッドTVはユーザーがエンターテインメントにアクセスする方法に革命を起こし、シームレスでパーソナライズされた視聴体験を提供しています。
インターネットを利用したテレビ消費へのシフトはテレビ業界を変革し、メーカーやハイテク企業の多額の投資を促進しています。消費者が他のスマートホーム製品とシームレスに統合された機能豊富なデバイスを求めているため、スマートテレビの普及率は上昇しています。人工知能と機械学習の進歩により、コネクテッドTVは、視聴体験を最適化し、オーダーメイドのおすすめコンテンツを提供できるようになりました。一方、ストリーミング・サービス・プロバイダーは独占コンテンツの提供を拡大し続けており、消費者に高品質のスマートTVへの投資をさらに促しています。これらの動向は市場の上昇軌道を維持し、エンターテインメント分野におけるコネクテッドTVの優位性を確固たるものにすると予想されます。
| 市場範囲 | |
|---|---|
| 開始年 | 2024 |
| 予測年 | 2025-2034 |
| 開始金額 | 854億米ドル |
| 予測金額 | 1,864億米ドル |
| CAGR | 8% |
市場はスクリーンサイズによって区分され、30~50インチのカテゴリーが収益をリードしています。2024年に354億米ドルと評価されたこのセグメントは、2034年には801億米ドルに達すると予測され、家庭で最も好まれる選択肢となっています。このスクリーンサイズは、手頃な価格と没入型視聴の最適なバランスを保ち、多様な消費者層に対応しています。ストリーミング・プラットフォームがより多くの4K Ultra HDコンテンツを提供しているため、このカテゴリーのテレビに対する需要は伸び続けています。中型スマートテレビは、スペースの制約からコンパクトでありながら高品質のエンターテインメント・ソリューションが求められる都市部の住宅で特に人気があります。
技術面では、LEDベースのコネクテッドTVが2024年に60.5%を占め、圧倒的な市場シェアを占めています。これらのテレビは、そのエネルギー効率、耐久性、費用対効果により、依然として最有力な選択肢となっています。LEDテレビは、さまざまな価格帯とスクリーンサイズで広く販売されているため、さまざまな所得層の消費者が非常に利用しやすくなっています。一方、深い黒、高コントラスト、鮮やかな色彩など、優れた画質を提供することで知られるOLED技術は、プレミアムバイヤーの間で支持を集め続けています。OLEDディスプレイは高価格帯であるにもかかわらず、ハイエンドのホームエンタテインメントシステムに対する消費者の関心の高まりによって、普及が進むと予想されます。
米国のコネクテッドTV市場は、先進的で技術に精通したエンターテインメント機器に対する消費者の強い需要を反映して、年間CAGR 8.3%を記録しています。4Kおよび8K HDRのサポート、Alexa、Google Assistant、Siriなどの音声アシスタントとのシームレスな統合、スマートホーム接続の強化などの機能により、コネクテッドTVは現代の家庭に欠かせないものとなっています。高速ブロードバンドの普及が進み、独占ストリーミング・コンテンツのライブラリーが拡大していることも、市場の成長にさらに寄与しています。利便性、機能性、プレミアムな視聴体験を優先する消費者が増えるにつれて、コネクテッドTVの需要は一貫して上昇し、ホームエンターテインメントの未来としての役割を確固たるものにすると予想されます。
目次
第1章 調査手法と調査範囲
第2章 エグゼクティブサマリー
第3章 業界洞察
- エコシステム分析
- バリューチェーンに影響を与える要因
- 利益率分析
- ディスラプション
- 将来の展望
- メーカー
- 流通業者
- 小売業者
- 影響要因
- 促進要因
- ストリーミング・プラットフォームの人気の高まり
- 技術の進歩
- 地域全体でのインターネット普及率の増加
- スマートホーム統合動向の高まり
- 業界の潜在的リスク&課題
- コンテンツの断片化
- インターネット依存
- 促進要因
- 消費者の購買行動分析
- デモグラフィック動向
- 購買決定に影響を与える要因
- 消費者の製品採用
- 好みの流通チャネル
- 希望価格帯
- 成長可能性分析
- 規制状況
- 価格分析
- ポーター分析
- PESTEL分析
第4章 競合情勢
- イントロダクション
- 企業シェア分析
- 競合のポジショニング・マトリックス
- 戦略展望マトリックス
第5章 市場推計・予測:スクリーンサイズ別、2021年~2034年
- 主要動向
- 30インチ未満
- 30~50インチ
- 50~70インチ
- 70インチ以上
第6章 市場推計・予測:技術別、2021年~2034年
- 主要動向
- LED
- OLED
- その他
第7章 市場推計・予測:スクリーンタイプ別、2021年~2034年
- 主要動向
- カーブ
- フラット
第8章 市場推計・予測:解像度別、2021年~2034年
- 主要動向
- 8K
- 4K
- 1080p
- その他
第9章 市場推計・予測:最終用途別、2021年~2034年
- 主要動向
- 住宅
- 商業
第10章 市場推計・予測:流通チャネル別、2021年~2034年
- 主要動向
- オンライン
- オフライン
第11章 地域別市場推計・予測:地域別、2021年~2034年
- 主要動向
- 北米
- 米国
- カナダ
- 欧州
- 英国
- ドイツ
- フランス
- イタリア
- スペイン
- アジア太平洋
- 中国
- 日本
- インド
- 韓国
- オーストラリア
- ラテンアメリカ
- ブラジル
- メキシコ
- 中東・アフリカ
- 南アフリカ
- サウジアラビア
- アラブ首長国連邦
第12章 企業プロファイル
- Amazon
- Apple
- Hisense Group
- LG Electronics
- Panasonic Corporation
- Philips
- Roku, Inc.
- Samsung Electronics
- Sharp Corporation
- Skyworth Group
- Sony Corporation
- TCL Technology
- Vizio Inc.
- Xiaomi Corporation
目次
The Global Connected TV Market was valued at USD 85.4 billion in 2024 and is projected to expand at a robust CAGR of 8% from 2025 to 2034. This steady growth is fueled by the surging popularity of streaming platforms such as Netflix, Hulu, Amazon Prime Video, and Disney+. As more consumers shift away from traditional cable and satellite subscriptions in favor of on-demand digital content, connected TVs have become the preferred medium for modern home entertainment. The increasing availability of high-speed internet and the growing adoption of smart home ecosystems further accelerate market expansion. With enhanced features such as 4K and 8K resolution, voice assistant integration, and AI-driven content recommendations, connected TVs are revolutionizing how users access entertainment, providing a seamless and personalized viewing experience.
The shift toward internet-based television consumption has transformed the TV industry, driving significant investments from manufacturers and tech companies. Smart TV penetration is rising as consumers seek feature-rich devices that integrate seamlessly with other smart home products. Advancements in artificial intelligence and machine learning enable connected TVs to offer tailored content recommendations, optimizing the viewing experience. Meanwhile, streaming service providers continue to expand their offerings with exclusive content, further enticing consumers to invest in high-quality smart TVs. These trends are expected to sustain the market's upward trajectory, solidifying the dominance of connected TVs in the entertainment sector.
| Market Scope | |
|---|---|
| Start Year | 2024 |
| Forecast Year | 2025-2034 |
| Start Value | $85.4 Billion |
| Forecast Value | $186.4 Billion |
| CAGR | 8% |
The market is segmented based on screen size, with the 30 to 50-inch category leading in revenue. Valued at USD 35.4 billion in 2024, this segment is projected to reach USD 80.1 billion by 2034, making it the most preferred choice for households. This screen size strikes an optimal balance between affordability and immersive viewing, catering to a diverse consumer base. With streaming platforms offering more 4K Ultra HD content, the demand for televisions in this category continues to grow. Mid-sized smart TVs are particularly popular in urban homes, where space constraints require a compact yet high-quality entertainment solution.
From a technology standpoint, LED-based connected TVs hold the dominant market share, accounting for 60.5% in 2024. These TVs remain a top choice due to their energy efficiency, durability, and cost-effectiveness. The widespread availability of LED TVs in various price ranges and screen sizes makes them highly accessible to consumers across different income groups. Meanwhile, OLED technology, known for delivering superior picture quality with deep blacks, high contrast, and vibrant colors, continues to gain traction among premium buyers. Despite its higher price point, OLED displays are expected to see increasing adoption, driven by growing consumer interest in high-end home entertainment systems.
U.S. Connected TV Market is witnessing an annual CAGR of 8.3%, reflecting strong consumer demand for advanced, tech-savvy entertainment devices. Features such as 4K and 8K HDR support, seamless integration with voice assistants like Alexa, Google Assistant, and Siri, and enhanced smart home connectivity make connected TVs an essential part of modern households. The growing penetration of high-speed broadband and expanding library of exclusive streaming content further contribute to market growth. As more consumers prioritize convenience, functionality, and premium viewing experiences, the demand for connected TVs is expected to rise consistently, cementing their role as the future of home entertainment.
Table of Contents
Chapter 1 Methodology & Scope
- 1.1 Market scope & definition
- 1.2 Base estimates & calculations
- 1.3 Forecast parameters
- 1.4 Data sources
- 1.4.1 Primary
- 1.5 Secondary
- 1.5.1.1 Paid sources
- 1.5.1.2 Public sources
Chapter 2 Executive Summary
- 2.1 Industry synopsis, 2021 - 2034
Chapter 3 Industry Insights
- 3.1 Industry ecosystem analysis
- 3.1.1 Factor affecting the value chain
- 3.1.2 Profit margin analysis
- 3.1.3 Disruptions
- 3.1.4 Future outlook
- 3.1.5 Manufacturers
- 3.1.6 Distributors
- 3.1.7 Retailers
- 3.2 Impact forces
- 3.2.1 Growth drivers
- 3.2.1.1 Growing popularity of streaming platforms
- 3.2.1.2 Technological advancements
- 3.2.1.3 Increasing internet penetration across regions
- 3.2.1.4 Growing smart home integration trends
- 3.2.2 Industry pitfalls & challenges
- 3.2.2.1 Content fragmentation
- 3.2.2.2 Internet dependency
- 3.2.1 Growth drivers
- 3.3 Consumer buying behavior analysis
- 3.3.1 Demographic trends
- 3.3.2 Factors affecting buying decision
- 3.3.3 Consumer product adoption
- 3.3.4 Preferred distribution channel
- 3.3.5 Preferred price range
- 3.4 Growth potential analysis
- 3.5 Regulatory landscape
- 3.6 Pricing analysis
- 3.7 Porter's analysis
- 3.8 PESTEL analysis
Chapter 4 Competitive Landscape, 2024
- 4.1 Introduction
- 4.2 Company market share analysis
- 4.3 Competitive positioning matrix
- 4.4 Strategic outlook matrix
Chapter 5 Market Estimates and Forecast, By Screen Size, 2021 – 2034 (USD Billion) (Thousand Units)
- 5.1 Key trends
- 5.2 Less than 30 inches
- 5.3 30 inches to 50 inches
- 5.4 50 inches to 70 inches
- 5.5 Above 70 inches
Chapter 6 Market Estimates & Forecast, By Technology, 2021-2034 (USD Billion) (Thousand Units)
- 6.1 Key trends
- 6.2 LED
- 6.3 OLED
- 6.4 Others
Chapter 7 Market Estimates & Forecast, By Screen Type, 2021-2034 (USD Billion) (Thousand Units)
- 7.1 Key trends
- 7.2 Curved
- 7.3 Flat
Chapter 8 Market Estimates & Forecast, By Resolution, 2021-2034 (USD Billion) (Thousand Units)
- 8.1 Key trends
- 8.2 8K
- 8.3 4K
- 8.4 1080p
- 8.5 Others
Chapter 9 Market Estimates & Forecast, By End Use, 2021-2034 (USD Billion) (Thousand Units)
- 9.1 Key trends
- 9.2 Residential
- 9.3 Commercial
Chapter 10 Market Estimates & Forecast, By Distribution Channel, 2021-2034 (USD Billion) (Thousand Units)
- 10.1 Key trends
- 10.2 Online
- 10.3 Offline
Chapter 11 Market Estimates & Forecast, By Region, 2021 – 2034, (USD Billion) (Thousand Units)
- 11.1 Key trends
- 11.2 North America
- 11.2.1 U.S.
- 11.2.2 Canada
- 11.3 Europe
- 11.3.1 UK
- 11.3.2 Germany
- 11.3.3 France
- 11.3.4 Italy
- 11.3.5 Spain
- 11.4 Asia Pacific
- 11.4.1 China
- 11.4.2 Japan
- 11.4.3 India
- 11.4.4 South Korea
- 11.4.5 Australia
- 11.5 Latin America
- 11.5.1 Brazil
- 11.5.2 Mexico
- 11.6 MEA
- 11.6.1 South Africa
- 11.6.2 Saudi Arabia
- 11.6.3 UAE
Chapter 12 Company Profiles (Business Overview, Financial Data, Product Landscape, Strategic Outlook, SWOT Analysis)
- 12.1 Amazon
- 12.2 Apple
- 12.3 Google
- 12.4 Hisense Group
- 12.5 LG Electronics
- 12.6 Panasonic Corporation
- 12.7 Philips
- 12.8 Roku, Inc.
- 12.9 Samsung Electronics
- 12.10 Sharp Corporation
- 12.11 Skyworth Group
- 12.12 Sony Corporation
- 12.13 TCL Technology
- 12.14 Vizio Inc.
- 12.15 Xiaomi Corporation
- 発行日
- 発行
- Global Market Insights Inc.
- ページ情報
- 英文 487 Pages
- 納期
- 2~3営業日


