デフォルト表紙
市場調査レポート
商品コード
1532655

VaaS(Vehicle as a Service)の市場規模:エンジン別、サービスプロバイダー別、エンドユーザー別、車両別、予測、2024年~2032年

Vehicle as a Service Market Size - By Engine (Electric, IC Engine), Service Provider (Automotive OEM, Auto Dealerships, Auto Tech Startups, Car Subscription Software Providers), End User (Enterprise Users, Private Users), Vehicle & Forecast, 2024 - 2032

出版日: | 発行: Global Market Insights Inc. | ページ情報: 英文 250 Pages | 納期: 2~3営業日

● お客様のご希望に応じて、既存データの加工や未掲載情報(例:国別セグメント)の追加などの対応が可能です。  詳細はお問い合わせください。

価格
価格表記: USDを日本円(税抜)に換算
本日の銀行送金レート: 1USD=152.54円
VaaS(Vehicle as a Service)の市場規模:エンジン別、サービスプロバイダー別、エンドユーザー別、車両別、予測、2024年~2032年
出版日: 2024年05月21日
発行: Global Market Insights Inc.
ページ情報: 英文 250 Pages
納期: 2~3営業日
  • 全表示
  • 概要
  • 目次
概要

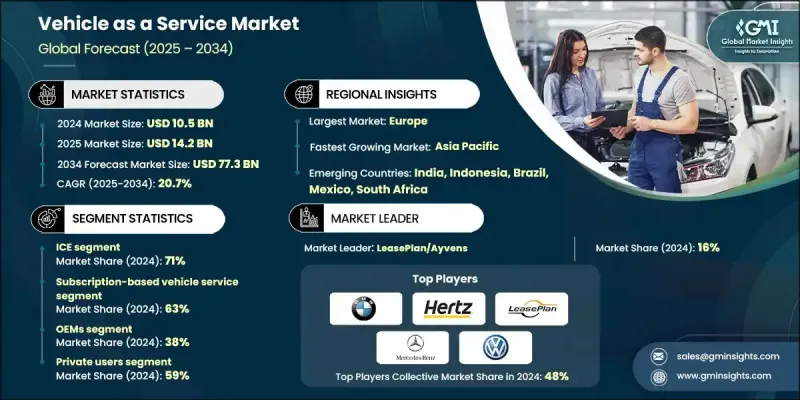
VaaS(Vehicle as a Service)市場規模は、共有モビリティ・ソリューションへのシフトの高まりと、柔軟な交通手段に対する消費者の嗜好の高まりに牽引され、2024~2032年にCAGR20.5%超を記録すると見られています。

都市化の進展と都市の混雑が、カーシェアリング、ライドヘイリング、サブスクリプション・ベースの車両サービスなどの需要急増につながっています。World bank.orgによると、現在、人口の56%が都市部に住んでいます。VaaS(Vehicle as a Service)は、所有の負担なしに自動車を利用できる利便性を消費者に提供するもので、特に若い都市人口に魅力的です。

自動車メーカー、テクノロジー企業、サービス・プロバイダー間の投資や戦略的提携の増加も、市場成長に有利に働くと思われます。大手自動車会社は、ユーザー・エクスペリエンスと業務効率を高めるために、自律走行やAIのような先進技術を統合してVaaSサービスを開発・拡大するために、ハイテク企業とも協力しています。

VaaS(Vehicle as a Service)産業は、エンジン、サービスプロバイダー、車両、エンドユーザー、地域に区分されます。

エンジンに基づくと、電気エンジン・セグメントの市場規模は、環境持続可能性目標との整合性とコスト効率により、2024年から2032年の間にかなりの収益を生み出す見通しです。電気自動車(EV)は排出ガスがゼロであるため、都市公害を削減し、厳しい規制基準を満たすことを目的とした共有モビリティ・サービスにとって魅力的な選択肢となります。

車両に関しては、トラック・セグメントのVaaS産業は、柔軟で費用対効果の高い物流・貨物ソリューションに対する需要の増加により、2024年から2032年にかけて成長するとみられています。企業は、自社車両の購入と維持に伴う高額な資本支出を避けるため、トラック・アズ・ア・サービス・モデルを選択するようになってきています。これにより、企業は大きな財務的負担を負うことなく、需要に応じて業務を拡大することができます。

アジア太平洋のVaaS(Vehicle as a Service)市場は、2032年まで大幅に拡大すると思われます。中国、インド、日本のような国々の政府は、ライドシェアやカーシェアプラットフォームを含む共有モビリティサービスをサポートするインフラに多額の投資を行っています。中産階級の人口増加も、より柔軟で費用対効果の高い交通手段を求めており、この地域の市場成長をさらに促進しています。

目次

第1章 調査手法と調査範囲

第2章 エグゼクティブサマリー

第3章 業界洞察

  • エコシステム分析
  • サプライヤーの状況
    • 自動車メーカー(OEM)
    • 技術プロバイダー
    • 金融機関
    • メンテナンス&修理プロバイダー
    • 保険会社
  • 利益率分析
  • テクノロジー&イノベーション・情勢
  • 特許分析
  • 主要ニュースと取り組み
  • 規制状況
  • 影響要因
    • 促進要因
      • 短期間の車両サブスクリプション・サービスに対する需要の高まり
      • VaaS(Vehicle as a Service)に伴う費用対効果
      • サードパーティのVaaSプロバイダーの普及拡大
      • 排ガス規制に関する政府の厳しい規制により、車両所有率が低下
      • 発展途上国における適切な公共交通インフラの不足
    • 業界の潜在的リスク&課題
      • VaaS(Vehicle as a Service)の所有コストが高い
      • EV用充電インフラの不足
  • 成長可能性分析
  • ポーター分析
  • PESTEL分析

第4章 競合情勢

  • イントロダクション
  • 企業シェア分析
  • 競合のポジショニング・マトリックス
  • 戦略展望マトリックス

第5章 市場推計・予測:エンジン別、2021年~2032年

  • 主要動向
  • 電動エンジン
  • ICエンジン

第6章 市場推計・予測:サービスプロバイダー別、2021年~2032年

  • 主要動向
  • 自動車OEM
  • 自動車ディーラー
  • 自動車技術系新興企業
  • 自動車サブスクリプション・ソフトウェア・プロバイダー

第7章 市場推計・予測:車両別、2021年~2032年

  • 主要動向
  • 乗用車
  • トラック
  • ユーティリティ・トレーラー
  • 二輪車

第8章 市場推計・予測:エンドユーザー別、2021年~2032年

  • 主要動向
  • 企業ユーザー
  • 個人ユーザー

第9章 市場推計・予測:地域別、2021年~2032年

  • 主要動向
  • 北米
    • 米国
    • カナダ
  • 欧州
    • 英国
    • ドイツ
    • フランス
    • スペイン
    • イタリア
    • ロシア
    • 北欧
    • その他欧州
  • アジア太平洋
    • 中国
    • インド
    • 日本
    • 韓国
    • ニュージーランド
    • 東南アジア
    • その他アジア太平洋地域
  • ラテンアメリカ
    • ブラジル
    • メキシコ
    • アルゼンチン
    • その他ラテンアメリカ
  • 中東・アフリカ
    • UAE
    • 南アフリカ
    • サウジアラビア
    • その他の中東・アフリカ

第10章 企業プロファイル

  • Bavarian Motor Work AG(BMW Group)
  • Borrow(Prazo, Inc.)
  • CarNext B.V.
  • Cluno GmbH
  • Daimler AG(Mercedes-Benz Group)
  • Porsche AG
  • Drover Ltd.(Cazoo)
  • Flexdrive(Lyft)
  • General Motors Company
  • Hertz Corporation
  • Hyundai Motor Company
  • OpenRoad(Portfolio)
  • Sixt SE
  • TATA Motors Limited
  • Toyota Motor Corporation
  • Volkswagen AG
  • Volvo AB
  • Zoomcar India Private Ltd.
目次
Product Code: 5365

Vehicle as a Service Market size is set to register over 20.5% CAGR during 2024-2032 driven by the increasing shift towards shared mobility solutions and the rising consumer preference for flexible transportation options. Rising urbanization and the congestion in cities have led to the surge in demand for services like car-sharing, ride-hailing, and subscription-based vehicle services. As per World bank.org, currently 56% of the population lives in urban areas. Vehicle as a service (VaaS) offers consumers the convenience of accessing vehicles without the burden of ownership, which is particularly appealing to the younger, urban population.

The increasing investments and strategic partnerships among automotive manufacturers, technology companies, and service providers will also favor the market growth. Major automotive companies are also collaborating with tech firms to develop and expand their VaaS offerings by integrating advanced technologies like autonomous driving and AI to enhance user experience and operational efficiency.

The vehicle as a service industry is segmented into engine, service provider, vehicle, end-user, and region.

Based on engine, the market size from electric engine segment is poised to generate substantial revenue between 2024 and 2032 due to the alignment with environmental sustainability goals and cost efficiency. Electric vehicles (EVs) produce zero emissions, making them an attractive option for shared mobility services aimed at reducing urban pollution and meeting the stringent regulatory standards.

In terms of vehicle, the VaaS industry from the truck segment is set to grow during 2024-2032 owing to the increasing demand for flexible, cost-effective logistics and freight solutions. Businesses are increasingly opting for truck-as-a-service models to avoid the high capital expenditure associated with purchasing and maintaining their own fleet. This allows companies to scale their operations as per the demands without significant financial strain.

Asia Pacific vehicle as a service market will expand significantly through 2032. Governments in countries like China, India, and Japan are heavily investing in infrastructure to support shared mobility services, including ridesharing and car-sharing platforms. The growing middle-class population is also seeking more flexible and cost-effective transportation options, further driving the regional market growth.

Table of Contents

Chapter 1 Methodology & Scope

  • 1.1 Research design
    • 1.1.1 Research approach
    • 1.1.2 Data collection methods
  • 1.2 Base estimates and calculations
    • 1.2.1 Base year calculation
    • 1.2.2 Key trends for market estimates
  • 1.3 Forecast model
  • 1.4 Primary research & validation
    • 1.4.1 Primary sources
    • 1.4.2 Data mining sources
  • 1.5 Market definitions

Chapter 2 Executive Summary

  • 2.1 Industry 360° synopsis, 2021 - 2032

Chapter 3 Industry Insights

  • 3.1 Industry ecosystem analysis
  • 3.2 Supplier landscape
    • 3.2.1 Vehicle manufacturers (OEMs)
    • 3.2.2 Technology providers
    • 3.2.3 Financial institutions
    • 3.2.4 Maintenance & repair providers
    • 3.2.5 Insurance companies
  • 3.3 Profit margin analysis
  • 3.4 Technology & innovation landscape
  • 3.5 Patent analysis
  • 3.6 Key news & initiatives
  • 3.7 Regulatory landscape
  • 3.8 Impact forces
    • 3.8.1 Growth drivers
      • 3.8.1.1 Growing demand for short-term vehicle subscription services
      • 3.8.1.2 Cost-effectiveness associated with vehicle-as-a-service
      • 3.8.1.3 Rising penetration of third-party vehicle-as-a-service provider
      • 3.8.1.4 Stringent government regulations regarding emission control reducing vehicle ownership
      • 3.8.1.5 Lack of proper public transportation infrastructure in developing countries
    • 3.8.2 Industry pitfalls & challenges
      • 3.8.2.1 High ownership cost of vehicle as a service
      • 3.8.2.2 Inadequate charging infrastructure for EVs
  • 3.9 Growth potential analysis
  • 3.10 Porter's analysis
  • 3.11 PESTEL analysis

Chapter 4 Competitive Landscape, 2023

  • 4.1 Introduction
  • 4.2 Company market share analysis
  • 4.3 Competitive positioning matrix
  • 4.4 Strategic outlook matrix

Chapter 5 Market Estimates & Forecast, By Engine, 2021 - 2032 ($Bn)

  • 5.1 Key trends
  • 5.2 Electric
  • 5.3 IC engine

Chapter 6 Market Estimates & Forecast, By Service Provider, 2021 - 2032 ($Bn)

  • 6.1 Key trends
  • 6.2 Automotive OEM
  • 6.3 Auto dealerships
  • 6.4 Auto tech startups
  • 6.5 Car subscription software providers

Chapter 7 Market Estimates & Forecast, By Vehicle, 2021 - 2032 ($Bn)

  • 7.1 Key trends
  • 7.2 Passenger cars
  • 7.3 Trucks
  • 7.4 Utility trailers
  • 7.5 Motorcycles

Chapter 8 Market Estimates & Forecast, By End-user, 2021 - 2032 ($Bn)

  • 8.1 Key trends
  • 8.2 Enterprise users
  • 8.3 Private users

Chapter 9 Market Estimates & Forecast, By Region, 2021 - 2032 ($Bn)

  • 9.1 Key trends
  • 9.2 North America
    • 9.2.1 U.S.
    • 9.2.2 Canada
  • 9.3 Europe
    • 9.3.1 UK
    • 9.3.2 Germany
    • 9.3.3 France
    • 9.3.4 Spain
    • 9.3.5 Italy
    • 9.3.6 Russia
    • 9.3.7 Nordics
    • 9.3.8 Rest of Europe
  • 9.4 Asia Pacific
    • 9.4.1 China
    • 9.4.2 India
    • 9.4.3 Japan
    • 9.4.4 South Korea
    • 9.4.5 ANZ
    • 9.4.6 Southeast Asia
    • 9.4.7 Rest of Asia Pacific
  • 9.5 Latin America
    • 9.5.1 Brazil
    • 9.5.2 Mexico
    • 9.5.3 Argentina
    • 9.5.4 Rest of Latin America
  • 9.6 MEA
    • 9.6.1 UAE
    • 9.6.2 South Africa
    • 9.6.3 Saudi Arabia
    • 9.6.4 Rest of MEA

Chapter 10 Company Profiles

  • 10.1 Bavarian Motor Work AG (BMW Group)
  • 10.2 Borrow (Prazo, Inc.)
  • 10.3 CarNext B.V.
  • 10.4 Cluno GmbH
  • 10.5 Daimler AG (Mercedes-Benz Group)
  • 10.6 Porsche AG
  • 10.7 Drover Ltd. (Cazoo)
  • 10.8 Flexdrive (Lyft)
  • 10.9 General Motors Company
  • 10.10 Hertz Corporation
  • 10.11 Hyundai Motor Company
  • 10.12 OpenRoad (Portfolio)
  • 10.13 Sixt SE
  • 10.14 TATA Motors Limited
  • 10.15 Toyota Motor Corporation
  • 10.16 Volkswagen AG
  • 10.17 Volvo AB
  • 10.18 Zoomcar India Private Ltd.