
|
市場調査レポート
商品コード
1666568
セラミック基板市場の市場機会、成長促進要因、産業動向分析、2025~2034年予測Ceramic Substrates Market Opportunity, Growth Drivers, Industry Trend Analysis, and Forecast 2025 - 2034 |
||||||
カスタマイズ可能
|
|||||||
| セラミック基板市場の市場機会、成長促進要因、産業動向分析、2025~2034年予測 |
|
出版日: 2024年12月19日
発行: Global Market Insights Inc.
ページ情報: 英文 200 Pages
納期: 2~3営業日
|

全表示
- 概要
- 目次
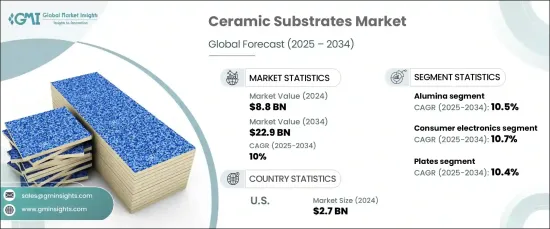
セラミック基板の世界市場は、2024年に88億米ドルに達し、2025年から2034年まで10%の堅調なCAGRで推移すると予想されています。
セラミック基板は、エレクトロニクス、自動車、航空宇宙、通信などの主要産業で広く採用されるようになっています。優れた熱伝導性、電気絶縁性、機械的強度を実現できる高性能材料への需要の高まりが、この成長を後押ししています。そのユニークな特性は、特に産業界が技術の限界を押し広げる中で、耐久性と効率の両方を必要とする用途に理想的なソリューションとなっています。
需要が高まるにつれ、メーカーは革新的な素材、最先端の製造プロセス、持続可能な生産技術の開発を優先し、進化する業界のニーズに応えています。実際、市場の拡大は、技術の進歩だけでなく、環境フットプリントの削減と製品性能の向上が重視されるようになったことも背景にあります。
| 市場範囲 | |
|---|---|
| 開始年 | 2024 |
| 予測年 | 2025-2034 |
| 開始金額 | 88億米ドル |
| 予測金額 | 229億米ドル |
| CAGR | 10% |
ハイテクエレクトロニクス、半導体アプリケーション、自動車技術の急増により、セラミック基板市場は継続的かつ持続的な成長が見込まれています。セラミック基板は、熱管理、機械的堅牢性、スペース最適化のためのソリューションを提供するため、モバイル機器やウェアラブルを含む最新のエレクトロニクスにおける用途が、この動向の主要な推進力となっています。セラミック基板は、熱管理、機械的堅牢性、スペースの最適化などのソリューションを提供するため、小型化と高いエネルギー効率を必要とする機器に不可欠なものとなりつつあり、家電メーカーの強い需要につながっています。同様に自動車分野では、精密な温度調節と耐久性が求められるセンサーなどの部品に広く使われています。
市場は、アルミナ、窒化アルミニウム、窒化ケイ素、酸化ベリリウムなど、さまざまなタイプに区分されます。例えばアルミナ基板は最大の市場シェアを占め、2023年の市場規模は49億米ドルです。予想CAGRは10.5%で、アルミナはその優れた電気絶縁特性、高い機械的強度、耐腐食性により、依然として好まれている材料です。これらの特性により、電子機器、自動車、医療機器などの分野で理想的な選択肢となり、安定した需要を確保しています。
最終用途別では、2024年に31億米ドルを記録した民生用電子機器が市場を牽引し、2034年までのCAGRは10.7%で成長するとみられています。スマートフォン、ウェアラブル端末、ポータブルガジェットなど、小型で高性能なデバイスに対する需要の高まりが、この分野の拡大を後押しする主な要因の1つとなっています。セラミック基板は、熱的・機械的性能を発揮しながらデバイスの小型化をサポートする能力を備えており、現代の電子機器製造において不可欠な役割を担っています。
北米では、セラミック基板市場の2024年の市場規模は27億米ドルで、2034年までのCAGRは11%と堅調な成長が見込まれています。この地域では、技術革新、産業オートメーション、エネルギー効率の高いシステムが重視されており、電子機器、通信、自動車分野でのセラミック部品の需要を押し上げています。さらに、研究開発への継続的な投資と製造能力の進歩が、この地域の市場拡大を強化すると予想されます。
目次
第1章 調査手法と調査範囲
- 市場範囲と定義
- 基本推定と計算
- 予測計算
- データソース
- 1次データ
- 二次資料
- 有料情報源
- 公的情報源
第2章 エグゼクティブサマリー
第3章 業界洞察
- エコシステム分析
- バリューチェーンに影響を与える要因
- 利益率分析
- 破壊
- 将来の展望
- メーカー
- 流通業者
- サプライヤーの状況
- 利益率分析
- 主要ニュース
- 規制状況
- 影響要因
- 促進要因
- エレクトロニクス産業における需要の高まり
- 医療機器の採用増加
- 5G技術の進歩
- 業界の潜在的リスク&課題
- 高い製造コスト
- 代替材料の競合
- 促進要因
- 成長可能性分析
- ポーター分析
- PESTEL分析
第4章 競合情勢
- イントロダクション
- 企業シェア分析
- 競合のポジショニング・マトリックス
- 戦略展望マトリックス
第5章 市場推計・予測:製品タイプ別、2021年~2034年
- 主要動向
- アルミナ
- 窒化アルミニウム
- 窒化ケイ素
- 酸化ベリリウム
- その他
第6章 市場推計・予測:最終用途別、2021年~2034年
- 主要動向
- 家電
- 航空宇宙・防衛
- 自動車
- 半導体
- 通信
- その他
第7章 市場推計・予測:形態別、2021年~2034年
- 主要動向
- 板
- シート
- フィルム
- その他
第8章 市場推計・予測:地域別、2021-2034年
- 主要動向
- 北米
- 米国
- カナダ
- 欧州
- 英国
- ドイツ
- フランス
- イタリア
- スペイン
- ロシア
- アジア太平洋
- 中国
- インド
- 日本
- 韓国
- オーストラリア
- ラテンアメリカ
- ブラジル
- メキシコ
- 中東・アフリカ
- 南アフリカ
- サウジアラビア
- アラブ首長国連邦
第9章 企業プロファイル
- Adamant Namiki Precision Jewel
- CeramTec
- Chaozhou Three-Circle(Group)
- CoorsTek
- ENrG
- KOA Corporation
- Kyocera Corporation
- Leatec Fine Ceramics
- Maruwa
- Murata Manufacturin
- NGK Insulators
- NTK Technologies
- Rogers Corporation
- Tong Hsing Electronic Industries
- Yokowo
The Global Ceramic Substrates Market reached USD 8.8 billion in 2024 and is expected to continue with a robust CAGR of 10% from 2025 to 2034. Ceramic substrates are gaining widespread adoption across key industries such as electronics, automotive, aerospace, and telecommunications. The increasing demand for high-performance materials capable of delivering superior thermal conductivity, electrical insulation, and mechanical strength has driven this growth. Their unique properties make them an ideal solution for applications requiring both durability and efficiency, particularly as industries push the boundaries of technology.
As demand rises, manufacturers are prioritizing the development of innovative materials, cutting-edge manufacturing processes, and sustainable production techniques to meet evolving industry needs. In fact, the market's expansion is driven not only by technological advancements but also by the growing emphasis on reducing environmental footprints and improving product performance.
| Market Scope | |
|---|---|
| Start Year | 2024 |
| Forecast Year | 2025-2034 |
| Start Value | $8.8 Billion |
| Forecast Value | $22.9 Billion |
| CAGR | 10% |
With a surge in high-tech electronics, semiconductor applications, and automotive technologies, the ceramic substrates market is expected to see continued and sustained growth. Applications in modern electronics, including mobile devices and wearables, are key drivers behind this trend, as ceramic substrates offer solutions for thermal management, mechanical robustness, and space optimization. They are becoming indispensable in devices that require miniaturization and higher energy efficiency, leading to a strong demand from consumer electronics manufacturers. Similarly, in the automotive sector, they are widely used for components like sensors, which require precise temperature regulation and durability.
The market is segmented into various types, including alumina, aluminum nitride, silicon nitride, beryllium oxide, and others. Alumina substrates, for instance, held the largest market share, with a value of USD 4.9 billion in 2023. With an expected CAGR of 10.5%, alumina remains the preferred material due to its exceptional electrical insulating properties, high mechanical strength, and resistance to corrosion. These attributes make it an ideal choice in sectors like electronics, automotive, and medical devices, ensuring consistent demand.
In terms of end-use applications, consumer electronics led the market with a value of USD 3.1 billion in 2024, set to grow at a CAGR of 10.7% through 2034. The growing demand for compact, high-performance devices in smartphones, wearables, and portable gadgets is one of the key factors fueling this segment's expansion. Ceramic substrates' ability to support the miniaturization of devices while providing thermal and mechanical performance ensures their integral role in modern electronics manufacturing.
In North America, the ceramic substrates market was valued at USD 2.7 billion in 2024, with expectations to grow at a solid 11% CAGR through 2034. The region's emphasis on technological innovation, industrial automation, and energy-efficient systems is pushing the demand for ceramic components in electronics, telecommunications, and the automotive sector. Furthermore, ongoing investments in research and development and advancements in manufacturing capabilities are expected to strengthen market expansion in the region.
Table of Contents
Chapter 1 Methodology & Scope
- 1.1 Market scope & definitions
- 1.2 Base estimates & calculations
- 1.3 Forecast calculations
- 1.4 Data sources
- 1.4.1 Primary
- 1.4.2 Secondary
- 1.4.2.1 Paid sources
- 1.4.2.2 Public sources
Chapter 2 Executive Summary
- 2.1 Industry synopsis, 2021-2034
Chapter 3 Industry Insights
- 3.1 Industry ecosystem analysis
- 3.1.1 Factor affecting the value chain
- 3.1.2 Profit margin analysis
- 3.1.3 Disruptions
- 3.1.4 Future outlook
- 3.1.5 Manufacturers
- 3.1.6 Distributors
- 3.2 Supplier landscape
- 3.3 Profit margin analysis
- 3.4 Key news & initiatives
- 3.5 Regulatory landscape
- 3.6 Impact forces
- 3.6.1 Growth drivers
- 3.6.1.1 Rising demand in electronics industry
- 3.6.1.2 Increasing adoption of medical devices
- 3.6.1.3 Advancements in 5G technology
- 3.6.2 Industry pitfalls & challenges
- 3.6.2.1 High production costs
- 3.6.2.2 Competition of alternative materials
- 3.6.1 Growth drivers
- 3.7 Growth potential analysis
- 3.8 Porter’s analysis
- 3.9 PESTEL analysis
Chapter 4 Competitive Landscape, 2024
- 4.1 Introduction
- 4.2 Company market share analysis
- 4.3 Competitive positioning matrix
- 4.4 Strategic outlook matrix
Chapter 5 Market Estimates & Forecast, By Product Type, 2021-2034 (USD Million) (Tons)
- 5.1 Key trends
- 5.2 Alumina
- 5.3 Aluminum nitride
- 5.4 Silicon nitride
- 5.5 Beryllium oxide
- 5.6 Others
Chapter 6 Market Estimates & Forecast, By End Use, 2021-2034 (USD Million) (Tons)
- 6.1 Key trends
- 6.2 Consumer electronics
- 6.3 Aerospace and defense
- 6.4 Automotive
- 6.5 Semiconductor
- 6.6 Telecommunication
- 6.7 Others
Chapter 7 Market Estimates & Forecast, By Form, 2021-2034 (USD Million) (Tons)
- 7.1 Key trends
- 7.2 Plates
- 7.3 Sheets
- 7.4 Films
- 7.5 Others
Chapter 8 Market Estimates & Forecast, By Region, 2021-2034 (USD Million) (Tons)
- 8.1 Key trends
- 8.2 North America
- 8.2.1 U.S.
- 8.2.2 Canada
- 8.3 Europe
- 8.3.1 UK
- 8.3.2 Germany
- 8.3.3 France
- 8.3.4 Italy
- 8.3.5 Spain
- 8.3.6 Russia
- 8.4 Asia Pacific
- 8.4.1 China
- 8.4.2 India
- 8.4.3 Japan
- 8.4.4 South Korea
- 8.4.5 Australia
- 8.5 Latin America
- 8.5.1 Brazil
- 8.5.2 Mexico
- 8.6 MEA
- 8.6.1 South Africa
- 8.6.2 Saudi Arabia
- 8.6.3 UAE
Chapter 9 Company Profiles
- 9.1 Adamant Namiki Precision Jewel
- 9.2 CeramTec
- 9.3 Chaozhou Three-Circle (Group)
- 9.4 CoorsTek
- 9.5 ENrG
- 9.6 KOA Corporation
- 9.7 Kyocera Corporation
- 9.8 Leatec Fine Ceramics
- 9.9 Maruwa
- 9.10 Murata Manufacturin
- 9.11 NGK Insulators
- 9.12 NTK Technologies
- 9.13 Rogers Corporation
- 9.14 Tong Hsing Electronic Industries
- 9.15 Yokowo

