
|
市場調査レポート
商品コード
1685118
海洋由来タンパク質市場の機会、成長促進要因、産業動向分析、2025年~2034年の予測Marine Derived Proteins Market Opportunity, Growth Drivers, Industry Trend Analysis, and Forecast 2025 - 2034 |
||||||
カスタマイズ可能
|
|||||||
| 海洋由来タンパク質市場の機会、成長促進要因、産業動向分析、2025年~2034年の予測 |
|
出版日: 2025年01月02日
発行: Global Market Insights Inc.
ページ情報: 英文 180 Pages
納期: 2~3営業日
|

全表示
- 概要
- 目次
世界の海洋由来タンパク質市場は、2024年に82億米ドルと評価され、高品質で持続可能なタンパク質源に対する消費者需要の増加に牽引され、2025年から2034年にかけてCAGR 8.5%で拡大すると予測されています。
この上昇動向は、必須アミノ酸、オメガ3脂肪酸、生物活性化合物を豊富に含む海洋タンパク質の人気上昇に後押しされています。健康志向の消費者が栄養密度の高い食品を求める中、海洋タンパク質は様々な食事や機能性用途で好まれる選択肢として浮上しています。
環境の持続可能性や倫理的な食品調達に対する懸念の高まりも消費者の嗜好を変化させており、海洋由来タンパク質の採用率の上昇につながっています。これらのタンパク質は、従来の動物性タンパク質に代わる持続可能な選択肢を提供し、特に藻類由来の選択肢は、植物性で環境に配慮した食生活の動きに合致しています。さらに、食品加工技術の進歩により、海洋タンパク質の生物学的利用能と機能的特典が強化され、栄養補助食品、スポーツ栄養、医薬品用途での利用がより魅力的になっています。
| 市場範囲 | |
|---|---|
| 開始年 | 2024 |
| 予測年 | 2025-2034 |
| 開始金額 | 82億米ドル |
| 予測金額 | 188億米ドル |
| CAGR | 8.5% |
海洋由来タンパク質市場は、原料別に、貝類ベース、魚類ベース、藻類ベース、その他に分類されます。魚由来のタンパク質が市場を独占し、2024年には55億米ドルを生み出し、2034年には126億米ドルに達すると予測されています。その卓越した栄養プロファイルと食品、医薬品、化粧品にわたる多目的な用途が、市場成長の主要な促進要因となっています。貝類ベースのタンパク質は、その高い生物学的利用能と栄養補助食品、ペット栄養、機能性食品への広範な応用により、急速に支持を集めています。藻類ベースのタンパク質は、持続可能で植物に優しい代替品として需要が加速度的に増加しており、環境に配慮したタンパク質源を求める消費者にアピールしています。環境への影響を最小限に抑えながら高タンパク質を供給できることから、同市場では強力な競争相手となっています。
形態別では、市場は濃縮物、加水分解物、分離物に分けられます。濃縮物セグメントは、その手頃な価格、製造の容易さ、バランスの取れた栄養特性により、2024年には45%の圧倒的シェアを占めています。濃縮物は単離物や加水分解物に比べ、タンパク質の大部分を保持したまま最小限の処理で済むため、機能性食品、飲食品、飼料に最適です。様々な産業で広く採用されていることは、その費用対効果と進化する消費者ニーズを満たす能力を裏付けています。
米国の海洋由来タンパク質市場の2024年の市場規模は18億米ドルで、健康・ウェルネス製品への関心の高まりによって力強い成長が見込まれています。消費者は、オメガ3脂肪酸や必須栄養素を豊富に含む高品質のタンパク質源を優先しています。
や必須栄養素が豊富な高品質のタンパク質源を優先する傾向にあり、海洋由来の栄養補助食品や機能性食品の需要急増に寄与しています。アスリートやフィットネス愛好家がクリーンで生物学的利用能の高いタンパク源を求める中、スポーツ栄養分野の拡大がこの上昇基調をさらに後押ししています。さらに、持続可能性への懸念が購買決定に影響を及ぼしており、メーカー各社は環境意識の高い消費者の嗜好に沿った、環境に優しい海洋性タンパク質ソリューションの開発を促しています。
市場が進化を続ける中、海洋タンパク質の抽出、加工、応用における技術革新が成長を加速させると予想されます。消費者が栄養価が高く持続可能な食品を選択するようになるにつれ、海洋由来タンパク質は世界のタンパク質業界において重要な位置を占めるようになり、栄養補助食品および機能性栄養食品業界の未来を形作ることになると思われます。
目次
第1章 調査手法と調査範囲
- 市場範囲と定義
- 基本推定と計算
- 予測計算
- データソース
第2章 エグゼクティブサマリー
第3章 業界洞察
- エコシステム分析
- バリューチェーンに影響を与える要因
- 利益率分析
- ディスラプション
- 将来の展望
- メーカー
- 流通業者
- サプライヤーの状況
- 利益率分析
- 主要ニュース
- 規制状況
- 影響要因
- 促進要因
- 必須栄養素が豊富
- 運動能力の向上
- 認知機能の向上
- 業界の潜在的リスク&課題
- 汚染と汚染物質
- 促進要因
- 成長可能性分析
- ポーター分析
- PESTEL分析
第4章 競合情勢
- イントロダクション
- 企業シェア分析
- 競合のポジショニング・マトリックス
- 戦略展望マトリックス
第5章 市場規模・予測:原料別、2021年~2034年
- 主要動向
- 魚ベース
- 貝類ベース
- 藻類ベース
- その他
第6章 市場規模・予測:形態別、2021年~2034年
- 主要動向
- 濃縮物
- 加水分解物
- 分離物
第7章 市場規模・予測:流通チャネル別、2021年~2034年
- 主要動向
- 直販
- 流通業者
- 小売
第8章 市場規模・予測:地域別、2021年~2034年
- 主要動向
- 北米
- 米国
- カナダ
- 欧州
- 英国
- ドイツ
- フランス
- イタリア
- スペイン
- ロシア
- アジア太平洋
- 中国
- インド
- 日本
- 韓国
- オーストラリア
- ラテンアメリカ
- ブラジル
- メキシコ
- 中東・アフリカ
- 南アフリカ
- サウジアラビア
- アラブ首長国連邦
第9章 企業プロファイル
- Aker BioMarine
- Aquaculture Protein
- Biomega Group
- Cargill
- Cellulac
- Corbion
- DSM
- Epax
- FMC Corporation
- Kerry Group
- Lonza
- Neptune Wellness Solutions
- Nippon Suisan Kaisha
- Royal Greenland
- SkyBiometry
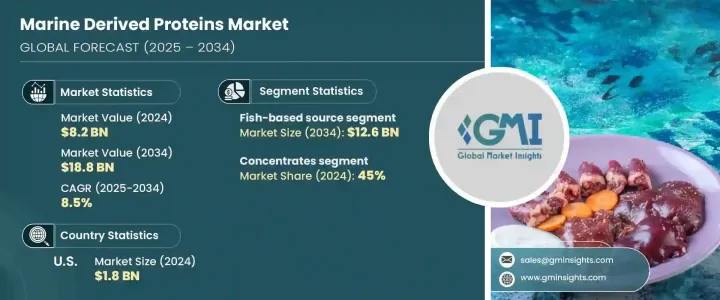
The Global Marine Derived Proteins Market, valued at USD 8.2 billion in 2024, is projected to expand at a CAGR of 8.5% between 2025 and 2034, driven by increasing consumer demand for high-quality, sustainable protein sources. This upward trend is fueled by the rising popularity of marine proteins, which are rich in essential amino acids, omega-3 fatty acids, and bioactive compounds. As health-conscious consumers seek nutrient-dense food options, marine proteins are emerging as a preferred choice across various dietary and functional applications.
Growing concerns over environmental sustainability and ethical food sourcing are also reshaping consumer preferences, leading to higher adoption of marine-derived proteins. These proteins provide a sustainable alternative to traditional animal-based proteins, particularly algae-based options, which align with plant-based and eco-conscious dietary movements. Additionally, advancements in food processing technologies are enhancing the bioavailability and functional benefits of marine proteins, making them more appealing for use in nutraceuticals, sports nutrition, and pharmaceutical applications.
| Market Scope | |
|---|---|
| Start Year | 2024 |
| Forecast Year | 2025-2034 |
| Start Value | $8.2 Billion |
| Forecast Value | $18.8 Billion |
| CAGR | 8.5% |
By source, the marine-derived proteins market is categorized into shellfish-based, fish-based, algae-based, and others. Fish-based proteins dominated the market, generating USD 5.5 billion in 2024 and projected to reach USD 12.6 billion by 2034. Their exceptional nutritional profile and versatile applications across food, pharmaceuticals, and cosmetics make them a key driver of market growth. Shellfish-based proteins are rapidly gaining traction due to their high bioavailability and widespread application in dietary supplements, pet nutrition, and functional foods. Algae-based proteins are witnessing an accelerated rise in demand as sustainable, plant-friendly alternatives, appealing to consumers looking for environmentally responsible protein sources. Their ability to deliver high protein content with minimal ecological impact makes them a strong competitor in the market.
In terms of form, the market is divided into concentrates, hydrolysates, and isolates. The concentrates segment held a dominant 45% share in 2024, driven by its affordability, ease of production, and balanced nutritional properties. Compared to isolates and hydrolysates, concentrates undergo minimal processing while retaining a significant portion of protein, making them an ideal choice for functional foods, beverages, and animal feed. Their widespread adoption across various industries underscores their cost-effectiveness and ability to meet evolving consumer needs.
The U.S. marine-derived proteins market was valued at USD 1.8 billion in 2024, with strong growth prospects driven by increasing interest in health and wellness products. Consumers are prioritizing high-quality protein sources rich in omega-3 fatty acids
and essential nutrients, contributing to surging demand for marine-based dietary supplements and functional foods. The expanding sports nutrition sector further supports this upward trajectory, as athletes and fitness enthusiasts seek clean, bioavailable protein sources. Additionally, sustainability concerns are influencing purchasing decisions, prompting manufacturers to develop eco-friendly marine protein solutions that align with environmentally conscious consumer preferences.
As the market continues to evolve, innovation in marine protein extraction, processing, and application is expected to accelerate growth. With consumers shifting toward nutritional and sustainable food choices, marine-derived proteins are set to become a crucial part of the global protein landscape, shaping the future of dietary and functional nutrition industries.
Table of Contents
Chapter 1 Methodology & Scope
- 1.1 Market scope & definition
- 1.2 Base estimates & calculations
- 1.3 Forecast calculation
- 1.4 Data sources
- 1.4.1 Primary
- 1.4.2 Secondary
- 1.4.2.1 Paid sources
- 1.4.2.2 Public sources
Chapter 2 Executive Summary
- 2.1 Industry synopsis, 2021-2034
Chapter 3 Industry Insights
- 3.1 Industry ecosystem analysis
- 3.1.1 Factor affecting the value chain
- 3.1.2 Profit margin analysis
- 3.1.3 Disruptions
- 3.1.4 Future outlook
- 3.1.5 Manufacturers
- 3.1.6 Distributors
- 3.2 Supplier landscape
- 3.3 Profit margin analysis
- 3.4 Key news & initiatives
- 3.5 Regulatory landscape
- 3.6 Impact forces
- 3.6.1 Growth drivers
- 3.6.1.1 Rich in essential nutrients
- 3.6.1.2 Improved athletic performance
- 3.6.1.3 Enhanced cognitive function
- 3.6.2 Industry pitfalls & challenges
- 3.6.2.1 Pollution and contaminants
- 3.6.1 Growth drivers
- 3.7 Growth potential analysis
- 3.8 Porter’s analysis
- 3.9 PESTEL analysis
Chapter 4 Competitive Landscape, 2024
- 4.1 Introduction
- 4.2 Company market share analysis
- 4.3 Competitive positioning matrix
- 4.4 Strategic outlook matrix
Chapter 5 Market Size and Forecast, By Source, 2021-2034 (USD Billion) (Kilo Tons)
- 5.1 Key trends
- 5.2 Fish-based
- 5.3 Shellfish-based
- 5.4 Algae-based
- 5.5 Other
Chapter 6 Market Size and Forecast, By Form, 2021-2034 (USD Billion) (Kilo Tons)
- 6.1 Key trends
- 6.2 Concentrates
- 6.3 Hydrolysates
- 6.4 Isolates
Chapter 7 Market Size and Forecast, By Distribution Channel, 2021-2034 (USD Billion) (Kilo Tons)
- 7.1 Key trends
- 7.2 Direct sales
- 7.3 Distributors
- 7.4 Retail
Chapter 8 Market Size and Forecast, By Region, 2021-2034 (USD Billion) (Kilo Tons)
- 8.1 Key trends
- 8.2 North America
- 8.2.1 U.S.
- 8.2.2 Canada
- 8.3 Europe
- 8.3.1 UK
- 8.3.2 Germany
- 8.3.3 France
- 8.3.4 Italy
- 8.3.5 Spain
- 8.3.6 Russia
- 8.4 Asia Pacific
- 8.4.1 China
- 8.4.2 India
- 8.4.3 Japan
- 8.4.4 South Korea
- 8.4.5 Australia
- 8.5 Latin America
- 8.5.1 Brazil
- 8.5.2 Mexico
- 8.6 MEA
- 8.6.1 South Africa
- 8.6.2 Saudi Arabia
- 8.6.3 UAE
Chapter 9 Company Profiles
- 9.1 Aker BioMarine
- 9.2 Aquaculture Protein
- 9.3 Biomega Group
- 9.4 Cargill
- 9.5 Cellulac
- 9.6 Corbion
- 9.7 DSM
- 9.8 Epax
- 9.9 FMC Corporation
- 9.10 Kerry Group
- 9.11 Lonza
- 9.12 Neptune Wellness Solutions
- 9.13 Nippon Suisan Kaisha
- 9.14 Royal Greenland
- 9.15 SkyBiometry

