|
|
市場調査レポート
商品コード
1400603
食用昆虫市場規模-製品別、用途別、産業分析レポート、成長展望、地域別展望、世界予測、2023年~2032年Edible Insects Market Size - By Product, Application, Industry Analysis Report, Growth Prospects, Regional Outlook & Global Forecast, 2023 - 2032 |
||||||
|
|||||||
カスタマイズ可能
|
|||||||

| 食用昆虫市場規模-製品別、用途別、産業分析レポート、成長展望、地域別展望、世界予測、2023年~2032年 |
|
出版日: 2023年11月24日
発行: Global Market Insights Inc.
ページ情報: 英文 170 Pages
納期: 2~3営業日
|

全表示
- 概要
- 図表
- 目次
食用昆虫の世界市場は、昆虫料理を通じて持続可能性を支持するレストランに後押しされ、2023年から2032年にかけて47%以上のCAGRを記録します。
環境意識の高まりは、エコロジカルフットプリントの低さから昆虫消費へのシフトを促進します。
例えば、2023年7月、日本では、食の持続可能性を強調するレストランが昆虫をメニューの一部として導入しました。東京の「Take-Noko」の創業者である斎藤妙子氏は、野菜、魚、肉と並んで昆虫を食事にシームレスに取り入れることを目指しています。Take-Nokoでは、コオロギのミートボールカレー、乾燥させた虫の調味料、ダンゴムシのエキスから抽出したサイダーなど、昆虫を使った多様な料理を提供しています。また、有名なベーカリーブランドのPascoは、コオロギの粉を使ったケーキやスナックを製造しています。注目すべきは、加工食品メーカーのニチレイや通信大手の日本電信電話といった日本企業が、最近昆虫関連のベンチャー企業に投資していることです。
この動向を受け、レストランは昆虫の栄養価や環境面での利点を強調し、環境に優しい食事を求める消費者を誘致しています。こうしたレストランが昆虫を使った料理をメニューに取り入れるにつれ、市場は関心の高まりに応えています。これは、持続可能な食の選択や、より多様な料理への、より広範な社会のシフトを反映しています。
カブトムシ分野は2023年から2032年にかけて大きく発展します。栄養価の高さと料理への応用範囲の広さが、この急成長に拍車をかける。高タンパク質含有量とユニークな風味で、カブトムシをベースにした製品は様々な料理や食の嗜好で注目を集めています。グルメ料理やスナック菓子、さらには健康食品のタンパク質豊富な食材として組み込まれることで、市場の魅力が増幅されます。持続可能で革新的な食品源に対する消費者の関心が高まる中、カブトムシは際立っており、食用昆虫市場における需要の大幅な急増を牽引しています。
スナック分野の食用昆虫市場規模は、2023年から2032年にかけて注目すべきCAGRを記録します。昆虫ベースのスナックは、進化する消費者の嗜好に対応し、タンパク質と栄養素が詰まった斬新で持続可能な代替品を提供します。昆虫をチップス、バー、香ばしい一口パンに組み込むことで、スナック文化を開拓し、風味を損なうことなく環境に優しい選択肢を提供します。健康志向の消費者が栄養価が高く便利な選択肢を求める中、昆虫を使ったスナックが人気の選択肢として浮上し、現代のスナック愛好家の進化する嗜好と持続可能性への懸念に応える成長市場セグメントを牽引しています。
中東・アフリカの食用昆虫産業は2023年から2032年にかけて顕著なCAGRを示すと思われます。同地域では伝統的な調理法を取り入れて昆虫を多様な料理に組み込み、その豊富な栄養価を活用しています。タンパク質が豊富な食品を好む文化的背景もあり、昆虫は古くから革新的な食生活を支えてきました。中東・アフリカの人口急増と持続可能な栄養への関心の高まりが市場の拡大を後押ししています。同地域が代替タンパク源を模索する中、食用昆虫市場は進化する消費者の嗜好とエコロジー意識に合わせて繁栄しています。例えば、2023年10月にジンバブエのチンホイ工科大学で開催された注目すべきイベントでは、「食用昆虫」のお披露目が行われました。この料理本は、アフリカの持続可能な食料安全保障に向けた大きな前進となった。この料理本は、アフリカ料理における食用昆虫の未開拓の可能性を紹介しています。
目次
第1章 調査手法と調査範囲
第2章 エグゼクティブサマリー
第3章 食用昆虫産業洞察
- 産業区分
- 業界情勢、2018~2032年
- エコシステム分析
- 流通チャネル分析
- コラボレーション/パートナーシップ
- eコマース(オンライン)
- 小売業者
- ダイレクト
- ストリート・ベンダーとローカル・ショップ
- ベンダー・マトリックス
- 流通チャネル分析
- イノベーションと持続可能性
- 規制状況
- 欧州食品安全機関(EFSA)
- EU
- コーデックス
- 連邦食品医薬品化粧品法(FFDCA)
- カナダ保健省
- フランス昆虫生産者・輸入業者・流通業者連合会(FFPIDI)
- 業界への影響要因
- 成長の原動力
- アジア太平洋:高い栄養価と機能性食品への応用による需要の高まり
- 欧州:タンパク質補助食品としての食用昆虫の食品用途への採用増加
- 環境への影響の低さ
- 原材料と輸送コストの低さ
- 業界の潜在的リスク・課題
- 限られた技術と知識不足
- 規制が明確でない
- 成長の原動力
- 成長の可能性分析、2022年
- 対応可能な市場の可能性
- 水産養殖産業
- 食肉産業
- ポーター分析
- 競合情勢、2022年
- 企業市場シェア、2022年
- 主要企業概要
- 戦略ダッシュボード
- PESTEL分析
第4章 食用昆虫市場:製品別
- 主要製品動向
- カブトムシ
- イモムシ
- バッタ、イナゴ、コオロギ
- ハチ、スズメバチ、アリ
- カイガラムシ
- その他
第5章 食用昆虫市場:用途別
- 主要用途動向
- 小麦粉
- バー
- スナック
- その他
第6章 食用昆虫市場:地域別動向
- 主要地域動向
- 北米
- 米国
- 欧州
- ベルギー
- オランダ
- 英国
- フランス
- アジア太平洋
- 中国
- タイ
- ベトナム
- ラテンアメリカ(LATAM)
- ブラジル
- メキシコ
- 中東・アフリカ
第7章 企業プロファイル
- HaoCheng Mealworms, Inc.
- Agriprotein Technologies
- Kreca
- EnviroFlight
- Proti-Farm
- Chapul LLC
- Exo Protein
- Thailand Unique
- Six Foods
- Bitty Foods
- Gathr Foods
- Crowbar Protein
- Green Kow
- Edible Inc.
- Crik Nutrition
- Nutribug Ltd.
- Cricket Flours
- Crickers
- Bugsolutely
- Bensbugs
- Ecobars Pty Ltd.
- LaViewEye
- Bugeater Foods
- Insectitos
- Fluker's Cricket Farm Inc
- Entomo Farms
- Micronutris
- Entotech
- Ynsect
Data Tables
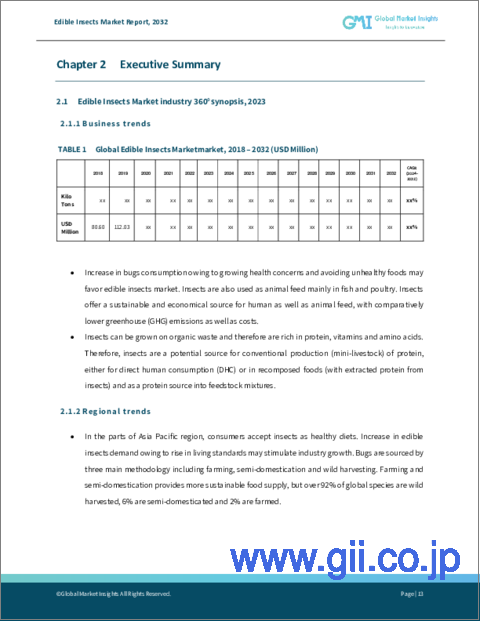
- TABLE 1 Edible insects industry 360 degree synopsis, 2018 - 2032
- TABLE 2 Global edible insects market, 2018 - 2032, (USD Million)
- TABLE 3 Global edible insects market revenue, by region, 2018 - 2032, (USD Million)
- TABLE 4 Global edible insects market revenue, by product, 2018 - 2032, (USD Million)
- TABLE 5 Global edible insects market revenue, by application, 2018 - 2032, (USD Million)
- TABLE 6 Edible insects distribution trends
- TABLE 7 Vendor matrix
- TABLE 8 Company innovation overview
- TABLE 9 Maximum permissible limits of insect contamination in food products
- TABLE 10 Industry impact forces
- TABLE 11 Average protein content comparison among insects, proteins, fish and mammals
- TABLE 12 Nutrient and mineral composition of edible insect species
- TABLE 13 Amino acid spectra of edible insects
- TABLE 14 Feed required for one pound of meat production from micro livestock (Insects)
- TABLE 15 Global aquafeed market volume, by region, 2018 - 2032, (Kilo Tons)
- TABLE 16 Global aquafeed market revenue, by region, 2018 - 2032, (USD Billion)
- TABLE 17 Potential edible insects market size by replacing aquafeed, 2018 - 2032, (USD Billion)
- TABLE 18 Top players overview
- TABLE 19 Global edible insects market from beetles, 2018 - 2032, (USD Million)
- TABLE 20 Global edible insects market revenue from beetles, by region, 2018 - 2032, (USD Million)
- TABLE 21 Global edible insects market from Caterpillars, 2018 - 2032, (USD Million)
- TABLE 22 Global edible insects market revenue from Caterpillars, by region, 2018 - 2032, (USD Million)
- TABLE 23 Global edible insects market from Grasshoppers, locusts & crickets, 2018 - 2032, (USD Million)
- TABLE 24 Global edible insects market revenue from Grasshoppers, locusts & crickets, by region, 2018 - 2032, (USD Million)
- TABLE 25 Global edible insects market revenue from Grasshoppers, locusts & crickets, by region, 2018 - 2032, (USD Million)
- TABLE 26 Global edible insects market from Bees, wasps & ants, 2018 - 2032, (USD Million)
- TABLE 27 Global edible insects market revenue from Bees, wasps & ants, by region, 2018 - 2032, (USD Million)
- TABLE 28 Global edible insects market from Scale insects & tree bugs, 2018 - 2032, (USD Million)
- TABLE 29 Global edible insects market revenue from Scale insects & tree bugs, by region, 2018 - 2032, (USD Million)
- TABLE 30 Global edible insects market from Others, 2018 - 2032, (USD Million)
- TABLE 31 Global edible insects market revenue from Others, by region, 2018 - 2032, (USD Million)
- TABLE 32 Global edible insects market from flour, 2018 - 2032, (USD Million)
- TABLE 33 Global edible insects market revenue from flour, by region, 2018 - 2032, (USD Million)
- TABLE 34 Global edible insects market from bar, 2018 - 2032, (USD Million)
- TABLE 35 Global edible insects market revenue from bar, by region, 2018 - 2032, (USD Million)
- TABLE 36 Global edible insects market from snacks, 2018 - 2032, (USD Million)
- TABLE 37 Global edible insects market revenue from snacks, by region, 2018 - 2032, (USD Million)
- TABLE 38 Global edible insects market from others, 2018 - 2032, (USD Million)
- TABLE 39 Global edible insects market revenue from others, by region, 2018 - 2032, (USD Million)
- TABLE 40 North America edible insects market, 2018 - 2032, (USD Million)
- TABLE 41 North America edible insects revenue, by product, 2018 - 2032, (USD Million)
- TABLE 42 North America edible insects revenue, by application, 2018 - 2032, (USD Million)
- TABLE 43 U.S. edible insects market, 2018 - 2032, (USD Million)
- TABLE 44 U.S. edible insects market revenue, by product, 2018 - 2032, (USD Million)
- TABLE 45 U.S. edible insects market revenue, by application, 2018 - 2032, (USD Million)
- TABLE 46 Europe edible insects market, 2018 - 2032, (USD Million)
- TABLE 47 Europe edible insects revenue, by product, 2018 - 2032, (USD Million)
- TABLE 48 Europe edible insects revenue, by application, 2018 - 2032, (USD Million)
- TABLE 49 Belgium edible insects market, 2018 - 2032, (USD Million)
- TABLE 50 Belgium edible insects market revenue, by product, 2018 - 2032, (USD Million)
- TABLE 51 Belgium edible insects market revenue, by application, 2018 - 2032, (USD Million)
- TABLE 52 Netherlands edible insects market, 2018 - 2032, (USD Million)
- TABLE 53 Netherlands edible insects market revenue, by product, 2018 - 2032, (USD Million)
- TABLE 54 Netherlands edible insects market revenue, by application, 2018 - 2032, (USD Million)
- TABLE 55 UK edible insects market, 2018 - 2032, (USD Million)
- TABLE 56 UK edible insects market revenue, by product, 2018 - 2032, (USD Million)
- TABLE 57 UK edible insects market revenue, by application, 2018 - 2032, (USD Million)
- TABLE 58 France edible insects market, 2018 - 2032, (USD Million)
- TABLE 59 France edible insects market revenue, by product, 2018 - 2032, (USD Million)
- TABLE 60 France edible insects market revenue, by application, 2018 - 2032, (USD Million)
- TABLE 61 Asia Pacific edible insects market, 2018 - 2032, (USD Million)
- TABLE 62 Asia Pacific edible insects revenue, by product, 2018 - 2032, (USD Million)
- TABLE 63 Asia Pacific edible insects revenue, by application, 2018 - 2032, (USD Million)
- TABLE 64 China edible insects market, 2018 - 2032, (USD Million)
- TABLE 65 China edible insects market revenue, by product, 2018 - 2032, (USD Million)
- TABLE 66 China edible insects market revenue, by application, 2018 - 2032, (USD Million)
- TABLE 67 Thailand edible insects market, 2018 - 2032, (USD Million)
- TABLE 68 Thailand edible insects market revenue, by product, 2018 - 2032, (USD Million)
- TABLE 69 Thailand edible insects market revenue, by application, 2018 - 2032, (USD Million)
- TABLE 70 Vietnam edible insects market, 2018 - 2032, (USD Million)
- TABLE 71 Vietnam edible insects market revenue, by product, 2018 - 2032, (USD Million)
- TABLE 72 Vietnam edible insects market revenue, by application, 2018 - 2032, (USD Million)
- TABLE 73 Latin America (LATAM) edible insects market, 2018 - 2032, (USD Million)
- TABLE 74 Latin America (LATAM) edible insects revenue, by product, 2018 - 2032, (USD Million)
- TABLE 75 Latin America (LATAM) edible insects revenue, by application, 2018 - 2032, (USD Million)
- TABLE 76 Brazil edible insects market, 2018 - 2032, (USD Million)
- TABLE 77 Brazil edible insects market revenue, by product, 2018 - 2032, (USD Million)
- TABLE 78 Brazil edible insects market revenue, by application, 2018 - 2032, (USD Million)
- TABLE 79 Mexico edible insects market, 2018 - 2032, (USD Million)
- TABLE 80 Mexico edible insects market revenue, by product, 2018 - 2032, (USD Million)
- TABLE 81 Mexico edible insects market revenue, by application, 2018 - 2032, (USD Million)
- TABLE 82 Middle East & Africa (MEA) edible insects market, 2018 - 2032, (USD Million)
- TABLE 83 Middle East & Africa (MEA) edible insects revenue, by product, 2018 - 2032, (USD Million)
- TABLE 84 Middle East & Africa (MEA) edible insects revenue, by application, 2018 - 2032, (USD Million)
Charts & Figures
- FIG. 1 Industry segmentation
- FIG. 2 Global edible insects market estimates & forecast, (USD Million), 2018 - 2032
- FIG. 3 Industry ecosystem analysis
- FIG. 4 Global functional food sales, by region (USD Million), 2018- 2020
- FIG. 5 Growth potential analysis, 2022
- FIG. 6 Porter's analysis
- FIG. 7 Company market share, 2022
- FIG. 8 PESTEL analysis
- FIG. 9 SWOT Analysis, HaoCheng Mealworms Inc.
- FIG. 10 SWOT Analysis, Agri-Protein Technologies
- FIG. 11 SWOT Analysis, Kreca
- FIG. 12 SWOT Analysis, Enviroflight
- FIG. 13 SWOT Analysis, Proti-farm
- FIG. 14 SWOT Analysis, Chapul LLC
- FIG. 15 SWOT Analysis, Exo protein
- FIG. 16 SWOT Analysis, Thailand Unique
- FIG. 17 SWOT Analysis, Six Foods
- FIG. 18 SWOT Analysis, Bitty Foods
- FIG. 19 SWOT Analysis, Gathr Foods
- FIG. 20 SWOT Analysis, Crowbar Protein
- FIG. 21 SWOT Analysis, The Green Kow Company Sprl
- FIG. 22 SWOT Analysis, Edible Inc.
- FIG. 23 SWOT Analysis, Crik Nutrition
- FIG. 24 SWOT Analysis, Nutribug Ltd.
- FIG. 25 SWOT Analysis, Cricket Flours LLC
- FIG. 26 SWOT Analysis, Crickers
- FIG. 27 SWOT Analysis, Bugsolutely Ltd.
- FIG. 28 SWOT Analysis, Bensbugs
- FIG. 29 SWOT Analysis, Ecobars Pty. Ltd.
- FIG. 30 SWOT Analysis, LaViewEye
- FIG. 31 SWOT Analysis, Bugeater
- FIG. 32 SWOT Analysis, Insectitos
- FIG. 33 SWOT Analysis, Fluker's cricket Farm Inc.
- FIG. 34 SWOT Analysis, Entomo Farms
- FIG. 35 SWOT Analysis, Micronutris
- FIG. 36 SWOT Analysis, Entotech
- FIG. 37 SWOT Analysis, Ynsect
Global Edible Insects Market will witness over 47% CAGR between 2023 and 2032 propelled by restaurants championing sustainability through insect-based cuisine. Rising environmental consciousness fosters a shift towards insect consumption due to its low ecological footprint.
For instance, in July 2023, In Japan, a restaurant emphasizing food sustainability introduced insects as part of their menu. Taeko Saito, the founder of Tokyo's Take-Noko, aims to integrate insects seamlessly into meals alongside vegetables, fish, and meat. Take-Noko offers diverse insect-infused dishes like cricket meatball curry, seasonings from dried bugs, and cider derived from giant water bug extract. Additionally, Pasco, a renowned bakery brand, crafts cakes, and snacks using cricket flour. Notably, Japanese companies such as Nichirei, a processed food maker, and Nippon Telegraph and Telephone, a telecom giant, have recently invested in insect-related ventures.
Restaurants, embracing this trend, highlight insects' nutritional value and environmental benefits, enticing consumers seeking eco-friendly dining options. As these establishments integrate insect-based dishes into menus, the market responds to the growing interest, reflecting a broader societal shift towards sustainable food choices and a more diverse culinary landscape.
The overall Edible Insects Market share is classified based on the product, application, and region.
Beetles segment will undergo significant development from 2023 to 2032. Their nutritional profile and versatility in culinary applications fuel this surge. With high protein content and unique flavors, beetle-based products attract attention across various cuisines and dietary preferences. Their integration into gourmet dishes, snacks, and even as a protein-rich ingredient in health foods amplifies their market appeal. As consumer interest grows in sustainable and innovative food sources, beetles stand out, driving a significant upsurge in demand within the Edible Insects Market.
Edible insects market size from the snacks segment will register a noteworthy CAGR from 2023 to 2032. Insect-based snacks cater to evolving consumer tastes, offering novel and sustainable alternatives packed with protein and nutrients. Their incorporation into chips, bars, and savory bites taps into the snacking culture, presenting eco-friendly choices without compromising flavor. As health-conscious consumers seek nutritious yet convenient options, insect-based snacks emerge as a popular choice, driving a growing market segment responding to the evolving preferences and sustainability concerns of modern snack enthusiasts.
MEA edible insects industry will showcase a commendable CAGR from 2023 to 2032. Embracing traditional culinary practices, the region integrates insects into its diverse cuisine, capitalizing on their rich nutritional value. With a cultural appreciation for protein-rich foods, insects serve as an ancient yet innovative dietary source. MEA's burgeoning population, coupled with a growing interest in sustainable nutrition, propels the market's expansion. As the region explores alternative protein sources, the Edible Insects Market thrives, aligning with evolving consumer preferences and ecological consciousness. For instance, in October 2023, During a notable occasion hosted at Zimbabwe's Chinhoyi University of Technology, the unveiling of the "Edible Insects: Food for the Future" cookbook marked a significant stride toward sustainable food security in Africa. This cookbook showcases the untapped potential of edible insects within African cuisine.
Table of Contents
Chapter 1 Methodology & Scope
- 1.1 Methodology
- 1.2 Market definitions
- 1.3 Market estimation & forecast parameters
- 1.4 Data Sources
- 1.4.1 Primary
- 1.4.2 Secondary
- 1.4.2.1 Paid Sources
- 1.4.2.2 Public Sources
Chapter 2 Executive Summary
- 2.1 Edible insects industry 360 degree synopsis, 2018 - 2032
- 2.1.1 Business trends
- 2.1.2 Regional trends
- 2.1.3 Product trends
- 2.1.4 Application trends
Chapter 3 Edible Insects Industry Insights
- 3.1 Industry segmentation
- 3.2 Industry landscape, 2018 - 2032
- 3.3 Industry ecosystem analysis
- 3.3.1 Distribution channel analysis
- 3.3.1.1 Collaboration/Partnership
- 3.3.1.2 E-commerce (Online)
- 3.3.1.3 Retailers
- 3.3.1.4 Direct
- 3.3.1.5 Street vendor and local shops
- 3.3.2 Vendor matrix
- 3.3.1 Distribution channel analysis
- 3.4 Innovation & sustainability
- 3.5 Regulatory landscape
- 3.5.1 European Food Safety Agency (EFSA)
- 3.5.2 EU
- 3.5.3 Codex Alimentarius
- 3.5.4 Federal Food, Drug, and Cosmetic Act (FFDCA)
- 3.5.5 Health Canada
- 3.5.6 French Federation of Producers, Importers and Distributors of Insects (FFPIDI)
- 3.6 Industry impact forces
- 3.6.1 Growth Drivers
- 3.6.1.1 Asia Pacific: Growing demand owing to high nutritional value and application in functional foods
- 3.6.1.2 Europe: Rising adoption of edible insects in food application as protein supplement
- 3.6.1.3 Low environmental impact
- 3.6.1.4 Low cost of raw materials and transportation
- 3.6.2 Industry pitfalls & challenges
- 3.6.2.1 Limited technology and lack of knowledge
- 3.6.2.2 Lack of regulatory clarity
- 3.6.1 Growth Drivers
- 3.7 Growth potential analysis, 2022
- 3.7.1 Addressable market potential
- 3.7.2 Aquaculture industry
- 3.7.3 Poultry industry
- 3.8 Porter's analysis
- 3.9 Competitive landscape, 2022
- 3.9.1 Company market share, 2022
- 3.9.2 Top players overview
- 3.9.3 Strategy dashabord
- 3.10 PESTEL analysis
Chapter 4 Edible Insects Market, By Product
- 4.1 Key product trends
- 4.2 Beetles
- 4.2.1 Global edible insects market from beetles, 2018 - 2032, (USD Million)
- 4.2.2 Global edible insects market from beetles, by region, 2018 - 2032, (USD Million)
- 4.3 Caterpillars
- 4.3.1 Global edible insects market from Caterpillars, 2018 - 2032, (USD Million)
- 4.3.2 Global edible insects market from Caterpillars, by region, 2018 - 2032, (USD Million)
- 4.4 Grasshoppers, locusts & crickets
- 4.4.1 Global edible insects market from Grasshoppers, locusts & crickets, 2018 - 2032, (USD Million)
- 4.4.2 Global edible insects market from Grasshoppers, locusts & crickets, by region, 2018 - 2032, (USD Million)
- 4.5 Bees, wasps & ants
- 4.5.1 Global edible insects market from Bees, wasps & ants, 2018 - 2032, (USD Million)
- 4.5.2 Global edible insects market from Bees, wasps & ants, by region, 2018 - 2032, (USD Million)
- 4.6 Scale insects & tree bugs
- 4.6.1 Global edible insects market from Scale insects & tree bugs, 2018 - 2032, (USD Million)
- 4.6.2 Global edible insects market from Scale insects & tree bugs, by region, 2018 - 2032, (USD Million)
- 4.7 Others
- 4.7.1 Global edible insects market from Others, 2018 - 2032, (USD Million)
- 4.7.2 Global edible insects market from Others, by region, 2018 - 2032, (USD Million)
Chapter 5 Edible Insects Market, By Application
- 5.1 Key application trends
- 5.2 Flour
- 5.2.1 Global edible insects market from flour, 2018 - 2032, (USD Million)
- 5.2.2 Global edible insects market from flour, by region, 2018 - 2032, (USD Million)
- 5.3 Bar
- 5.3.1 Global edible insects market from bar, 2018 - 2032, (USD Million)
- 5.3.2 Global edible insects market from bar, by region, 2018 - 2032, (USD Million)
- 5.4 Snacks
- 5.4.1 Global edible insects market from snacks, 2018 - 2032, (USD Million)
- 5.4.2 Global edible insects market from snacks, by region, 2018 - 2032, (USD Million)
- 5.5 Others
- 5.5.1 Global edible insects market from others, 2018 - 2032, (USD Million)
- 5.5.2 Global edible insects market from others, by region, 2018 - 2032, (USD Million)
Chapter 6 Edible Insects Market, By Region
- 6.1 Key regional trends
- 6.2 North America
- 6.2.1 North America edible insects market, 2018 - 2032, (USD Million)
- 6.2.2 North America edible insects market, by product, 2018 - 2032, (USD Million)
- 6.2.3 North America edible insects market, by application, 2018 - 2032, (USD Million)
- 6.2.4 U.S.
- 6.2.4.1 U.S. edible insects market, 2018 - 2032, (USD Million)
- 6.2.4.2 U.S. edible insects market, by product, 2018 - 2032, (USD Million)
- 6.2.4.3 U.S. edible insects market, by application, 2018 - 2032, (USD Million)
- 6.3 Europe
- 6.3.1 Europe edible insects market, 2018 - 2032, (USD Million)
- 6.3.2 Europe edible insects market, by product, 2018 - 2032, (USD Million)
- 6.3.3 Europe edible insects market, by application, 2018 - 2032, (USD Million)
- 6.3.4 Belgium
- 6.3.4.1 Belgium edible insects market, 2018 - 2032, (USD Million)
- 6.3.4.2 Belgium edible insects market, by product, 2018 - 2032, (USD Million)
- 6.3.4.3 Belgium edible insects market, by application, 2018 - 2032, (USD Million)
- 6.3.5 Netherlands
- 6.3.5.1 Netherlands edible insects market, 2018 - 2032, (USD Million)
- 6.3.5.2 Netherlands edible insects market, by product, 2018 - 2032, (USD Million)
- 6.3.5.3 Netherlands edible insects market, by application, 2018 - 2032, (USD Million)
- 6.3.6 UK
- 6.3.6.1 UK edible insects market, 2018 - 2032, (USD Million)
- 6.3.6.2 UK edible insects market, by product, 2018 - 2032, (USD Million)
- 6.3.6.3 UK edible insects market, by application, 2018 - 2032, (USD Million)
- 6.3.7 France
- 6.3.7.1 France edible insects market, 2018 - 2032, (USD Million)
- 6.3.7.2 France edible insects market, by product, 2018 - 2032, (USD Million)
- 6.3.7.3 France edible insects market, by application, 2018 - 2032, (USD Million)
- 6.4 Asia Pacific
- 6.4.1 Asia Pacific edible insects market, 2018 - 2032, (USD Million)
- 6.4.2 Asia Pacific edible insects market, by product, 2018 - 2032, (USD Million)
- 6.4.3 Asia Pacific edible insects market, by application, 2018 - 2032, (USD Million)
- 6.4.4 China
- 6.4.4.1 China edible insects market, 2018 - 2032, (USD Million)
- 6.4.4.2 China edible insects market, by product, 2018 - 2032, (USD Million)
- 6.4.4.3 China edible insects market, by application, 2018 - 2032, (USD Million)
- 6.4.5 Thailand
- 6.4.5.1 Thailand edible insects market, 2018 - 2032, (USD Million)
- 6.4.5.2 Thailand edible insects market, by product, 2018 - 2032, (USD Million)
- 6.4.5.3 Thailand edible insects market, by application, 2018 - 2032, (USD Million)
- 6.4.6 Vietnam
- 6.4.6.1 Vietnam edible insects market, 2018 - 2032, (USD Million)
- 6.4.6.2 Vietnam edible insects market, by product, 2018 - 2032, (USD Million)
- 6.4.6.3 Vietnam edible insects market, by application, 2018 - 2032, (USD Million)
- 6.5 Latin America (LATAM)
- 6.5.1 Latin America (LATAM) edible insects market, 2018 - 2032, (USD Million)
- 6.5.2 Latin America (LATAM) edible insects market, by product, 2018 - 2032, (USD Million)
- 6.5.3 Latin America (LATAM) edible insects market, by application, 2018 - 2032, (USD Million)
- 6.5.4 Brazil
- 6.5.4.1 Brazil edible insects market, 2018 - 2032, (USD Million)
- 6.5.4.2 Brazil edible insects market, by product, 2018 - 2032, (USD Million)
- 6.5.4.3 Brazil edible insects market, by application, 2018 - 2032, (USD Million)
- 6.5.5 Mexico
- 6.5.5.1 Mexico edible insects market, 2018 - 2032, (USD Million)
- 6.5.5.2 Mexico edible insects market, by product, 2018 - 2032, (USD Million)
- 6.5.5.3 Mexico edible insects market, by application, 2018 - 2032, (USD Million)
- 6.6 Middle East & Africa (MEA)
- 6.6.1 Middle East & Africa (MEA) edible insects market, 2018 - 2032, (USD Million)
- 6.6.2 Middle East & Africa (MEA) edible insects market, by product, 2018 - 2032, (USD Million)
- 6.6.3 Middle East & Africa (MEA) edible insects market, by application, 2018 - 2032, (USD Million)
Chapter 7 Company Profiles
- 7.1 HaoCheng Mealworms, Inc.
- 7.1.1 Business Overview
- 7.1.2 Financial Data
- 7.1.3 Product Landscape
- 7.1.4 SWOT Analysis
- 7.2 Agriprotein Technologies
- 7.2.1 Business Overview
- 7.2.2 Financial Data
- 7.2.3 Product Landscape
- 7.2.4 SWOT Analysis
- 7.2.5 Strategic Outlook
- 7.3 Kreca
- 7.3.1 Business Overview
- 7.3.2 Financial Data
- 7.3.3 Product Landscape
- 7.3.4 SWOT Analysis
- 7.4 EnviroFlight
- 7.4.1 Business Overview
- 7.4.2 Financial Data
- 7.4.3 Product Landscape
- 7.4.4 SWOT Analysis
- 7.4.5 Strategic Outlook
- 7.5 Proti-Farm
- 7.5.1 Business Overview
- 7.5.2 Financial Data
- 7.5.3 Product Landscape
- 7.5.4 SWOT Analysis
- 7.5.5 Strategic Outlook
- 7.6 Chapul LLC
- 7.6.1 Business Overview
- 7.6.2 Financial Data
- 7.6.3 Product Landscape
- 7.6.4 SWOT Analysis
- 7.6.5 Strategic Outlook
- 7.7 Exo Protein
- 7.7.1 Business Overview
- 7.7.2 Financial Data
- 7.7.3 Product Landscape
- 7.7.4 SWOT Analysis
- 7.7.5 Strategic Outlook
- 7.8 Thailand Unique
- 7.8.1 Business Overview
- 7.8.2 Financial Data
- 7.8.3 Product Landscape
- 7.8.4 SWOT Analysis
- 7.9 Six Foods
- 7.9.1 Business Overview
- 7.9.2 Financial Data
- 7.9.3 Product Landscape
- 7.9.4 SWOT Analysis
- 7.9.5 Strategic Outlook
- 7.10 Bitty Foods
- 7.10.1 Business Overview
- 7.10.2 Financial Data
- 7.10.3 Product Landscape
- 7.10.4 SWOT Analysis
- 7.11 Gathr Foods
- 7.11.1 Business Overview
- 7.11.2 Financial Data
- 7.11.3 Product Landscape
- 7.11.4 SWOT Analysis
- 7.11.5 Strategic Outlook
- 7.12 Crowbar Protein
- 7.12.1 Business Overview
- 7.12.2 Financial Data
- 7.12.3 Product Landscape
- 7.12.4 SWOT Analysis
- 7.13 Green Kow
- 7.13.1 Business Overview
- 7.13.2 Financial Data
- 7.13.3 Product Landscape
- 7.13.4 SWOT Analysis
- 7.14 Edible Inc.
- 7.14.1 Business Overview
- 7.14.2 Financial Data
- 7.14.3 Product Landscape
- 7.14.4 SWOT Analysis
- 7.15 Crik Nutrition
- 7.15.1 Business Overview
- 7.15.2 Financial Data
- 7.15.3 Product Landscape
- 7.15.4 SWOT Analysis
- 7.16 Nutribug Ltd.
- 7.16.1 Business Overview
- 7.16.2 Financial Data
- 7.16.3 Product Landscape
- 7.16.4 SWOT Analysis
- 7.16.5 Strategic Outlook
- 7.17 Cricket Flours
- 7.17.1 Business Overview
- 7.17.2 Financial Data
- 7.17.3 Product Landscape
- 7.17.4 SWOT Analysis
- 7.17.5 Strategic Outlook
- 7.18 Crickers
- 7.18.1 Business Overview
- 7.18.2 Financial Data
- 7.18.3 Product Landscape
- 7.18.4 SWOT Analysis
- 7.19 Bugsolutely
- 7.19.1 Business Overview
- 7.19.2 Financial Data
- 7.19.3 Product Landscape
- 7.19.4 SWOT Analysis
- 7.20 Bensbugs
- 7.20.1 Business Overview
- 7.20.2 Financial Data
- 7.20.3 Product Landscape
- 7.20.4 SWOT Analysis
- 7.21 Ecobars Pty Ltd.
- 7.21.1 Business Overview
- 7.21.2 Financial Data
- 7.21.3 Product Landscape
- 7.21.4 SWOT Analysis
- 7.22 LaViewEye
- 7.22.1 Business Overview
- 7.22.2 Financial Data
- 7.22.3 Product Landscape
- 7.22.4 SWOT Analysis
- 7.23 Bugeater Foods
- 7.23.1 Business Overview
- 7.23.2 Financial Data
- 7.23.3 Product Landscape
- 7.23.4 SWOT Analysis
- 7.24 Insectitos
- 7.24.1 Business Overview
- 7.24.2 Financial Data
- 7.24.3 Product Landscape
- 7.24.4 SWOT Analysis
- 7.25 Fluker's Cricket Farm Inc
- 7.25.1 Business Overview
- 7.25.2 Financial Data
- 7.25.3 Product Landscape
- 7.25.4 SWOT Analysis
- 7.26 Entomo Farms
- 7.26.1 Business Overview
- 7.26.2 Financial Data
- 7.26.3 Product Landscape
- 7.26.4 SWOT Analysis
- 7.27 Micronutris
- 7.27.1 Business Overview
- 7.27.2 Financial Data
- 7.27.3 Product Landscape
- 7.27.4 SWOT Analysis
- 7.28 Entotech
- 7.28.1 Business Overview
- 7.28.2 Financial Data
- 7.28.3 Product Landscape
- 7.28.4 SWOT Analysis
- 7.29 Ynsect
- 7.29.1 Business Overview
- 7.29.2 Financial Data
- 7.29.3 Product Landscape
- 7.29.4 SWOT Analysis

