|
|
市場調査レポート
商品コード
1426155
持続可能データセンター市場:世界の展望と予測 (2023-2028年)Sustainable Data Center Market - Global Outlook & Forecast 2023-2028 |
||||||
|
|
|||||||
|
|||||||


| 持続可能データセンター市場:世界の展望と予測 (2023-2028年) |
|
出版日: 2024年02月15日
発行: Arizton Advisory & Intelligence
ページ情報: 英文 492 Pages
納期: 即納可能
|

- 全表示
- 概要
- 図表
- 目次
世界の持続可能データセンターの市場規模は、投資額で2022年の312億5,000万米ドルから、予測期間中はCAGR 9.72%で成長すると予測されています。
主なハイライト
- The Paris Agreement、RE100、LEEDやISO50001などの認証といった政策要因がラテンアメリカのグリーンデータセンター開発の市場を牽引
- The Climate Neutral Data Centre Pactが欧州のデータセンターの持続可能性を高める上で重要な役割を果たしており、2030年までにすべての署名機関が施設のエネルギーを再生可能エネルギーに
- アジア太平洋地域のデータセンターはLEEDやBCA Green Markなどのグリーン認証の取得に取り組み、持続可能性へのコミットメントをアピール
主要市場動向
再生可能エネルギー源と効率的な冷却への注目の高まり
- AWS、Google, Facebook (Meta)、Microsoft、Appleなどのハイパースケール企業:データセンター用に再生可能エネルギーを調達
- QTS Realty Trust:2025年までに再生可能エネルギー100%を目標に掲げ、エネルギー需要の35%を再生可能エネルギーで賄う
- データセンターの電力消費量と二酸化炭素排出量を削減するため、フリークーリングチラーが増加する見通し。液冷へのシフトも進み、より持続可能なデータセンターとなり、PUEは1.1~1.4の範囲に低下へ
- 環境への影響とデータセンターのPUE低減のため、ほとんどの施設で空冷と液浸冷却が使用される
- 熱帯気候の中でデータセンターの効率を高めるため、シンガポールで熱帯テストベッドが検証されている。これが成功すれば、ラテンアメリカ市場にもプラスの影響を与え、施設のPUEをさらに削減することができる
データセンターへの電力供給の新たな動向
持続可能性に向けた政府の後押し
モジュール式データセンターの展開と持続可能な資材収集の勢い
当レポートでは、世界の持続可能データセンターの市場を調査し、市場の定義と概要、市場機会・市場動向、市場影響因子の分析、市場規模の推移・予測、各種区分・地域別の詳細分析、競合情勢、主要企業のプロファイルなどをまとめています。
目次
第1章 調査範囲
第2章 市場概要
第3章 重要考察
- 主なハイライト
- 主要市場動向
- 地域分析
- 部門別分析
- ベンダー分析
第4章 イントロダクション
- 市場概要
- 電力使用効率 (PUE)
- 推進政策
- エネルギー認証
第5章 市場機会と動向
- 革新的なデータセンター電力技術
- データセンター電力技術における持続可能なイノベーション
- 革新的なデータセンター冷却技術
- AIおよびHPCによる液体浸漬とチップへの直接冷却の採用の促進
- 地域暖房コンセプトの採用の増加
- 産業用電力料金の値上げ
- PUE1.5未満を目標とするデータセンターの成長
- 先進ITインフラの導入
- 持続可能データセンター開発の政府による推進
第6章 市場成長の実現要因
- ハイパースケールおよびクラウド事業者による再生可能エネルギーへの取り組み
- コロケーションおよび企業運営者による再生可能エネルギーへの取り組み
- クラウドサービスの導入の拡大
- 自動化およびインテリジェント監視ソリューション
- モジュール型データセンターと発電機の展開
第7章 市場抑制要因
- データセンターからの二酸化炭素排出量の増加
- データセンターによる水の消費量
- 熟練したデータセンター専門家の不足
- 持続可能データセンターのための場所の制約
第8章 市場情勢
- 市場概要
- 投資額:市場規模・予測
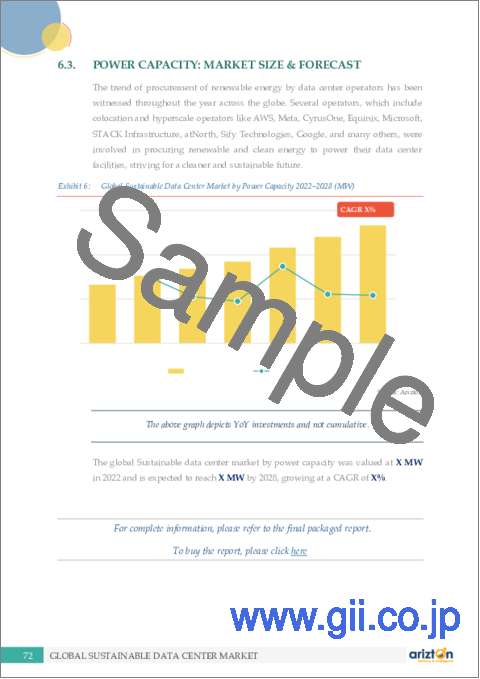
- 電力容量:市場規模・予測
- インフラ:市場規模・予測
第9章 インフラ
- 市場スナップショット
- 主なハイライト
- 電気インフラ
- 機械インフラ
- 一般建設
- 市場概要
- 投資額:市場規模・予測
第10章 北米
第11章 ラテンアメリカ
第12章 西欧
第13章 北欧
第14章 中欧・東欧
第15章 中東
第16章 アフリカ
第17章 アジア太平洋
第18章 東南アジア
第19章 競合情勢
- データセンターの投資家
- 再生可能エネルギープロバイダー
第20章 主要な企業プロファイル
- AFRICA DATA CENTRES
- AIRTEL (NXTRA DATA)
- AIRTRUNK
- ALIBABA
- ALIGNED DATA CENTERS
- AMAZON WEB SERVICES (AWS)
- AMERICAN TOWER
- APPLE
- AQ COMPUTE
- ATMAN
- ATNORTH
- BIG DATA EXCHANGE (BDX)
- CDC DATA CENTRES
- CHAYORA
- CHINA TELECOM
- CHINDATA GROUP
- CLOUDHQ
- COLOGIX
- COLT DATA CENTRE SERVICES (COLT DCS)
- COMPASS DATACENTERS
- CORSCALE DATA CENTERS
- CTRLS DATACENTERS
- CYRUSONE
- CYXTERA TECHNOLOGIES
- DATA4 GROUP
- DATABANK
- DIGITAL EDGE DC
- DIGITAL REALTY
- EDGECONNEX
- EQUINIX
- FLEXENTIAL
- GDS SERVICES
- GLOBAL SWITCH
- GREEN MOUNTAIN (AZRIELI GROUP)
- GREENSQUAREDC
- GULF DATA HUB
- HOSTDIME
- HUAWEI TECHNOLOGIES
- IRON MOUNTAIN
- IXAFRICA
- KEPPEL DATA CENTRES
- KHAZNA DATA CENTERS
- KIO NETWORKS
- KAO DATA
- LUMEN TECHNOLOGIES (CIRION TECHNOLOGIES)
- META
- MICROSOFT
- MORO HUB
- NAUTILUS DATA TECHNOLOGIES
- NETIA
- NEXTDC
- NTT GLOBAL DATA CENTERS
- NOVVA DATA CENTERS
- ONEASIA NETWORK
- ORACLE
- ORANGE BUSINESS SERVICES
- OVHCLOUD
- PENTA INFRA
- PRINCETON DIGITAL GROUP
- QTS REALTY TRUST
- RACKBANK
- RAXIO GROUP
- ROSTELECOM
- SABEY DATA CENTERS
- SCALA DATA CENTERS
- SERVERFARM
- SIFY TECHNOLOGIES
- SPACEDC
- STACK INFRASTRUCTURE
- ST TELEMEDIA GLOBAL DATA CENTRES
- SUNEVISION (IADVANTAGE)
- SWITCH
- T5 DATA CENTERS
- TELEHOUSE
- TENCENT
- TENGLONG HOLDINGS GROUP
- VANTAGE DATA CENTERS
- VNET GROUP
- YANDEX
- YONDR
- YOTTA INFRASTRUCTURE
第21章 再生可能エネルギープロバイダー
- ACCONIA ENERGIA
- ADANI GREEN ENERGY (AGEL)
- AGL
- ALGONQUIN POWER & UTILITIES CORP
- AMP ENERGY
- APEX CLEAN ENERGY
- AVAADA ENERGY
- BETTER ENERGY
- BRYT ENERGY
- CONRAD ENERGY
- DATAFARM ENERGY
- DE SHAW RENEWABLE INVESTMENTS
- DISTRIBUTED POWER TECHNOLOGIES
- DOMINION ENERGY
- EDF RENEWABLES
- ENECO
- ENEL GROUP
- ENGIE
- ERG
- FARO ENERGY
- GREENYELLOW
- HDF ENERGY
- IBERDROLA
- ILMATAR ENERGY
- LEEWARD RENEWABLE ENERGY
- LIGHTSOURCE BP
- MC RETAIL ENERGY
- MP2 ENERGY
- NEOEN
- NEXTERA ENERGY
- NTR
- ØRSTED
- PACIFIC GAS AND ELECTRIC COMPANY
- PATTERN ENERGY
- RENANTIS
- RENEW POWER
- ROCKY MOUNTAIN POWER
- RWE RENEWABLES
- RZK ENERGIA
- SCOTTISHPOWER
- SHELL
- SHIZEN ENERGY
- SIMPLY ENERGY
- SOLAR ALLIANCE
- SUNSEAP GROUP
- THE AES CORPORATION
- TORCH CLEAN ENERGY
- TOTALENERGIES
第22章 定量的サマリー
第23章 付録
List Of Exhibits
LIST OF EXHIBITS
Exhibit 1: Market Derivation
Exhibit 2: Data Center Sustainability Metrics
Exhibit 3: Exhibit 2 Average Annual PUE
Exhibit 4: Examples of Data Centers with a PUE <1.4
Exhibit 5: Leading Data Center Operators Part of the Climate Neutral Data Centre Pact
Exhibit 6: Incentives of Climate Neutral Data Centre Pact
Exhibit 7: Overview of RE100
Exhibit 8: Other Energy Certifications
Exhibit 9: Impact of Key Driving Factors 2022 & 2028
Exhibit 10: Structure of a Microgrid
Exhibit 11: Power Cost ($/kWh/month) across the cities
Exhibit 12: Sustainability Targets by Hyperscale Operators
Exhibit 13: Sustainability Targets by Colocation Operators
Exhibit 14: Existing Cloud Availability Zones of Different Cloud Service Providers
Exhibit 15: Planned Cloud Region by Several Cloud Operators
Exhibit 16: Data Center Energy & Power Consumption
Exhibit 17: Global Sustainable Data Center Market by Investment 2022-2028 ($ billion)
Exhibit 18: Global Sustainable Data Center Market by Power Capacity 2022-2028 (MW)
Exhibit 19: Global Sustainable Data Center Market by Infrastructure 2022-2028 ($ billion)
Exhibit 20: Market Snapshot by Infrastructure ($ billion)
Exhibit 21: Global Sustainable Data Center Market by Electrical Infrastructure 2022-2028 ($ billion)
Exhibit 22: Global Sustainable Data Center Market by Mechanical Infrastructure 2022-2028 ($ billion)
Exhibit 23: Global Sustainable Data Center Market by General Construction 2022-2028 ($ billion)
Exhibit 24: North America Sustainable Data Center Market Overview
Exhibit 25: Sustainable Data Center Market in North America by Investment 2022-2028 ($ billion)
Exhibit 26: North America Sustainable Data Center Market by Investment (2022)
Exhibit 27: North America Sustainable Data Center Market by Power Capacity (2022)
Exhibit 28: Sustainable Data Center Market in North America by Power Capacity 2022-2028 (MW)
Exhibit 29: Sustainable Data Center Market in North America by Support Infrastructure 2022-2028 ($ billion)
Exhibit 30: US Sustainable Data Center Market Overview
Exhibit 31: Split of Renewable Energy in the US (2022)
Exhibit 32: US Sustainable Data Center Market by Investment 2022-2028 ($ billion)
Exhibit 33: US Sustainable Data Center Market by Power Capacity 2022-2028 (MW)
Exhibit 34: Canada Sustainable Data Center Market Overview
Exhibit 35: Split of Renewable Energy in Canada (2022)
Exhibit 36: Canada Sustainable Data Center Market by Investment 2022-2028 ($ million)
Exhibit 37: Canada Sustainable Data Center Market by Power Capacity 2022-2028 (MW)
Exhibit 38: Latin America Sustainable Data Center Market Overview
Exhibit 39: Sustainable Data Center Market in Latin America by Investment 2022-2028 ($ million)
Exhibit 40: Latin America Sustainable Data Center Market by Investment (2022)
Exhibit 41: Sustainable Data Center Market in Latin America by Power Capacity 2022-2028 (MW)
Exhibit 42: Latin America Sustainable Data Center Market by Power Capacity (2022)
Exhibit 43: Sustainable Data Center Market in Latin America by Support Infrastructure 2022-2028 ($ million)
Exhibit 44: Brazil Sustainable Data Center Market Overview
Exhibit 45: Split of Renewable Energy in Brazil (2022)
Exhibit 46: Brazil Sustainable Data Center Market by Investment 2022-2028 ($ million)
Exhibit 47: Brazil Sustainable Data Center Market by Power Capacity 2022-2028 (MW)
Exhibit 48: Chile Sustainable Data Center Market Overview
Exhibit 49: Split of Renewable Energy in Chile (2022)
Exhibit 50: Chile Sustainable Data Center Market by Investment 2022-2028 ($ million)
Exhibit 51: Chile Sustainable Data Center Market by Power Capacity 2022-2028 (MW)
Exhibit 52: Mexico Sustainable Data Center Market Overview
Exhibit 53: Split of Renewable Energy in Mexico (2022)
Exhibit 54: Mexico Sustainable Data Center Market by Investment 2022-2028 ($ million)
Exhibit 55: Mexico Sustainable Data Center Market by Power Capacity 2022-2028 (MW)
Exhibit 56: Colombia Sustainable Data Center Market Overview
Exhibit 57: Split of Renewable Energy in Colombia (2022)
Exhibit 58: Colombia Sustainable Data Center Market by Investment 2022-2028 ($ million)
Exhibit 59: Colombia Sustainable Data Center Market by Power Capacity 2022-2028 (MW)
Exhibit 60: Rest of Latin America Sustainable Data Center Market Overview
Exhibit 61: Split of Renewable Energy in Argentina (2022)
Exhibit 62: Rest of Latin America Sustainable Data Center Market by Investment 2022-2028 ($ million)
Exhibit 63: Rest of Latin America Sustainable Data Center Market by Power Capacity 2022-2028 (MW)
Exhibit 64: Western Europe Sustainable Data Center Market Overview
Exhibit 65: Sustainable Data Center Market in Western Europe by Investment 2022-2028 ($ billion)
Exhibit 66: Western Europe Sustainable Data Center Market by Investment (2022)
Exhibit 67: Sustainable Data Center Market in Western Europe by Power Capacity 2022-2028 (MW)
Exhibit 68: Western Europe Sustainable Data Center Market by Power Capacity (2022)
Exhibit 69: Sustainable Data Center Market in Western Europe by Support Infrastructure 2022-2028 ($ million)
Exhibit 70: UK Sustainable Data Center Market Overview
Exhibit 71: Split of Renewable Energy in the UK (2022)
Exhibit 72: UK Sustainable Data Center Market by Investment 2022-2028 ($ million)
Exhibit 73: UK Sustainable Data Center Market by Power Capacity 2022-2028 (MW)
Exhibit 74: Germany Sustainable Data Center Market Overview
Exhibit 75: Split of Renewable Energy in Germany (2022)
Exhibit 76: Germany Sustainable Data Center Market by Investment 2022-2028 ($ million)
Exhibit 77: Germany Sustainable Data Center Market by Power Capacity 2022-2028 (MW)
Exhibit 78: France Sustainable Data Center Market Overview
Exhibit 79: Split of Renewable Energy in France (2022)
Exhibit 80: France Sustainable Data Center Market by Investment 2022-2028 ($ million)
Exhibit 81: France Sustainable Data Center Market by Power Capacity 2022-2028 (MW)
Exhibit 82: Netherlands Sustainable Data Center Market Overview
Exhibit 83: Split of Renewable Energy in the Netherlands (2022)
Exhibit 84: Netherlands Sustainable Data Center Market by Investment 2022-2028 ($ million)
Exhibit 85: Netherlands Sustainable Data Center Market by Power Capacity 2022-2028 (MW)
Exhibit 86: Ireland Sustainable Data Center Market Overview
Exhibit 87: Split of Renewable Energy in Ireland (2022)
Exhibit 88: Ireland Sustainable Data Center Market by Investment 2022-2028 ($ million)
Exhibit 89: Ireland Sustainable Data Center Market by Power Capacity 2022-2028 (MW)
Exhibit 90: Switzerland Sustainable Data Center Market Overview
Exhibit 91: Split of Renewable Energy in Switzerland (2022)
Exhibit 92: Switzerland Sustainable Data Center Market by Investment 2022-2028 ($ million)
Exhibit 93: Switzerland Sustainable Data Center Market by Power Capacity 2022-2028 (MW)
Exhibit 94: Other Western European Countries Sustainable Data Center Market Overview
Exhibit 95: Split of Renewable Energy in Spain (2022)
Exhibit 96: Other Western European Countries Sustainable Data Center Market by Investment 2022-2028 ($ million)
Exhibit 97: Other Western European Countries Sustainable Data Center Market by Power Capacity 2022-2028 (MW)
Exhibit 98: Nordics Sustainable Data Center Market Overview
Exhibit 99: Nordics Sustainable Data Center Market 2022-2028 ($ billion)
Exhibit 100: Nordics Sustainable Data Center Market by Investment (2022)
Exhibit 101: Sustainable Data Center Market in the Nordics by Power Capacity 2022-2028 (MW)
Exhibit 102: Nordics Sustainable Data Center Market by Power Capacity (2022)
Exhibit 103: Sustainable Data Center Market in the Nordics by Support Infrastructure 2022-2028 ($ million)
Exhibit 104: Sweden Sustainable Data Center Market Overview
Exhibit 105: Split of Renewable Energy in Sweden (2022)
Exhibit 106: Sweden Sustainable Data Center Market by Investment 2022-2028 ($ million)
Exhibit 107: Sweden Sustainable Data Center Market by Power Capacity 2022-2028 (MW)
Exhibit 108: Denmark Sustainable Data Center Market Overview
Exhibit 109: Split of Renewable Energy in Denmark (2022)
Exhibit 110: Denmark Sustainable Data Center Market by Investment 2022-2028 ($ million)
Exhibit 111: Denmark Sustainable Data Center Market by Power Capacity 2022-2028 (MW)
Exhibit 112: Norway Sustainable Data Center Market Overview
Exhibit 113: Split of Renewable Energy in Norway (2022)
Exhibit 114: Norway Sustainable Data Center Market by Investment 2022-2028 ($ million)
Exhibit 115: Norway Sustainable Data Center Market by Power Capacity 2022-2028 (MW)
Exhibit 116: Finland & Iceland Sustainable Data Center Market Overview
Exhibit 117: Split of Renewable Energy in Finland (2022)
Exhibit 118: Split of Renewable Energy in Iceland (2022)
Exhibit 119: Finland & Iceland Sustainable Data Center Market by Investment 2022-2028 ($ million)
Exhibit 120: Finland & Iceland Sustainable Data Center Market by Power Capacity 2022-2028 (MW)
Exhibit 121: Central & Eastern Europe Sustainable Data Center Market Overview
Exhibit 122: Sustainable Data Center Market in Central & Eastern Europe by Investment ($ million)
Exhibit 123: Central & Eastern Europe Sustainable Data Center Market by Investment (2022)
Exhibit 124: Sustainable Data Center Market in Central & Eastern Europe by Power Capacity 2022-2028 (MW)
Exhibit 125: Sustainable Data Center Market in Central & Eastern Europe by Power Capacity (2022)
Exhibit 126: Sustainable Data Center Market in Central & Eastern Europe by Support Infrastructure 2022-2028 ($ million)
Exhibit 127: Poland Sustainable Data Center Market Overview
Exhibit 128: Split of Renewable Energy for Poland (2022)
Exhibit 129: Poland Sustainable Data Center Market by Investment 2022-2028 ($ million)
Exhibit 130: Poland Sustainable Data Center Market by Power Capacity 2022-2028 (MW)
Exhibit 131: Other Central & Eastern European Countries Sustainable Data Center Market Overview
Exhibit 132: Split of Renewable Energy for Bulgaria (2022)
Exhibit 133: Split of Renewable Energy for Austria (2022)
Exhibit 134: Other Central & Eastern European Countries Sustainable Data Center Market by Investment 2022-2028 ($ million)
Exhibit 135: Other Central & Eastern European Countries Sustainable Data Center Market by Power Capacity 2022-2028 (MW)
Exhibit 136: Middle East Sustainable Data Center Market Overview
Exhibit 137: Sustainable Data Center Market in the Middle East by Investment 2022-2028 ($ million)
Exhibit 138: Middle East Sustainable Data Center Market by Investment (2022)
Exhibit 139: Sustainable Data Center Market in the Middle East by Power Capacity 2022-2028 (MW)
Exhibit 140: Middle East Sustainable Data Center Market by Power Capacity (2022)
Exhibit 141: Sustainable Data Center Market in the Middle East by Support Infrastructure 2022-2028 ($ million)
Exhibit 142: UAE Sustainable Data Center Market Overview
Exhibit 143: Split of Renewable Energy for the UAE (2022)
Exhibit 144: UAE Sustainable Data Center Market by Investment 2022-2028 ($ million)
Exhibit 145: UAE Sustainable Data Center Market by Power Capacity 2022-2028 (MW)
Exhibit 146: Saudi Arabia Sustainable Data Center Market Overview
Exhibit 147: Split of Renewable Energy for Saudi Arabia (2022)
Exhibit 148: Saudi Arabia Sustainable Data Center Market by Investment 2022-2028 ($ million)
Exhibit 149: Saudi Arabia Sustainable Data Center Market by Power Capacity 2022-2028 (MW)
Exhibit 150: Other Middle Eastern Countries Sustainable Data Center Market Overview
Exhibit 151: Split of Renewable Energy in Israel (2022)
Exhibit 152: Other Middle Eastern Countries Sustainable Data Center Market by Investment 2022-2028 ($ million)
Exhibit 153: Other Middle Eastern Countries Sustainable Data Center Market by Power Capacity 2022-2028 (MW)
Exhibit 154: Africa Sustainable Data Center Market Overview
Exhibit 155: Sustainable Data Center Market in Africa by Investment 2022-2028 ($ million)
Exhibit 156: Africa Sustainable Data Center Market by Investment (2022)
Exhibit 157: Sustainable Data Center Market in Africa by Power Capacity 2022-2028 (MW)
Exhibit 158: Africa Sustainable Data Center Market by Power Capacity (2022)
Exhibit 159: Sustainable Data Center Market in Africa by Support Infrastructure 2022-2028 ($ million)
Exhibit 160: South Africa Sustainable Data Center Market Overview
Exhibit 161: Split of Renewable Energy in South Africa (2022)
Exhibit 162: South Africa Sustainable Data Center Market by Investment 2022-2028 ($ million)
Exhibit 163: South Africa Sustainable Data Center Market by Power Capacity 2022-2028 (MW)
Exhibit 164: Other African Countries Sustainable Data Center Market Overview
Exhibit 165: Split of Renewable Energy in Kenya (2022)
Exhibit 166: Other African Countries Sustainable Data Center Market by Investment 2022-2028 ($ million)
Exhibit 167: Other African Countries Sustainable Data Center Market by Power Capacity 2022-2028 (MW)
Exhibit 168: APAC Sustainable Data Center Market Overview
Exhibit 169: Sustainable Data Center Market in APAC by Investment 2022-2028 ($ billion)
Exhibit 170: APAC Sustainable Data Center Market by Investment (2022)
Exhibit 171: Sustainable Data Center Market in APAC by Power Capacity 2022-2028 (MW)
Exhibit 172: APAC Sustainable Data Center Market by Power Capacity (2022)
Exhibit 173: Sustainable Data Center Market in APAC by Support Infrastructure 2022-2028 ($ billion)
Exhibit 174: China & Hong Kong Sustainable Data Center Market Overview
Exhibit 175: Split of Renewable Energy in China (2022)
Exhibit 176: China & Hong Kong Sustainable Data Center Market by Investment 2022-2028 ($ million)
Exhibit 177: China & Hong Kong Sustainable Data Center Market by Power Capacity 2022-2028 (MW)
Exhibit 178: Australia & New Zealand Sustainable Data Center Market Overview
Exhibit 179: Split of Renewable Energy in Australia (2022)
Exhibit 180: Split of Renewable Energy in New Zealand (2022)
Exhibit 181: Australia & New Zealand Sustainable Data Center Market by Investment 2022-2028 ($ million)
Exhibit 182: Australia & New Zealand Sustainable Data Center Market by Power Capacity 2022-2028 (MW)
Exhibit 183: India Sustainable Data Center Market Overview
Exhibit 184: Split of Renewable Energy in India (2022)
Exhibit 185: India Sustainable Data Center Market by Investment 2022-2028 ($ million)
Exhibit 186: India Sustainable Data Center Market by Power Capacity 2022-2028 (MW)
Exhibit 187: Japan Sustainable Data Center Market Overview
Exhibit 188: Split of Renewable Energy in Japan (2022)
Exhibit 189: Japan Sustainable Data Center Market by Investment 2022-2028 ($ million)
Exhibit 190: Japan Sustainable Data Center Market by Power Capacity 2022-2028 (MW)
Exhibit 191: South Korea Sustainable Data Center Market Overview
Exhibit 192: Split of Renewable Energy in South Korea (2022)
Exhibit 193: South Korea Sustainable Data Center Market by Investment 2022-2028 ($ million)
Exhibit 194: South Korea Sustainable Data Center Market by Power Capacity 2022-2028 (MW)
Exhibit 195: Rest of APAC Sustainable Data Center Market Overview
Exhibit 196: Rest of APAC Sustainable Data Center Market by Investment 2022-2028 ($ million)
Exhibit 197: Rest of APAC Sustainable Data Center Market by Power Capacity 2022-2028 (MW)
Exhibit 198: Southeast Asia Sustainable Data Center Market Overview
Exhibit 199: Sustainable Data Center Market in Southeast Asia by Investment 2022-2028 ($ million)
Exhibit 200: Southeast Asia Sustainable Data Center Market by Investment (2022)
Exhibit 201: Sustainable Data Center Market in Southeast Asia by Power Capacity 2022-2028 (MW)
Exhibit 202: Southeast Asia Sustainable Data Center Market by Power Capacity (2022)
Exhibit 203: Sustainable Data Center Market in Southeast Asia by Support Infrastructure 2022-2028 ($ million)
Exhibit 204: Singapore Sustainable Data Center Market Overview
Exhibit 205: Split of Renewable Energy in Singapore (2022)
Exhibit 206: Singapore Sustainable Data Center Market by Investment 2022-2028 ($ million)
Exhibit 207: Singapore Sustainable Data Center Market by Power Capacity 2022-2028 (MW)
Exhibit 208: Indonesia Sustainable Data Center Market Overview
Exhibit 209: Split of Renewable Energy in Indonesia (2022)
Exhibit 210: Indonesia Sustainable Data Center Market by Investment 2022-2028 ($ million)
Exhibit 211: Indonesia Sustainable Data Center Market by Power Capacity 2022-2028 (MW)
Exhibit 212: Malaysia Sustainable Data Center Market Overview
Exhibit 213: Split of Renewable Energy in Malaysia (2022)
Exhibit 214: Malaysia Sustainable Data Center Market by Investment 2022-2028 ($ million)
Exhibit 215: Malaysia Sustainable Data Center Market by Power Capacity 2022-2028 (MW)
Exhibit 216: Other Southeast Asian Countries Sustainable Data Center Market Overview
Exhibit 217: Split of Renewable Energy in Vietnam (2022)
Exhibit 218: Other Southeast Asian Countries Sustainable Data Center Market by Investment 2022-2028 ($ million)
Exhibit 219: Other Southeast Asian Countries Sustainable Data Center Market by Power Capacity 2022-2028 (MW)
List Of Tables
LIST OF TABLES
Table 1: According to Sunbird, Features That Make a Data Center Sustainable are as Follows:
Table 2: Lithium-ion Vs. VRLA Batteries
Table 3: List of Some of the Data Centers Targeting PUE <1.5
Table 4: Market by Investments in North America ($ million)
Table 5: Market by Power Capacity in North America (MW)
Table 6: Market by Support Infrastructure in North America ($ billion)
Table 7: Market by Investment in Latin America ($ million)
Table 8: Market by Power Capacity in Latin America (MW)
Table 9: Market by Support Infrastructure in Latin America ($ billion)
Table 10: Market by Investments in Western Europe ($ million)
Table 11: Market by Power Capacity in Western Europe (MW)
Table 12: Market by Support Infrastructure in Western Europe ($ million)
Table 13: Market by Investments in the Nordics ($ million)
Table 14: Market by Power Capacity in the Nordics (MW)
Table 15: Market by Support Infrastructure in the Nordics ($ million)
Table 16: Market by Investments in Central & Eastern Europe ($ million)
Table 17: Market by Power Capacity in Central & Eastern Europe (MW)
Table 18: Market by Support Infrastructure in Central & Eastern Europe ($ billion)
Table 19: Market by Investments in the Middle East ($ million)
Table 20: Market by Power Capacity in the Middle East (MW)
Table 21: Market by Support Infrastructure in the Middle East ($ billion)
Table 22: Market by Investment in Africa ($ million)
Table 23: Market by Power Capacity in Africa (MW)
Table 24: Market by Support Infrastructure in Africa ($ billion)
Table 25: Market by Investments in APAC ($ million)
Table 26: Market by Power Capacity in APAC (MW)
Table 27: Market by Support Infrastructure in APAC ($ billion)
Table 28: Market by Investments in Southeast Asia ($ million)
Table 29: Market by Power Capacity in Southeast Asia (MW)
Table 30: Market by Support Infrastructure in Southeast Asia ($ billion)
Table 31: Global Sustainable Data Center Market 2022-2028
Table 32: Global Sustainable Data Center Market by Infrastructure 2022-2028 ($ billion)
Table 33: Global Sustainable Data Center Market by Geography 2022-2028 ($ billion)
Table 34: Global Sustainable Data Center Market by Power Capacity 2022-2028 (MW)
Table 35: North America Sustainable Data Center Market 2022-2028
Table 36: North America Sustainable Data Center Market by Infrastructure 2022-2028 ($ billion)
Table 37: US Sustainable Data Center Market 2022-2028
Table 38: Canada Sustainable Data Center Market 2022-2028
Table 39: Latin America Sustainable Data Center Market 2022-2028
Table 40: Latin America Sustainable Data Center Market by Infrastructure 2022-2028 ($ billion)
Table 41: Brazil Sustainable Data Center Market 2022-2028
Table 42: Chile Sustainable Data Center Market 2022-2028
Table 43: Mexico Sustainable Data Center Market 2022-2028
Table 44: Colombia Sustainable Data Center Market 2022-2028
Table 45: Rest of Latin America Sustainable Data Center Market 2022-2028
Table 46: Western Europe Sustainable Data Center Market 2022-2028
Table 47: Western Europe Sustainable Data Center Market by Infrastructure 2022-2028 ($ billion)
Table 48: UK Sustainable Data Center Market 2022-2028
Table 49: Germany Sustainable Data Center Market 2022-2028
Table 50: France Sustainable Data Center Market 2022-2028
Table 51: Netherlands Sustainable Data Center Market 2022-2028
Table 52: Ireland Sustainable Data Center Market 2022-2028
Table 53: Switzerland Sustainable Data Center Market 2022-2028
Table 54: Other Western European Nations Sustainable Data Center Market 2022-2028
Table 55: Nordics Sustainable Data Center Market 2022-2028
Table 56: Nordics Sustainable Data Center Market by Infrastructure 2022-2028 ($ billion)
Table 57: Sweden Sustainable Data Center Market 2022-2028
Table 58: Denmark Sustainable Data Center Market 2022-2028
Table 59: Norway Sustainable Data Center Market 2022-2028
Table 60: Finland & Iceland Sustainable Data Center Market 2022-2028
Table 61: Central & Eastern Europe Sustainable Data Center Market 2022-2028
Table 62: Central & Eastern Europe Sustainable Data Center Market by Infrastructure 2022-2028 ($ billion)
Table 63: Poland Sustainable Data Center Market 2022-2028
Table 64: Other Central & Eastern European Countries Sustainable Data Center Market 2022-2028
Table 65: Middle East Sustainable Data Center Market 2022-2028
Table 66: Middle East Sustainable Data Center Market by Infrastructure 2022-2028 ($ billion)
Table 67: UAE Sustainable Data Center Market 2022-2028
Table 68: Saudi Arabia Sustainable Data Center Market 2022-2028
Table 69: Other Middle Eastern Countries Sustainable Data Center Market 2022-2028
Table 70: Africa Sustainable Data Center Market 2022-2028
Table 71: Africa Sustainable Data Center Market by Infrastructure 2022-2028 ($ billion)
Table 72: South Africa Sustainable Data Center Market 2022-2028
Table 73: Other African Countries Sustainable Data Center Market 2022-2028
Table 74: APAC Sustainable Data Center Market 2022-2028
Table 75: APAC Sustainable Data Center Market by Infrastructure 2022-2028 ($ billion)
Table 76: China & Hong Kong Sustainable Data Center Market 2022-2028
Table 77: Australia & New Zealand Sustainable Data Center Market 2022-2028
Table 78: India Sustainable Data Center Market 2022-2028
Table 79: Japan Sustainable Data Center Market 2022-2028
Table 80: South Korea Sustainable Data Center Market 2022-2028
Table 81: Rest of APAC Sustainable Data Center Market 2022-2028
Table 82: Southeast Asia Sustainable Data Center Market 2022-2028
Table 83: Southeast Asia Sustainable Data Center Market by Infrastructure 2022-2028 ($ billion)
Table 84: Singapore Sustainable Data Center Market 2022-2028
Table 85: Indonesia Sustainable Data Center Market 2022-2028
Table 86: Malaysia Sustainable Data Center Market 2022-2028
Table 87: Other Southeast Asian Countries Sustainable Data Center Market 2022-2028
Table 88: Currency Conversion Table (2015-2022)
The global sustainable data center market by investment was valued at USD 31.25 billion in 2022 and is expected to grow at a CAGR of 9.72% from 2022-2028.
KEY HIGHLIGHTS
- Policy drivers and regulations such as The Paris Agreement, the RE100, and certifications such as Leadership in Energy and Environmental Design (LEED) and ISO50001 drive Latin America's green data center development market.
- The Climate Neutral Data Centre Pact has played a significant role in increasing the sustainability of European data centers, as all signatories will be relying on renewable energy for their facilities by 2030.
- APAC data centers seek green certifications like LEED (Leadership in Energy and Environmental Design) and BCA Green Mark to showcase their commitment to sustainability.
KEY MARKET TRENDS
Increased Focus On Renewable Energy Sources and Efficient Cooling
- Hyperscale players such as AWS, Google, Facebook (Meta), Microsoft, and Apple are procuring renewable energy for their data centers.
- QTS Realty Trust meets 35% of its energy requirements from renewable energy with a target of 100% renewable energy by 2025.
- Free cooling chillers will increase to reduce power consumption and carbon emissions by data centers. Also, the shift will increase towards liquid cooling, leading to more sustainable data centers and bringing down PUE to a range of 1.1 to 1.4.
- Air and liquid immersion cooling will also be used in most facilities in the sustainable data center market to reduce their impact on the environment and the PUE of data centers.
- A tropical test bed is being tested in Singapore to make data centers more efficient in a tropical climate. If successful, this can also positively impact the Latin American market and further reduce the PUE of facilities.
Emerging Trends to Power Data Centers
- Hydrotreated Vegetable Oil (HVO) Fuel is among the emerging trends concept in the sustainable data center market; however, in Latin America, data center operators didn't adopt this technology, but there is a development from some of the oil companies that are involved in the development of the HVO fuel stations, wherein it is witnessed that during the forecast period at least some operators will introduce HVO in their facilities.
- Microgrids can be adopted by data center operators functioning in regions with an uncertain power supply due to natural disasters and power fluctuations.
- Modern UPS systems are being innovated to be modular and occupy less space in facilities. It is expected that with a significant increase in data being generated and stored, low tolerance for downtime, and need for sustainability, lithium-ion adoption will increase significantly.
Government Push Toward Sustainability
- The US Department of Energy announced a USD 42 million fund under the Advanced Research Projects Agency-Energy (ARPA-E) project to fund suitable companies working in high-performance energy-efficient cooling solutions for data centers.
- Various Latin American governments, including those of Chile, Brazil, and Uruguay, are actively working toward increasing the adoption of renewable energy in the country, which is projected to support sustainable data center market growth.
- The European Union is continuously working toward making energy consumption completely green with new laws and regulations. In recent meetings, the European Union decided to increase renewable energy share in the energy mix to more than 40% by 2030.
- Carbon neutrality is a priority in the Middle East & Africa as governments invest heavily in renewable energy and climate mitigation programs to achieve it. However, research on carbon neutrality in the region is limited, particularly considering the effects of renewable energy, economic growth, and government efficacy.
- The Middle East & Africa is one of the most vulnerable to climate change, with harsh temperatures, deserts, coastal ecosystems, and high levels of air pollution. As a result, the region is expected to take the lead in climate mitigation and adaptation efforts.
- Given the growing concern about the APAC region's electronic trash (e-waste), authorities may implement measures encouraging the appropriate disposal and recycling of obsolete data center equipment to reduce environmental impacts.
Deployment of Modular Data Centers and Sustainable Materials Gathering Momentum
- In North America and other regions across the globe, modular data centers are small, portable groups of components needed to supply data center capacities such as servers, networking environment, and storage. Modular data centers are great substitutes for traditional data centers. It is highly predictable, efficient, and flexible.
- The cost of operating a modular data center costs around 30% less than a traditional data center facility.
- The environmental impact of modular data center deployment is also lower since it entails less or no usage of concrete and can be constructed in a phased manner, eliminating the need for additional labor.
- Plant-based and other sustainable materials such as wood, hemp, and Mycelium, which can revolutionize the construction process for data centers, are also being adopted by data center operators.
- Modular data centers worldwide have shown themselves to be especially well-suited for scenarios prioritizing company flexibility, accelerated market entrance, or fulfilling unique operational objectives.
SEGMENTATION INSIGHTS
A large data center with 100 racks and rack power density of 35 kW will have approximately 30.7 million kW/year of energy used over a year. With a 10% reduction that it will generate by using newer components and servers, the data center can save up to 3.1 million kW. The reduction will also help the data center operators reduce the OPEX due to reduced power bills and a significant reduction in GHG emissions.
Electrical Infrastructure
- Efficient and sustainable power infrastructure replacing traditional power systems supports sustainable data center market growth.
- The increasing demand for efficiency in data centers has fueled the growth of efficient infrastructure such as Lithium-ion UPS systems, fuel cells, HVO, natural gas generators, nuclear energy reactors, and more.
- Rolls Royce announced its plan to offer small nuclear reactors for US-based cloud operators such as AWS, Google, and Microsoft.
- AWS will use HVO across all of its European data centers. It has already replaced diesel with HVO in Ireland.
Mechanical Infrastructure
- Most companies have deployed free and zero-water cooling, leveraging the cold temperature across the regions.
- In its Stockholm-based STO01 data center in Sweden, STACK Infrastructure has deployed indirect evaporative cooling for energy efficiency.
- Innovative cooling techniques, such as underwater and floating data centers, bring in more efficiency in data center cooling.
- Nautilus Data Technologies, which builds sustainable and floating data centers, has signed leases for a new 7.5 MW data center in Marseille, France.
- Denv-R announced plans to launch floating data center facilities, which will be cooled by river water to decrease energy consumption and CO2 emissions.
General Construction
- Hyperscale operators such as AWS, Microsoft, Apple, and Google are leading in using sustainable materials for data center construction, propelling the sustainable data center market.
- Companies introduce technologies such as green concrete, modular data centers, and more in their data center construction.
- AWS and American Rock Products collaborated to develop sustainable concrete for a concrete mix for its data centers.
- Companies are investing in additional infrastructure like Aquifer Thermal Storage Systems to conserve heat.
- District heating is prevalent in Europe, where data center firms transfer heat generated from data centers to nearby offices/residential places/swimming pools, and others.
- Nordic countries are leading in developing district heating with data center firms.
GEOGRAPHICAL ANALYSIS
Western Europe and the Nordics Lead the Race for Renewable Energy Adoption
- North America, Nordic countries, Singapore, Germany, Netherlands, and Switzerland are using over 90% of renewable energy in their operations.
- APAC countries, other Western European Countries, and the UAE work at 60% - 70% of renewable energy in data centers.
- African countries, other LATAM countries, other Middle Eastern countries, and Southeast Asian countries, excluding Singapore, utilize 30% -40 % of renewable energy in data centers.
Segmentation by Geography
- North America
- The U.S.
- Canada
- Latin America
- Brazil
- Chile
- Mexico
- Colombia
- Rest of Latin America
- Western Europe
- UK
- Germany
- France
- Netherlands
- Ireland
- Switzerland
- Other Western European Countries
- Nordics
- Sweden
- Denmark
- Norway
- Finland & Iceland
- Central & Eastern Europe
- Poland
- Other Central & Eastern European Countries
- Middle East
- UAE
- Saudi Arabia
- Other Middle Eastern Countries
- Africa
- South Africa
- Other African Countries
- APAC
- China & Hong Kong
- Australia & New Zealand
- India
- Japan
- South Korea
- Rest of APAC
- Southeast Asia
- Singapore
- Indonesia
- Malaysia
- Other Southeast Asian Countries
VENDOR LANDSCAPE
Large-Scale Colocation and Hyperscale Data Center Operators Driving the Sustainable Data Center Market
- In North America, colocation vendors such as Equinix, Digital Realty, QTS Realty Trust, Vantage Data Centers, CyrusOne, Compass Datacenters, and hyperscale vendors such as Microsoft, AWS, Google, Apple, Meta, and others are adopting lithium-ion UPS systems, Microgrid systems, Smart-grid systems, and many newer support systems supporting the sustainable data center market growth.
- Companies such as Eaton, Vertiv, Schneider Electric, and many others are supplying lithium-ion-based UPS systems, smart-grid solutions, and new switchgears compatible with different sources of power supplies.
Key Company Profiles
- Africa Data Centres
- Airtel (Nxtra Data)
- AirTrunk
- Alibaba Cloud
- Aligned Data Centers
- Amazon Web Services (AWS)
- American Tower
- Apple
- AQ Compute
- Atman
- atNorth
- Big Data Exchange (BDx)
- CDC Data Centres
- Chayora
- China Telecom
- Chindata Group
- CloudHQ
- Cologix
- Colt Data Centre Services (COLT DCS)
- Corscale Data Centers
- Compass Datacenters
- CtrlS Datacenters
- CyrusOne
- Cyxtera Technologies
- Data4 Group
- DataBank
- Digital Edge DC
- Digital Realty
- EdgeConneX
- Equinix
- Flexential
- GDS Services
- Global Switch
- Green Mountain (AZRIELI GROUP)
- GreenSquareDC
- Gulf Data Hub
- HostDime
- Huawei Technologies
- Iron Mountain
- IXAfrica
- Keppel Data Centres
- Khazna Data Centers
- KIO Networks
- Kao Data
- Lumen Technologies (Cirion Technologies)
- Meta
- Microsoft
- Moro Hub
- Nautilus Data Technologies
- Netia
- NEXTDC
- NTT Global Data Centers
- Novva Data Centers
- OneAsia Network
- Oracle
- Orange Business Services
- OVHcloud
- Penta Infra
- Princeton Digital Group
- QTS Realty Trust
- RackBank
- Raxio Group
- Rostelecom Data Centers
- Sabey Data Centers
- Scala Data Centers
- Serverfarm
- Sify Technologies
- SpaceDC
- STACK Infrastructure
- ST Telemedia Global Data Centres
- SUNeVision Holdings
- Switch
- T5 Data Centers
- Telehouse
- Tencent Cloud
- Tenglong Holdings Group
- Vantage Data Centers
- VNET Group
- Yandex
- Yondr
- Yotta Infrastructure
Renewable Energy Providers
- ACCONIA Energia
- Adani Green Energy (AGEL)
- AGL
- Algonquin Power & Utilities Corp.
- AMP Energy
- Apex Clean Energy
- Avaada Energy
- Better Energy
- Bryt Energy
- Conrad Energy
- Datafarm Energy
- DE Shaw Renewable Investments
- Distributed Power Technologies
- Dominion Energy
- EDF Renewables
- Eneco
- Enel Group
- Engie
- ERG
- Faro Energy
- GreenYellow
- HDF Energy
- Iberdrola
- Ilmatar Energy
- Leeward Renewable Energy
- Lightsource bp
- MC Retail Energy
- MP2 Energy
- Neoen
- NextEra Energy
- NTR
- Ørsted
- Pacific Gas and Electric Company
- Pattern Energy
- Renantis
- ReNew Power
- Rocky Mountain Power
- RWE Renewables
- RZK Energia
- ScottishPower
- Shell
- Shizen Energy
- Simply Energy
- Solar Alliance
- Sunseap Group
- The AES Corporation
- Torch Clean Energy
- TotalEnergies
KEY QUESTIONS ANSWERED:
1. How big is the sustainable data center market?
2. What is the growth rate of the global sustainable data center market?
3. What are the key trends in the sustainable data center market?
4. Which region holds the most significant global sustainable data center market share?
5. How many MW of power capacity is expected to reach the sustainable data center market by 2028?
TABLE OF CONTENTS
1. REPORT COVERAGE
- 1.1. WHAT'S INCLUDED
- 1.2. SEGMENTAL COVERAGE
- 1.2.1. Market Segmentation by Infrastructure
- 1.2.2. Market Segmentation by Geography
2. MARKET AT A GLANCE
3. PREMIUM INSIGHTS
- 3.1. KEY HIGHLIGHTS
- 3.2. KEY MARKET TRENDS
- 3.3. GEOGRAPHICAL ANALYSIS
- 3.4. SEGMENTAL ANALYSIS
- 3.5. VENDOR ANALYSIS
4. INTRODUCTION
- 4.1. MARKET OVERVIEW
- 4.1.1. Sustainable Data Center Metrics
- 4.2. POWER USAGE EFFECTIVENESS (PUE)
- 4.2.1. KEY
- 4.3. POLICY DRIVERS
- 4.3.1. The Paris Agreement & The Science Based Targets Initiative (SBTi)
- 4.3.2. Climate Neutral Data Centre Pact
- 4.3.3. Long Duration Energy Storage (LDES) Council
- 4.3.4. RE100
- 4.4. ENERGY CERTIFICATIONS
5. MARKET OPPORTUNITIES & TRENDS
- 5.1. INNOVATIVE DATA CENTER POWER TECHNOLOGIES
- 5.1.1. Adoption of Advanced UPS Batteries
- 5.1.2. Software-Defined Data Centers & AI in Power Monitoring
- 5.1.3. Microgrids
- 5.2. SUSTAINABLE INNOVATIONS IN DATA CENTER POWER TECHNOLOGY
- 5.2.1. EcoDiesel Generators
- 5.2.2. Natural Gas Generators
- 5.2.3. Fuel Cells
- 5.2.4. Hydrotreated Vegetable Oil (HVO) Fuel
- 5.2.5. Nuclear Energy Generation
- 5.2.6. Other Innovations
- 5.3. INNOVATIVE DATA CENTER COOLING TECHNOLOGIES
- 5.3.1. Free Cooling
- 5.3.2. Underwater Data Centers
- 5.3.3. Floating Data Centers
- 5.3.4. Other Innovative Cooling Technologies
- 5.4. AI & HPC APPLICATIONS BOOSTING LIQUID IMMERSION & DIRECT-TO-CHIP COOLING ADOPTION
- 5.5. INCREASING ADOPTION OF DISTRICT HEATING CONCEPT
- 5.6. INCREASE IN INDUSTRIAL ELECTRICITY PRICING
- 5.7. GROWTH IN DATA CENTERS TARGETING PUE <1.5
- 5.8. ADOPTION OF ADVANCED IT INFRASTRUCTURE
- 5.8.1. Converged & Hyperconverged Infrastructure
- 5.8.2. ARM-based Servers
- 5.8.3. Server Virtualization
- 5.9. GOVERNMENT PUSH FOR SUSTAINABLE DATA CENTER DEVELOPMENT
6. MARKET GROWTH ENABLERS
- 6.1. RENEWABLE ENERGY INITIATIVES BY HYPERSCALE & CLOUD OPERATORS
- 6.2. RENEWABLE ENERGY INITIATIVES BY COLOCATION & ENTERPRISE OPERATORS
- 6.3. GROWING CLOUD SERVICES ADOPTION
- 6.4. AUTOMATION & INTELLIGENT MONITORING SOLUTIONS
- 6.5. DEPLOYMENT OF MODULAR DATA CENTERS & GENSETS
7. MARKET RESTRAINTS
- 7.1. RISING CARBON EMISSIONS FROM DATA CENTERS
- 7.2. WATER CONSUMPTION BY DATA CENTERS
- 7.3. LACK OF SKILLED DATA CENTER PROFESSIONALS
- 7.4. LOCATION CONSTRAINTS FOR SUSTAINABLE DATA CENTERS
8. MARKET LANDSCAPE
- 8.1. MARKET OVERVIEW
- 8.2. INVESTMENT: MARKET SIZE & FORECAST
- 8.3. POWER CAPACITY: MARKET SIZE & FORECAST
- 8.4. INFRASTRUCTURE: MARKET SIZE & FORECAST
9. INFRASTRUCTURE
- 9.1. MARKET SNAPSHOT
- 9.2. KEY HIGHLIGHTS
- 9.3. ELECTRICAL INFRASTRUCTURE
- 9.3.1. Market Overview
- 9.3.2. Investment: Market Size & Forecast
- 9.4. MECHANICAL INFRASTRUCTURE
- 9.4.1. Market Overview
- 9.4.2. Investment: Market Size & Forecast
- 9.5. GENERAL CONSTRUCTION
- 9.5.1. Market Overview
- 9.5.2. Investment: Market Size & Forecast
10. NORTH AMERICA
- 10.1. Market Overview
- 10.2. Investment: Market Size & Forecast
- 10.3. Power Capacity: Market Size & Forecast
- 10.4. Market by Support Infrastructure
- 10.5. US
- 10.5.1. Market Overview
- 10.5.2. Investment: Market Size & Forecast
- 10.5.3. Power Capacity: Market Size & Forecast
- 10.6. CANADA
- 10.6.1. Market Overview
- 10.6.2. Investment: Market Size & Forecast
- 10.6.3. Power Capacity: Market Size & Forecast
11. LATIN AMERICA
- 11.1. Market Overview
- 11.2. Investment: Market Size & Forecast
- 11.3. Power Capacity: Market Size & Forecast
- 11.4. Market by Support Infrastructure
- 11.5. BRAZIL
- 11.5.1. Market Overview
- 11.5.2. Investment: Market Size & Forecast
- 11.5.3. Power Capacity: Market Size & Forecast
- 11.6. CHILE
- 11.6.1. Market Overview
- 11.6.2. Investment: Market Size & Forecast
- 11.6.3. Power Capacity: Market Size & Forecast
- 11.7. MEXICO
- 11.7.1. Market Overview
- 11.7.2. Investment: Market Size & Forecast
- 11.7.3. Power Capacity: Market Size & Forecast
- 11.8. COLOMBIA
- 11.8.1. Market Overview
- 11.8.2. Investment: Market Size & Forecast
- 11.8.3. Power Capacity: Market Size & Forecast
- 11.9. REST OF LATIN AMERICA
- 11.9.1. Market Overview
- 11.9.2. Investment: Market Size & Forecast
- 11.9.3. Power Capacity: Market Size & Forecast
12. WESTERN EUROPE
- 12.1. Market Overview
- 12.2. Investment: Market Size & Forecast
- 12.3. Power Capacity: Market Size & Forecast
- 12.4. Market by Support Infrastructure
- 12.5. UK
- 12.5.1. Market Overview
- 12.5.2. Investment: Market Size & Forecast
- 12.5.3. Power Capacity: Market Size & Forecast
- 12.6. GERMANY
- 12.6.1. Market Overview
- 12.6.2. Investment: Market Size & Forecast
- 12.6.3. Power Capacity: Market Size & Forecast
- 12.7. FRANCE
- 12.7.1. Market Overview
- 12.7.2. Investment: Market Size & Forecast
- 12.7.3. Power Capacity: Market Size & Forecast
- 12.8. NETHERLANDS
- 12.8.1. Market Overview
- 12.8.2. Investment: Market Size & Forecast
- 12.8.3. Power Capacity: Market Size & Forecast
- 12.9. IRELAND
- 12.9.1. Market Overview
- 12.9.2. Investment: Market Size & Forecast
- 12.9.3. Power Capacity: Market Size & Forecast
- 12.10. SWITZERLAND
- 12.10.1. Market Overview
- 12.10.2. Investment: Market Size & Forecast
- 12.10.3. Power Capacity: Market Size & Forecast
- 12.11. OTHER WESTERN EUROPEAN COUNTRIES
- 12.11.1. Market Overview
- 12.11.2. Investment: Market Size & Forecast
- 12.11.3. Power Capacity: Market Size & Forecast
13. NORDICS
- 13.1. Market Overview
- 13.2. Investment: Market Size & Forecast
- 13.3. Power Capacity: Market Size & Forecast
- 13.4. Market by Support Infrastructure
- 13.5. SWEDEN
- 13.5.1. Market Overview
- 13.5.2. Investment: Market Size & Forecast
- 13.5.3. Power Capacity: Market Size & Forecast
- 13.6. DENMARK
- 13.6.1. Market Overview
- 13.6.2. Investment: Market Size & Forecast
- 13.6.3. Power Capacity: Market Size & Forecast
- 13.7. NORWAY
- 13.7.1. Market Overview
- 13.7.2. Investment: Market Size & Forecast
- 13.7.3. Power Capacity: Market Size & Forecast
- 13.8. FINLAND & ICELAND
- 13.8.1. Market Overview
- 13.8.2. Investment: Market Size & Forecast
- 13.8.3. Power Capacity: Market Size & Forecast
14. CENTRAL & EASTERN EUROPE
- 14.1. Market Overview
- 14.2. Investment: Market Size & Forecast
- 14.3. Power Capacity: Market Size & Forecast
- 14.4. Market by Support Infrastructure
- 14.5. POLAND
- 14.5.1. Market Overview
- 14.5.2. Investment: Market Size & Forecast
- 14.5.3. Power Capacity: Market Size & Forecast
- 14.6. OTHER CENTRAL & EASTERN EUROPEAN COUNTRIES
- 14.6.1. Market Overview
- 14.6.2. Investment: Market Size & Forecast
- 14.6.3. Power Capacity: Market Size & Forecast
15. MIDDLE EAST
- 15.1. Market Overview
- 15.2. Investment: Market Size & Forecast
- 15.3. Power Capacity: Market Size & Forecast
- 15.4. Market by Support Infrastructure
- 15.5. UAE
- 15.5.1. Market Overview
- 15.5.2. Investment: Market Size & Forecast
- 15.5.3. Power Capacity: Market Size & Forecast
- 15.6. SAUDI ARABIA
- 15.6.1. Market Overview
- 15.6.2. Investment: Market Size & Forecast
- 15.6.3. Power Capacity: Market Size & Forecast
- 15.7. OTHER MIDDLE EASTERN COUNTRIES
- 15.7.1. Market Overview
- 15.7.2. Investment: Market Size & Forecast
- 15.7.3. Power Capacity: Market Size & Forecast
16. AFRICA
- 16.1. Market Overview
- 16.2. Investment: Market Size & Forecast
- 16.3. Power Capacity: Market Size & Forecast
- 16.4. Market by Support Infrastructure
- 16.5. SOUTH AFRICA
- 16.5.1. Market Overview
- 16.5.2. Investment: Market Size & Forecast
- 16.5.3. Power Capacity: Market Size & Forecast
- 16.6. OTHER AFRICAN COUNTRIES
- 16.6.1. Market Overview
- 16.6.2. Investment: Market Size & Forecast
- 16.6.3. Power Capacity: Market Size & Forecast
17. APAC
- 17.1. Market Overview
- 17.2. Investment: Market Size & Forecast
- 17.3. Power Capacity: Market Size & Forecast
- 17.4. Market by Support Infrastructure
- 17.5. CHINA & HONG KONG
- 17.5.1. Market Overview
- 17.5.2. Investment: Market Size & Forecast
- 17.5.3. Power Capacity: Market Size & Forecast
- 17.6. AUSTRALIA & NEW ZEALAND
- 17.6.1. Market Overview
- 17.6.2. Investment: Market Size & Forecast
- 17.6.3. Power Capacity: Market Size & Forecast
- 17.7. INDIA
- 17.7.1. Market Overview
- 17.7.2. Investment: Market Size & Forecast
- 17.7.3. Power Capacity: Market Size & Forecast
- 17.8. JAPAN
- 17.8.1. Market Overview
- 17.8.2. Investment: Market Size & Forecast
- 17.8.3. Power Capacity: Market Size & Forecast
- 17.9. SOUTH KOREA
- 17.9.1. Market Overview
- 17.9.2. Investment: Market Size & Forecast
- 17.9.3. Power Capacity: Market Size & Forecast
- 17.10. REST OF APAC
- 17.10.1. Market Overview
- 17.10.2. Investment: Market Size & Forecast
- 17.10.3. Power Capacity: Market Size & Forecast
18. SOUTHEAST ASIA
- 18.1. Market Overview
- 18.2. Investment: Market Size & Forecast
- 18.3. Power Capacity: Market Size & Forecast
- 18.4. Market by Support Infrastructure
- 18.5. SINGAPORE
- 18.5.1. Market Overview
- 18.5.2. Investment: Market Size & Forecast
- 18.5.3. Power Capacity: Market Size & Forecast
- 18.6. INDONESIA
- 18.6.1. Market Overview
- 18.6.2. Investment: Market Size & Forecast
- 18.6.3. Power Capacity: Market Size & Forecast
- 18.7. MALAYSIA
- 18.7.1. Market Overview
- 18.7.2. Investment: Market Size & Forecast
- 18.7.3. Power Capacity: Market Size & Forecast
- 18.8. OTHER SOUTHEAST ASIAN COUNTRIES
- 18.8.1. Market Overview
- 18.8.2. Investment: Market Size & Forecast
- 18.8.3. Power Capacity: Market Size & Forecast
19. COMPETITIVE LANDSCAPE
- 19.1. DATA CENTER INVESTORS
- 19.2. RENEWABLE ENERGY PROVIDERS
20. KEY COMPANY PROFILES
- 20.1. AFRICA DATA CENTRES
- 20.1.1. Business Overview
- 20.1.2. Service Offerings
- 20.1.3. Sustainability
- 20.2. AIRTEL (NXTRA DATA)
- 20.2.1. Business Overview
- 20.2.2. Service Offerings
- 20.2.3. Sustainability
- 20.3. AIRTRUNK
- 20.3.1. Business Overview
- 20.3.2. Service Offerings
- 20.3.3. Sustainability
- 20.4. ALIBABA
- 20.4.1. Business Overview
- 20.4.2. Service Offerings
- 20.4.3. Sustainability
- 20.5. ALIGNED DATA CENTERS
- 20.5.1. Business Overview
- 20.5.2. Service Offerings
- 20.5.3. Sustainability
- 20.6. AMAZON WEB SERVICES (AWS)
- 20.6.1. Business Overview
- 20.6.2. Service Offerings
- 20.6.3. Sustainability
- 20.7. AMERICAN TOWER
- 20.7.1. Business Overview
- 20.7.2. Service Offerings
- 20.7.3. Sustainability
- 20.8. APPLE
- 20.8.1. Business Overview
- 20.8.2. Service Offerings
- 20.8.3. Sustainability
- 20.9. AQ COMPUTE
- 20.9.1. Business Overview
- 20.9.2. Service Offerings
- 20.10. ATMAN
- 20.10.1. Business Overview
- 20.10.2. Service Offerings
- 20.10.3. Sustainability
- 20.11. ATNORTH
- 20.11.1. Business Overview
- 20.11.2. Service Offerings
- 20.11.3. Sustainability
- 20.12. BIG DATA EXCHANGE (BDX)
- 20.12.1. Business Overview
- 20.12.2. Service Offerings
- 20.13. CDC DATA CENTRES
- 20.13.1. Business Overview
- 20.13.2. Service Offerings
- 20.14. CHAYORA
- 20.14.1. Business Overview
- 20.14.2. Service Offerings
- 20.15. CHINA TELECOM
- 20.15.1. Business Overview
- 20.15.2. Service Offerings
- 20.15.3. Sustainability
- 20.16. CHINDATA GROUP
- 20.16.1. Business Overview
- 20.16.2. Service Offerings
- 20.16.3. Sustainability
- 20.17. CLOUDHQ
- 20.17.1. Business Overview
- 20.17.2. Service Offerings
- 20.17.3. Sustainability
- 20.18. COLOGIX
- 20.18.1. Business Overview
- 20.18.2. Service Offerings
- 20.18.3. Sustainability
- 20.19. COLT DATA CENTRE SERVICES (COLT DCS)
- 20.19.1. Business Overview
- 20.19.2. Service Offerings
- 20.20. COMPASS DATACENTERS
- 20.20.1. Business Overview
- 20.20.2. Service Offerings
- 20.20.3. Sustainability
- 20.21. CORSCALE DATA CENTERS
- 20.21.1. Business Overview
- 20.21.2. Service Offerings
- 20.21.3. Sustainability
- 20.22. CTRLS DATACENTERS
- 20.22.1. Business Overview
- 20.22.2. Service Offerings
- 20.23. CYRUSONE
- 20.23.1. Business Overview
- 20.23.2. Service Offerings
- 20.23.3. Sustainability
- 20.24. CYXTERA TECHNOLOGIES
- 20.24.1. Business Overview
- 20.24.2. Service Offerings
- 20.24.3. Sustainability
- 20.25. DATA4 GROUP
- 20.25.1. Business Overview
- 20.25.2. Service Offerings
- 20.26. DATABANK
- 20.26.1. Business Overview
- 20.26.2. Service Offerings
- 20.27. DIGITAL EDGE DC
- 20.27.1. Business Overview
- 20.27.2. Service Offerings
- 20.28. DIGITAL REALTY
- 20.28.1. Business Overview
- 20.28.2. Service Offerings
- 20.28.3. Sustainability
- 20.29. EDGECONNEX
- 20.29.1. Business Overview
- 20.29.2. Service Offerings
- 20.29.3. Sustainability
- 20.30. EQUINIX
- 20.30.1. Business Overview
- 20.30.2. Service Offerings
- 20.30.3. Sustainability
- 20.31. FLEXENTIAL
- 20.31.1. Business Overview
- 20.31.2. Service Offerings
- 20.31.3. Sustainability
- 20.32. GDS SERVICES
- 20.32.1. Business Overview
- 20.32.2. Service Offerings
- 20.32.3. Sustainability
- 20.33. GLOBAL SWITCH
- 20.33.1. Business Overview
- 20.33.2. Service Offerings
- 20.34. GOOGLE
- 20.34.1. Business Overview
- 20.34.2. Service Offerings
- 20.34.3. Sustainability
- 20.35. GREEN MOUNTAIN (AZRIELI GROUP)
- 20.35.1. Business Overview
- 20.35.2. Service Offerings
- 20.35.3. Sustainability
- 20.36. GREENSQUAREDC
- 20.36.1. Business Overview
- 20.36.2. Service Offerings
- 20.36.3. Sustainability
- 20.37. GULF DATA HUB
- 20.37.1. Business Overview
- 20.37.2. Service Offerings
- 20.37.3. Sustainability
- 20.38. HOSTDIME
- 20.38.1. Business Overview
- 20.38.2. Service Offerings
- 20.38.3. Sustainability
- 20.39. HUAWEI TECHNOLOGIES
- 20.39.1. Business Overview
- 20.39.2. Product Offerings
- 20.39.3. Sustainability
- 20.40. IRON MOUNTAIN
- 20.40.1. Business Overview
- 20.40.2. Service Offerings
- 20.40.3. Sustainability
- 20.41. IXAFRICA
- 20.41.1. Business Overview
- 20.41.2. Service Offerings
- 20.41.3. Sustainability
- 20.42. KEPPEL DATA CENTRES
- 20.42.1. Business Overview
- 20.42.2. Service Offerings
- 20.43. KHAZNA DATA CENTERS
- 20.43.1. Business Overview
- 20.43.2. Service Offerings
- 20.43.3. Sustainability
- 20.44. KIO NETWORKS
- 20.44.1. Business Overview
- 20.44.2. Service Offerings
- 20.44.3. Sustainability
- 20.45. KAO DATA
- 20.45.1. Business Overview
- 20.45.2. Service Offerings
- 20.45.3. Sustainability
- 20.46. LUMEN TECHNOLOGIES (CIRION TECHNOLOGIES)
- 20.46.1. Business Overview
- 20.46.2. Service Offerings
- 20.47. META
- 20.47.1. Business Overview
- 20.47.2. Service Offerings
- 20.47.3. Sustainability
- 20.48. MICROSOFT
- 20.48.1. Business Overview
- 20.48.2. Service Offerings
- 20.48.3. Sustainability
- 20.49. MORO HUB
- 20.49.1. Business Overview
- 20.49.2. Service Offerings
- 20.49.3. Sustainability
- 20.50. NAUTILUS DATA TECHNOLOGIES
- 20.50.1. Business Overview
- 20.50.2. Service Offerings
- 20.50.3. Sustainability
- 20.51. NETIA
- 20.51.1. Business Overview
- 20.51.2. Service Offerings
- 20.51.3. Sustainability
- 20.52. NEXTDC
- 20.52.1. Business Overview
- 20.52.2. Service Offerings
- 20.53. NTT GLOBAL DATA CENTERS
- 20.53.1. Business Overview
- 20.53.2. Service Offerings
- 20.53.3. Sustainability
- 20.54. NOVVA DATA CENTERS
- 20.54.1. Business Overview
- 20.54.2. Service Offerings
- 20.54.3. Sustainability
- 20.55. ONEASIA NETWORK
- 20.55.1. Business Overview
- 20.55.2. Service Offerings
- 20.55.3. Sustainability
- 20.56. ORACLE
- 20.56.1. Business Overview
- 20.56.2. Service Offerings
- 20.56.3. Sustainability
- 20.57. ORANGE BUSINESS SERVICES
- 20.57.1. Business Overview
- 20.57.2. Service Offerings
- 20.57.3. Sustainability
- 20.58. OVHCLOUD
- 20.58.1. Business Overview
- 20.58.2. Service Offerings
- 20.58.3. Sustainability
- 20.59. PENTA INFRA
- 20.59.1. Business Overview
- 20.59.2. Service Offerings
- 20.59.3. Sustainability
- 20.60. PRINCETON DIGITAL GROUP
- 20.60.1. Business Overview
- 20.60.2. Service Offerings
- 20.60.3. Sustainability
- 20.61. QTS REALTY TRUST
- 20.61.1. Business Overview
- 20.61.2. Service Offerings
- 20.62. RACKBANK
- 20.62.1. Business Overview
- 20.62.2. Service Offerings
- 20.63. RAXIO GROUP
- 20.63.1. Business Overview
- 20.63.2. Service Offerings
- 20.64. ROSTELECOM
- 20.64.1. Business Overview
- 20.64.2. Service Offerings
- 20.65. SABEY DATA CENTERS
- 20.65.1. Business Overview
- 20.65.2. Service Offerings
- 20.65.3. Sustainability
- 20.66. SCALA DATA CENTERS
- 20.66.1. Business Overview
- 20.66.2. Service Offerings
- 20.66.3. Sustainability
- 20.67. SERVERFARM
- 20.67.1. Business Overview
- 20.67.2. Service Offerings
- 20.67.3. Sustainability
- 20.68. SIFY TECHNOLOGIES
- 20.68.1. Business Overview
- 20.68.2. Service Offerings
- 20.69. SPACEDC
- 20.69.1. Business Overview
- 20.69.2. Service Offerings
- 20.70. STACK INFRASTRUCTURE
- 20.70.1. Business Overview
- 20.70.2. Service Offerings
- 20.70.3. Sustainability
- 20.71. ST TELEMEDIA GLOBAL DATA CENTRES
- 20.71.1. Business Overview
- 20.71.2. Service Offerings
- 20.71.3. Sustainability
- 20.72. SUNEVISION (IADVANTAGE)
- 20.72.1. Business Overview
- 20.72.2. Service Offerings
- 20.72.3. Sustainability
- 20.73. SWITCH
- 20.73.1. Business Overview
- 20.73.2. Service Offerings
- 20.74. T5 DATA CENTERS
- 20.74.1. Business Overview
- 20.74.2. Service Offerings
- 20.75. TELEHOUSE
- 20.75.1. Business Overview
- 20.75.2. Service Offerings
- 20.75.3. Sustainability
- 20.76. TENCENT
- 20.76.1. Business Overview
- 20.76.2. Service Offerings
- 20.77. TENGLONG HOLDINGS GROUP
- 20.77.1. Business Overview
- 20.77.2. Service Offerings
- 20.78. VANTAGE DATA CENTERS
- 20.78.1. Business Overview
- 20.78.2. Service Offerings
- 20.78.3. Sustainability
- 20.79. VNET GROUP
- 20.79.1. Business Overview
- 20.79.2. Service Offerings
- 20.79.3. Sustainability
- 20.80. YANDEX
- 20.80.1. Business Overview
- 20.80.2. Service Offerings
- 20.80.3. Sustainability
- 20.81. YONDR
- 20.81.1. Business Overview
- 20.81.2. Service Offerings
- 20.82. YOTTA INFRASTRUCTURE
- 20.82.1. Business Overview
- 20.82.2. Service Offerings
21. RENEWABLE ENERGY PROVIDERS
- 21.1. ACCONIA ENERGIA
- 21.1.1. Business Overview
- 21.1.2. Product/Service Offerings
- 21.2. ADANI GREEN ENERGY (AGEL)
- 21.2.1. Business Overview
- 21.2.2. Product/Service Offerings
- 21.3. AGL
- 21.3.1. Business Overview
- 21.3.2. Product/Service Offerings
- 21.4. ALGONQUIN POWER & UTILITIES CORP
- 21.4.1. Business Overview
- 21.4.2. Product/Service Offerings
- 21.5. AMP ENERGY
- 21.5.1. Business Overview
- 21.5.2. Product/Service Offerings
- 21.6. APEX CLEAN ENERGY
- 21.6.1. Business Overview
- 21.6.2. Product/Service Offerings
- 21.7. AVAADA ENERGY
- 21.7.1. Business Overview
- 21.7.2. Product/Service Offerings
- 21.8. BETTER ENERGY
- 21.8.1. Business Overview
- 21.8.2. Product/Service Offerings
- 21.9. BRYT ENERGY
- 21.9.1. Business Overview
- 21.9.2. Service Offerings
- 21.10. CONRAD ENERGY
- 21.10.1. Business Overview
- 21.10.2. Product/Service Offerings
- 21.11. DATAFARM ENERGY
- 21.11.1. Business Overview
- 21.11.2. Product/Service Offerings
- 21.12. DE SHAW RENEWABLE INVESTMENTS
- 21.12.1. Business Overview
- 21.12.2. Product/Service Offerings
- 21.13. DISTRIBUTED POWER TECHNOLOGIES
- 21.13.1. Business Overview
- 21.13.2. Product/Service Offerings
- 21.14. DOMINION ENERGY
- 21.14.1. Business Overview
- 21.14.2. Product/Service Offerings
- 21.15. EDF RENEWABLES
- 21.15.1. Business Overview
- 21.15.2. Product/Service Offerings
- 21.16. ENECO
- 21.16.1. Business Overview
- 21.16.2. Product/Service Offerings
- 21.17. ENEL GROUP
- 21.17.1. Business Overview
- 21.17.2. Product/Service Offerings
- 21.18. ENGIE
- 21.18.1. Business Overview
- 21.18.2. Product/Service Offerings
- 21.19. ERG
- 21.19.1. Business Overview
- 21.19.2. Product/Service Offerings
- 21.20. FARO ENERGY
- 21.20.1. Business Overview
- 21.20.2. Product/Service Offerings
- 21.21. GREENYELLOW
- 21.21.1. Business Overview
- 21.21.2. Product/Service Offerings
- 21.22. HDF ENERGY
- 21.22.1. Business Overview
- 21.22.2. Product/Service Offerings
- 21.23. IBERDROLA
- 21.23.1. Business Overview
- 21.23.2. Product/Service Offerings
- 21.24. ILMATAR ENERGY
- 21.24.1. Business Overview
- 21.24.2. Product/Service Offerings
- 21.25. LEEWARD RENEWABLE ENERGY
- 21.25.1. Business Overview
- 21.25.2. Product/Service Offerings
- 21.26. LIGHTSOURCE BP
- 21.26.1. Business Overview
- 21.26.2. Product/Service Offerings
- 21.27. MC RETAIL ENERGY
- 21.27.1. Business Overview
- 21.27.2. Product/Service Offerings
- 21.28. MP2 ENERGY
- 21.28.1. Business Overview
- 21.28.2. Product/Service Offerings
- 21.29. NEOEN
- 21.29.1. Business Overview
- 21.29.2. Product/Service Offerings
- 21.30. NEXTERA ENERGY
- 21.30.1. Business Overview
- 21.30.2. Product/Service Offerings
- 21.31. NTR
- 21.31.1. Business Overview
- 21.31.2. Product/Service Offerings
- 21.32. ØRSTED
- 21.32.1. Business Overview
- 21.32.2. Product/Service Offerings
- 21.33. PACIFIC GAS AND ELECTRIC COMPANY
- 21.33.1. Business Overview
- 21.33.2. Product/Service Offerings
- 21.34. PATTERN ENERGY
- 21.34.1. Business Overview
- 21.34.2. Product/Service Offerings
- 21.35. RENANTIS
- 21.35.1. Business Overview
- 21.35.2. Product/Service Offerings
- 21.36. RENEW POWER
- 21.36.1. Business Overview
- 21.36.2. Product/Service Offerings
- 21.37. ROCKY MOUNTAIN POWER
- 21.37.1. Business Overview
- 21.37.2. Product/Service Offerings
- 21.38. RWE RENEWABLES
- 21.38.1. Business Overview
- 21.38.2. Product/Service Offerings
- 21.39. RZK ENERGIA
- 21.39.1. Business Overview
- 21.39.2. Product/Service Offerings
- 21.40. SCOTTISHPOWER
- 21.40.1. Business Overview
- 21.40.2. Product/Service Offerings
- 21.41. SHELL
- 21.41.1. Business Overview
- 21.41.2. Product/Service Offerings
- 21.42. SHIZEN ENERGY
- 21.42.1. Business Overview
- 21.42.2. Product/Service Offerings
- 21.43. SIMPLY ENERGY
- 21.43.1. Business Overview
- 21.43.2. Product/Service Offerings
- 21.44. SOLAR ALLIANCE
- 21.44.1. Business Overview
- 21.44.2. Product/Service Offerings
- 21.45. SUNSEAP GROUP
- 21.45.1. Business Overview
- 21.45.2. Product/Service Offerings
- 21.46. THE AES CORPORATION
- 21.46.1. Business Overview
- 21.46.2. Product/Service Offerings
- 21.47. TORCH CLEAN ENERGY
- 21.47.1. Business Overview
- 21.47.2. Product/Service Offerings
- 21.48. TOTALENERGIES
- 21.48.1. Business Overview
- 21.48.2. Product/Service Offerings
22. QUANTITATIVE SUMMARY
- 22.1. GLOBAL SUSTAINABLE DATA CENTER MARKET
- 22.1.1. Market Size & Forecast
- 22.2. INFRASTRUCTURE
- 22.2.1. Market Size & Forecast
- 22.3. INVESTMENT BY GEOGRAPHY
- 22.3.1. Market Size & Forecast
- 22.4. INVESTMENT BY POWER CAPACITY
- 22.4.1. Market Size & Forecast
- 22.5. NORTH AMERICA
- 22.5.1. Market Size & Forecast
- 22.5.2. Infrastructure: Market Size & Forecast
- 22.6. US
- 22.6.1. Market Size & Forecast
- 22.7. CANADA
- 22.7.1. Market Size & Forecast
- 22.8. LATIN AMERICA
- 22.8.1. Market Size & Forecast
- 22.8.2. Infrastructure: Market Size & Forecast
- 22.9. BRAZIL
- 22.9.1. Market Size & Forecast
- 22.10. CHILE
- 22.10.1. Market Size & Forecast
- 22.11. MEXICO
- 22.11.1. Market Size & Forecast
- 22.12. COLOMBIA
- 22.12.1. Market Size & Forecast
- 22.13. REST OF LATIN AMERICA
- 22.13.1. Market Size & Forecast
- 22.14. WESTERN EUROPE
- 22.14.1. Market Size & Forecast
- 22.14.2. Infrastructure: Market Size & Forecast
- 22.15. UK
- 22.15.1. Market Size & Forecast
- 22.16. GERMANY
- 22.16.1. Market Size & Forecast
- 22.17. FRANCE
- 22.17.1. Market Size & Forecast
- 22.18. NETHERLANDS
- 22.18.1. Market Size & Forecast
- 22.19. IRELAND
- 22.19.1. Market Size & Forecast
- 22.20. SWITZERLAND
- 22.20.1. Market Size & Forecast
- 22.21. OTHER WESTERN EUROPEAN NATIONS
- 22.21.1. Market Size & Forecast
- 22.22. NORDICS
- 22.22.1. Market Size & Forecast
- 22.22.2. Infrastructure: Market Size & Forecast
- 22.23. SWEDEN
- 22.23.1. Market Size & Forecast
- 22.24. DENMARK
- 22.24.1. Market Size & Forecast
- 22.25. NORWAY
- 22.25.1. Market Size & Forecast
- 22.26. FINLAND & ICELAND
- 22.26.1. Market Size & Forecast
- 22.27. CENTRAL & EASTERN EUROPE
- 22.27.1. Market Size & Forecast
- 22.27.2. Infrastructure: Market Size & Forecast
- 22.28. POLAND
- 22.28.1. Market Size & Forecast
- 22.29. OTHER CENTRAL & EASTERN EUROPEAN COUNTRIES
- 22.29.1. Market Size & Forecast
- 22.30. MIDDLE EAST
- 22.30.1. Market Size & Forecast
- 22.30.2. Infrastructure: Market Size & Forecast
- 22.31. UAE
- 22.31.1. Market Size & Forecast
- 22.32. SAUDI ARABIA
- 22.32.1. Market Size & Forecast
- 22.33. OTHER MIDDLE EASTERN COUNTRIES
- 22.33.1. Market Size & Forecast
- 22.34. AFRICA
- 22.34.1. Market Size & Forecast
- 22.34.2. Infrastructure: Market Size & Forecast
- 22.35. SOUTH AFRICA
- 22.35.1. Market Size & Forecast
- 22.36. OTHER AFRICAN COUNTRIES
- 22.36.1. Market Size & Forecast
- 22.37. APAC
- 22.37.1. Market Size & Forecast
- 22.37.2. Infrastructure: Market Size & Forecast
- 22.38. CHINA & HONG KONG
- 22.38.1. Market Size & Forecast
- 22.39. AUSTRALIA & NEW ZEALAND
- 22.39.1. Market Size & Forecast
- 22.40. INDIA
- 22.40.1. Market Size & Forecast
- 22.41. JAPAN
- 22.41.1. Market Size & Forecast
- 22.42. SOUTH KOREA
- 22.42.1. Market Size & Forecast
- 22.43. REST OF APAC
- 22.43.1. Market Size & Forecast
- 22.44. SOUTHEAST ASIA
- 22.44.1. Market Size & Forecast
- 22.44.2. Infrastructure: Market Size & Forecast
- 22.45. SINGAPORE
- 22.45.1. Market Size & Forecast
- 22.46. INDONESIA
- 22.46.1. Market Size & Forecast
- 22.47. MALAYSIA
- 22.47.1. Market Size & Forecast
- 22.48. OTHER SOUTHEAST ASIAN COUNTRIES
- 22.48.1. Market Size & Forecast
23. APPENDIX
- 23.1. LIST OF ABBREVIATIONS
- 23.2. CURRENCY CONVERSION
