
|
市場調査レポート
商品コード
1940781
アジア太平洋地域のデータセンター:市場シェア分析、業界動向と統計、成長予測(2026年~2031年)Asia-Pacific Data Center - Market Share Analysis, Industry Trends & Statistics, Growth Forecasts (2026 - 2031) |
||||||
カスタマイズ可能
適宜更新あり
|
|||||||
| アジア太平洋地域のデータセンター:市場シェア分析、業界動向と統計、成長予測(2026年~2031年) |
|
出版日: 2026年02月09日
発行: Mordor Intelligence
ページ情報: 英文 262 Pages
納期: 2~3営業日
|

概要
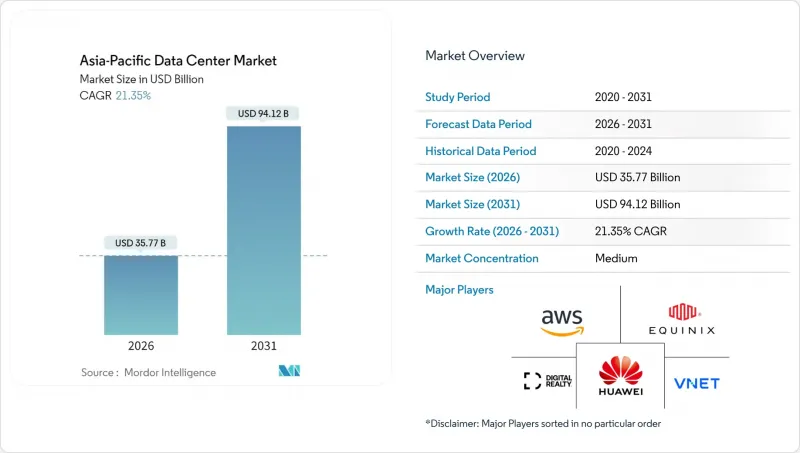
アジア太平洋地域のデータセンター市場規模は、2026年に357億7,000万米ドルと推定されております。
これは2025年の294億7,000万米ドルから成長した数値であり、2031年には941億2,000万米ドルに達すると予測されております。2026年から2031年にかけては、CAGR21.35%で成長が見込まれております。
設置ベースにおいては、市場規模は2025年の2万9,310メガワットから2030年までに6万3,110メガワットへ拡大し、予測期間(2025-2030年)におけるCAGRは16.57%と予測されております。市場セグメンテーションのシェアおよび推定値は、MW単位で算出・報告されています。急速な5G展開、AI/MLワークロードの急増、データ主権規制により、わずか5年で容量が倍増し、アジア太平洋地域のデータセンター市場は世界で最も急速に成長するデジタルインフラ分野となっています。事業者各社は、高電力密度のワークロードに対応しつつ、ますます厳格化する効率性要件を満たすため、液体冷却技術の導入、再生可能エネルギー調達の推進、海底ケーブル接続の整備を急ピッチで進めています。中国は現在34.58%のシェアで主導的立場にありますが、インドの20.50%というCAGRは、需要が南アジアへ大きくシフトしつつあることを示しています。コロケーションは依然として主流のサービスモデルですが、中国のクラウド大手が主導するハイパースケール自社建設の波が、企業がコスト、レイテンシー、コンプライアンスのトレードオフを慎重に検討する中で、競合の構図を再構築しつつあります。
アジア太平洋地域のデータセンター市場の動向と洞察
5Gコアネットワークの展開加速
5Gの普及拡大は、アジア太平洋地域のデータセンター市場全体におけるワークロード配置の経済性を再構築しています。中国では2024年に5G基地局が338万基を突破し、各基地局で20ミリ秒未満の遅延が要求されるため、通信事業者は人口密集地に近い中規模エッジ施設への配置を推進しております。日本では2024年、通信事業者が5Gインフラに1兆2,000億円を投資し、製造業やエンターテインメント分野における超低遅延アプリケーションを実現。これにより分散型コンピューティングノードの地域需要が加速しております。シンガポールでは5Gカバレッジ95%を達成し、重要サービスへのローカル処理を義務付ける政策により、新たなエッジ構築が加速しています。このトラフィック分散化が、メガサイトよりも中規模施設の成長が速い理由です。開発者にとって、通信事業者テナントを獲得する際の重要な差別化要素として、ネットワークバックホール提携とモジュール設計が浮上しています。
中国テック大手によるハイパースケール自社建設投資の増加
アリババ、テンセント、バイトダンスは、コスト最適化と現地化規制への対応を目的に、クラウドインフラ予算を自社キャンパス建設へ転換しています。アリババは2027年までに新規地域構築に280億米ドルを計上し、その60%を自社運営施設に割り当てています。バイトダンスは大規模言語モデル訓練に対応するAI対応設計に72億米ドルを投入し、テンセントは東南アジアのゲーマー向け水冷施設に58億米ドルを投資しました。この急増はアジア太平洋地域のデータセンター市場のハイパースケール分野を牽引する一方、小売コロケーション市場における価格競争を激化させています。既存事業者はシェア防衛のため、サービスポートフォリオの拡充(クラウド間相互接続、管理型GPUクラスター、コンプライアンス・アズ・ア・サービスなど)で対応しています。
長期化する送電網接続承認プロセス
接続遅延は、高成長市場におけるプロジェクトの回収期間を延長させます。インドでは州委員会が環境影響と送電網の安定性を精査するため、承認に平均18~24ヶ月を要します。インドネシアのPLN(国家電力公社)も10MW超の負荷に対して同様のタイムラインを課しており、フィリピンの再生可能エネルギー証明書義務化により処理が最大1年延長されます。開発業者は遊休地のコストや倉庫保管設備の減価償却を負担せざるを得ず、内部収益率(IRR)を押し下げ、アジア太平洋地域のデータセンター市場の容量拡大を遅らせています。
セグメント分析
中規模サイトは2031年までにCAGR12.90%を記録。通信事業者やCDNプロバイダーが都市部エッジトラフィック集約向けに5~20MWノードを優先しているためです。大規模キャンパスは依然としてアジア太平洋地域のデータセンター市場規模の30.62%を占め、世界のクラウドテナントが規模の経済性を重視して選択しています。大規模(100MW超)ハブはAIトレーニングを支える地域中核機能を果たし、小規模施設はニッチ企業や遠隔地のニーズに対応します。5G高密度化が進む中、分散型アーキテクチャはメガプロジェクトが資本投入を主導する状況下でも、中規模サイトの需要を牽引し続けるでしょう。
アジア太平洋地域のデータセンター業界では、ハブ・アンド・スポーク型トポロジーの採用が拡大しています。大規模ハブが高密度コンピューティングを提供し、中規模サテライトがネットワークエッジでの遅延要件を保証します。主要都市における電力・土地制約から、大阪、ハイデラバード、ジョホールバルなどの二次都市で土地確保戦略が進められています。投資家にとっては、規模クラスを跨いだポートフォリオ分散により、単一サイトのユーティリティボトルネックへの依存度を低減できます。
2025年時点でティア3はアジア太平洋地域のデータセンター市場規模の62.35%を占め、99.982%の稼働率を提供しています。これはティア4のコストプレミアムを伴わずに、多くの企業が十分と考える水準です。シンガポール金融管理局などの規制当局による金融データ居住要件ではティア3以上の基準が義務付けられており、需要を確固たるものにしております。ティア1およびティア2は開発・テストワークロードを集め、ティア4は重要な決済システムや特定の政府クラウドに限定されております。
標準化されたティア3設計図は許可取得期間を短縮し、プレハブ部品の使用を可能にすることで、建設スケジュールを最大20%短縮します。ISO 27001への準拠により認証プロセスもさらに効率化されます。その結果、AIがラック密度の上昇を促す一方で、事業者がコスト意識を保つ中、ティア3は主導的立場をさらに拡大する見込みです。
アジア太平洋地域のデータセンター市場レポートは、データセンター規模(大規模、超大規模、中規模、メガ、小規模)、ティアタイプ(ティア1・2、ティア3、ティア4)、データセンタータイプ(ハイパースケール/自社建設、企業/エッジ、コロケーション)、エンドユーザー(BFSI、ITおよびITES、Eコマース、政府、製造、メディア・エンターテインメントなど)、地域別に分類されています。市場予測はIT負荷容量(MW)単位で提供されます。
その他の特典:
- エクセル形式の市場予測(ME)シート
- アナリストによる3か月間のサポート
よくあるご質問
目次
第1章 イントロダクション
- 調査の前提条件と市場定義- 調査範囲
第2章 調査手法
第3章 エグゼクティブサマリー
第4章 市場情勢
- 市場概要
- 市場促進要因
- 5Gコアネットワークの展開加速
- 中国の大手テクノロジー企業によるハイパースケール自社建設投資の増加
- グリーンデータセンターに対する政府の免税期間インセンティブ
- オンプレミスGPUクラスターに対するAI/MLワークロード需要の急増
- 海底ケーブル陸揚げ局とエッジ設備の迅速な統合
- ソブリン・ウェルス・ファンドが好むビルド・トゥ・スーツモデル
- 市場抑制要因
- 電力系統接続承認プロセスの長期化
- 中国北部における顕著な水不足リスク
- アジア太平洋地域の一級都市における不動産コストの高騰
- 認定データセンター技術者の不足
- 市場見通し
- IT負荷容量
- 高床式フロア面積
- コロケーション収益
- 設置済みラック
- ラックスペース利用率
- 海底ケーブル
- 主要な業界動向
- スマートフォンユーザー
- スマートフォン1台あたりのデータ通信量
- モバイルデータ通信速度
- ブロードバンドデータ速度
- 光ファイバー接続ネットワーク
- 規制の枠組み
- 中国
- 日本
- インド
- インドネシア
- オーストラリア
- シンガポール
- ニュージーランド
- マレーシア
- タイ
- その他アジア太平洋地域
- バリューチェーンと流通チャネル分析
- ポーターのファイブフォース分析
- 新規参入業者の脅威
- 買い手の交渉力
- 供給企業の交渉力
- 代替品の脅威
- 競争企業間の敵対関係
第5章 市場規模と成長予測(MW)
- データセンター規模別
- 大規模
- 巨大
- 中規模
- メガ
- 小規模
- ティアタイプ別
- ティア1およびティア2
- ティア3
- ティア4
- データセンタータイプ別
- ハイパースケール/自社建設
- エンタープライズ/エッジ
- コロケーション
- 未利用
- 利用
- リテールコロケーション
- 卸売コロケーション
- エンドユーザー別
- BFSI
- ITおよびITES
- 電子商取引
- 政府
- 製造業
- メディアとエンターテイメント
- 通信
- その他のエンドユーザー
- 国別
- 中国
- 日本
- インド
- インドネシア
- オーストラリア
- シンガポール
- ニュージーランド
- マレーシア
- タイ
- その他アジア太平洋地域
第6章 競合情勢
- 市場集中度
- 戦略的動向
- 市場シェア分析
- 企業プロファイル
- Amazon Web Services, Inc
- Equinix, Inc.
- Alibaba Cloud
- Chindata Group Holdings Ltd
- AirTrunk Operating Pty Ltd
- Space DC Pte Ltd
- NTT Ltd
- Huawei Cloud Computing Technologies Co., Ltd
- Global Data Solutions Co., Ltd.(GDS)
- Google Inc
- LG Uplus Corp
- Range Technology Development Co., Ltd
- NEXTDC Limited
- Digital Realty Trust Inc.
- Beijing VNET Broadband Data Center Co., Ltd
