
|
市場調査レポート
商品コード
1911759
イタリアのデータセンター:市場シェア分析、業界動向と統計、成長予測(2026年~2031年)Italy Data Center - Market Share Analysis, Industry Trends & Statistics, Growth Forecasts (2026 - 2031) |
||||||
カスタマイズ可能
適宜更新あり
|
|||||||
| イタリアのデータセンター:市場シェア分析、業界動向と統計、成長予測(2026年~2031年) |
|
出版日: 2026年01月12日
発行: Mordor Intelligence
ページ情報: 英文 141 Pages
納期: 2~3営業日
|

概要
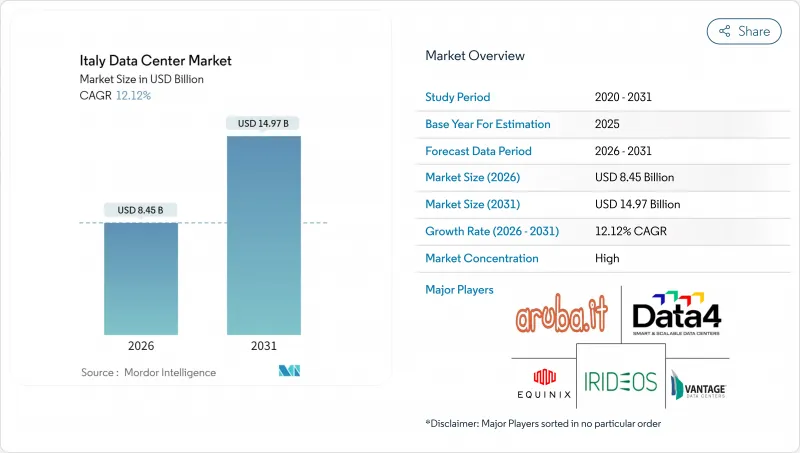
イタリアのデータセンター市場は、2025年の75億4,000万米ドルから2026年には84億5,000万米ドルへ成長し、2026年から2031年にかけてCAGR12.12%で推移し、2031年までに149億7,000万米ドルに達すると予測されています。
IT負荷容量の面では、市場は2025年の1,080メガワットから2030年までに4,090メガワットへ成長し、予測期間(2025-2030年)におけるCAGRは30.49%と予測されています。市場セグメントのシェアおよび推定値は、MW単位で算出・報告されています。ハイパースケールクラウドの拡大、公共部門の積極的なデジタル化プログラム、AI駆動型コンピューティング需要の増加が需要を牽引しています。ミラノは欧州横断光ファイバールートに近接し、電力調達環境が改善され、海底ケーブルの敷設計画が増加しているため、高密度建設に適した魅力的な立地を維持しています。国際投資家も、フランクフルト、ロンドン、アムステルダム、パリ、ダブリンに比べ、土地と電力の確保が依然として容易であることからイタリアを好んでいます。合併活動の活発化は、規模の経済が決定的要因となるにつれ、市場が統合段階に入る可能性を示唆しています。
イタリアデータセンター市場の動向と分析
ハイパースケーラーによるクラウド拡張の加速
イタリアは現在、混雑した北欧のハブからの容量分散を必要とする世界のクラウドプロバイダーにとって最上位の目的地となっています。マイクロソフトはロンバルディア州の新施設に43億ユーロ(46億米ドル)を投じ、2027年までに複数のアベイラビリティゾーンを稼働させる予定です。Google Cloudはミラノとトリノに6棟にまたがる双子のリージョンを開設し、現地のデータ居住要件を満たしています。Amazon Web Services(AWS)は、モンタルト・ディ・カストロなど旧エネル発電所跡地を評価中です。これにより許可取得期間の短縮と既存送電網の活用が図られます。海外資本の流入は建設基準の向上、液体冷却技術の普及促進、そして国家送電網事業者テルナとの大口電力契約の推進につながっています。
PNRRに基づく公共部門のクラウド移行
イタリアの1,915億ユーロ規模の復興・レジリエンス計画(PNRR)は、全国的なデジタル変革を加速させました。国家戦略ハブ(Polo Strategico Nazionale)は2024年、省庁の業務負荷をソブリンクラウドへ移行するため、前年比73%増となる5億2,000万ユーロ相当の契約を授与しました。本イニシアチブでは、データは国内に保管されることが義務付けられており、量子耐性暗号化と99.995%の稼働率を備えたTier 4サイトが優先されます。TIM社は、ローマ近郊に25MWの施設を建設するため1億3,000万ユーロ(1億4,100万米ドル)を投じ、2026年末の完成を予定しています。この施設はGPUクラスター専用に設計されています。自治体もコンプライアンス対応を進める中、公立病院や学校などにおける小規模なエッジノードの需要も生じています。
高騰する電力コストと送電網の制約
2024年のイタリア卸電力価格は平均133ユーロ/MWh(144米ドル/MWh)で、フランス比30%、スペイン比40%高となり、営業利益率を圧迫しています。テルナ社は2025年3月までに42GWの接続申請を受領しており、これは現行の発電予備容量を大幅に上回り、供給能力不足を露呈しています。再生可能エネルギーの認可は遅れており、2022年に提出された太陽光発電申請の認可率は地域全体でわずか1%でした。イタリアのデータセンター市場においては、事業者様は複数年にわたる再生可能エネルギーのPPA(電力購入契約)を締結し、オンサイトバッテリーへの投資を行い、変電所のアップグレードに合わせて建設を段階的に進める必要があります。
セグメント分析
2025年時点でイタリアのデータセンター市場を牽引したのは大規模施設セグメントであり、収益の46.45%を占めました。Digital RealtyやArubaといった事業者は、これらの施設を卸売コロケーションスイートやマルチテナント型クラウドノードの集積拠点として活用しています。一方、60MWを超える大規模キャンパスは、ハイパースケールクラウド事業者がAIトレーニングワークロードを自社内へ移行する動きに伴い、2031年までにCAGR29.10%で拡大が見込まれます。この建設ブームはミラノ東部環状道路周辺で顕著であり、2025年には合計350MWの3プロジェクトが着工されました。ユーティリティ規模の敷地面積は、変動する送電料金を緩和する専用150kV送電網接続と構内変電所の設置を正当化します。小規模施設は、工場や通信中央局に併設するモジュラー式増築施設でエッジ使用事例に対応可能なため、着実に減少傾向にあります。
大規模化への加速は総所有コストを圧縮します。電力インフラをより多くのラックに分散させることで、kW当たりの設備投資額を最大25%削減し、ベルガモなどの都市で地域暖房に供給する集中型熱回収ループによりPUEを改善します。同時に、地方自治体は土地利用の競合を最小化するため、統合的なゾーニングを推進しています。したがって、大規模キャンパスへの動きは、特に高速道路アクセスやダークファイバールートが既に整備されているロンバルディア州やピエモンテ州において、長期的な土地確保戦略を強化します。こうした状況下で、イタリアのデータセンター市場規模は、大規模プロジェクトにおいて5年間で約4倍に拡大し、新規建設設備投資において中規模デプロイメントを上回る見込みです。
ティア4施設は2025年の収益の55.05%を占め、30.20%のCAGRが見込まれており、これは企業が同時保守可能なインフラを求める姿勢を反映しています。金融機関、通信事業者、公共セクター機関はいずれも、デュアル132kV給電、72時間分のディーゼルデイタンク、完全耐障害性冷却ループを備えた2N+1アーキテクチャを要求しています。Tier 3サイトは建設コストが15%安価であるもの、災害復旧用途や非重要ワークロードのサードパーティホスティングに限定されています。Tier 1-2設備は、ローカルコンテンツキャッシュや工場データダンプといったニッチなエッジシナリオに対応します。
2026年に見込まれる規制改革により、政府契約を提供するパブリッククラウド事業者に対する稼働時間要件が法制化される可能性があり、事実上ティア4認証が義務付けられる見込みです。この見通しは投資を最高レベルにさらに傾け、2027年までにイタリアのデータセンター市場におけるティア4のシェアを約60%に押し上げると予想されます。ミッションクリティカルなアプリケーションの大半は年間5分以上のダウンタイムを許容できないため、需要の弾力性は低い状態です。したがって、Tier 4構築に注力するベンダーは価格決定力を獲得する一方、Tier 3事業者は競合を維持するため、マネージドセキュリティサービスなどの収益源を追加する必要があります。
イタリアデータセンター市場レポートは、データセンター規模(大規模、超大規模、中規模、メガ、小規模)、ティアタイプ(ティア1・2、ティア3、ティア4)、データセンタータイプ(ハイパースケール/自社建設、企業/エッジ、コロケーション)、エンドユーザー(BFSI、ITおよびITES、Eコマース、政府、製造、メディアおよびエンターテインメント、通信など)、ならびにホットスポットによって分類されています。市場予測はIT負荷容量(MW)単位で提供されます。
その他の特典:
- エクセル形式の市場予測(ME)シート
- アナリストによる3ヶ月間のサポート
よくあるご質問
目次
第1章 イントロダクション
- 調査の前提条件と市場の定義
- 調査範囲
第2章 調査手法
第3章 エグゼクティブサマリー
第4章 市場情勢
- 市場概要
- 市場促進要因
- ハイパースケーラーによるクラウド拡張の加速
- PNRRに基づく公共部門のクラウド移行
- AI駆動型高密度コンピューティング需要
- 戦略的な海底・陸上接続のアップグレード
- 地域熱供給における廃熱回収の導入状況
- 既存施設(ブラウンフィールド)及び地下サイトの再利用
- 市場抑制要因
- 高騰する電力コストと送電網の制約
- 規制の不確実性と許可手続きの遅延
- 水資源の確保と冷却制限
- 大規模建設のための国内資本が限られている
- 市場見通し
- IT負荷容量
- 高床式フロア面積
- コロケーション収益
- 設置済みラック
- ラックスペース利用率
- 海底ケーブル
- 主要な業界動向
- スマートフォン利用者数
- スマートフォン1台あたりのデータトラフィック
- モバイルデータ通信速度
- ブロードバンドデータ通信速度
- 光ファイバー接続ネットワーク
- 規制の枠組み
- バリューチェーン及び流通チャネル分析
- ポーターのファイブフォース分析
- 新規参入業者の脅威
- 買い手の交渉力
- 供給企業の交渉力
- 代替品の脅威
- 競争企業間の敵対関係
第5章 市場規模と成長予測(メガワット)
- データセンター規模別
- 大規模
- 大規模
- 中規模
- メガ
- 小規模
- ティアタイプ別
- ティア1および2
- ティア3
- ティア4
- データセンタータイプ別
- ハイパースケール/自社建設
- エンタープライズ/エッジ
- コロケーション
- 未利用
- 稼働中
- 小売コロケーション
- ホールセールコロケーション
- エンドユーザー別
- BFSI
- ITおよびITES
- 電子商取引
- 政府機関
- 製造業
- メディアとエンターテイメント
- 通信
- その他のエンドユーザー
- ホットスポット別
- ミラノ
- ジェノバ
- その他のイタリア地域
第6章 競合情勢
- 市場集中度
- 戦略的動向
- 市場シェア分析
- 企業プロファイル
- Telecom Italia S.p.A.
- IBM Corporation
- Data4 Group S.A.S.
- Google LLC
- Microsoft Corporation
- Retelit S.p.A.
- STACK Infrastructure, Inc.
- CloudHQ, LLC
- Vantage Data Centers, LLC
- ReeVo S.p.A.
- Equinix, Inc.
- Aruba S.p.A.
- Cloudflare, Inc.
- Eni S.p.A.
- Oracle Corporation
- Digital Realty Trust, Inc.
- Amazon Web Services, Inc.
- CyrusOne LLC
- Iron Mountain Inc.
- Irideos S.p.A.

