|
|
市場調査レポート
商品コード
1414771
植物性ミルク市場:ミルクタイプ別、流通チャネル別、エンドユーザー別:世界の機会分析と産業予測、2023年~2032年Plant-based Milk Market By Milk Type, By Distribution Channel, By End-User : Global Opportunity Analysis and Industry Forecast, 2023-2032 |
||||||
|
|
|||||||
|
|||||||


| 植物性ミルク市場:ミルクタイプ別、流通チャネル別、エンドユーザー別:世界の機会分析と産業予測、2023年~2032年 |
|
出版日: 2023年11月30日
発行: Allied Market Research
ページ情報: 英文 323 Pages
納期: 2~3営業日
|

- 全表示
- 概要
- 図表
- 目次
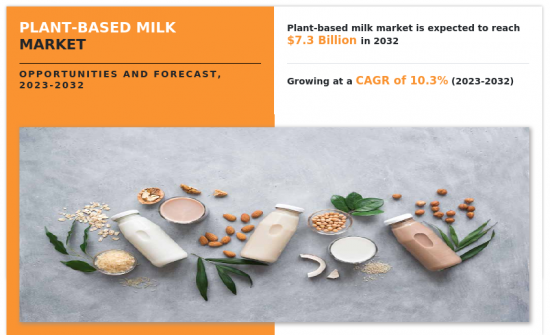
植物性ミルク市場の2022年の市場規模は28億米ドルで、2023年から2032年までのCAGRは10.3%で成長し、2032年には73億米ドルに達すると推定されます。
乳業が環境に与える影響に対する懸念の高まりが、植物性ミルクの人気上昇につながっています。酪農産業はしばしば森林破壊と関連しており、家畜の放牧地を作ったり飼料作物を栽培するために土地が伐採されるからです。森林伐採は生物多様性の損失を招き、大気中に大量の二酸化炭素を放出します。その点、植物由来の代替ミルクは通常、土地のフットプリントが小さく、大規模な森林伐採を必要としないです。さらに、酪農を含む畜産は温室効果ガス排出の主な原因となっています。特に牛は、気候変動に大きく影響する強力な温室効果ガスであるメタンを生産します。従来の酪農は、家畜の水分補給、洗浄、飼料生産のための作物灌漑に大量の水を必要とします。一方、植物由来のミルク生産は、主に植物栽培に依存しているため、一般的にウォーターフットプリントが低く、畜産に比べて必要な水の量が少ないです。このため、特に水不足に直面している地域では、植物性ミルクはより持続可能な選択肢となります。
植物性代替ミルクは、味や食感が年々改善されてきているが、消費者の中には、乳製品を使ったミルクと比較して、まだ魅力に欠けると感じる人もいます。植物性ミルクは、以下のようなさまざまな原料から作られています。
大豆、アーモンド、オート麦、米、ココナッツなど、さまざまな原料から作られており、それぞれに独特の味があります。幅広い嗜好を満足させる味を見つけるのは課題です。さらに、乳製品のミルクはクリーミーで滑らかなテクスチャーを持っているが、植物由来の成分で再現するのは難しいです。同様の食感を実現することは、特定の植物性ミルクにとって特に難しい課題です。例えば、アーモンドミルクは乳製品ミルクに比べて薄く、クリーミーさに欠けることがあります。テクスチャーの違いは全体的な官能体験に影響し、消費者の期待に添えない場合もあります。口当たり、つまり製品を摂取する際に口の中で感じる感覚や質感は、植物由来の代替ミルクでは異なる場合があります。消費者によっては、特定の植物性ミルクに粒々感やチョーキーな口当たりを感じることがあり、これはあまり好ましくない場合があります。さらに、植物性ミルクには乳製品とは異なる独特の後味がある場合があり、これは消費者によっては敬遠されることもあります。
豆乳、アーモンドミルク、オートミールミルクなど、人気のある植物性ミルクは広く販売されているが、新しくエキサイティングなフレーバーを導入する余地はあります。企業は、スパイス、果物、天然甘味料などの原料を試して、消費者の嗜好に訴えるユニークな風味を作り出すことができます。例えば、抹茶、ウコン、エキゾチックフルーツなどのフレーバーを導入すれば、斬新な味覚体験を求める消費者を惹きつけることができます。さらに、植物性乳製品は食感や口当たりが異なることが多いです。企業は、濃厚さ、クリーミーさ、泡立ちの良さが異なる製品を開発することで、イノベーションを起こすことができます。これによって、コーヒー、シリアル、料理のニーズに応じて異なるテクスチャーを好む消費者に対応することができます。例えば、スペシャルティコーヒー飲料用に泡立ちやすい植物性ミルクを作れば、コーヒーショップ業界の需要拡大を狙うことができます。企業は、植物性乳製品に特定の栄養ニーズを満たすための追加栄養素を強化することに重点を置くことができます。
COVID-19パンデミックは植物性ミルク市場に大きな影響を与えました。植物性ミルク市場は、以下のような要因によって着実な成長を遂げています。
健康意識、環境問題、食事制限。パンデミック(世界的大流行)の最中、人々が健康と幸福により注目するようになり、植物性ミルクを含む植物性代替食品への関心が高まった。こうした消費者の需要の高まりにより、多くの植物性ミルク・ブランドの売上が急増しました。さらに、他のセクターと同様、植物性ミルク業界もパンデミックによるサプライチェーン上の課題に直面しました。輸送の制限、封鎖措置、原材料の入手困難は、植物性乳製品の生産と流通に影響を与えました。これらの要因により、製品の一時的な不足や入手の遅れが生じました。ロックダウンや社会的距離を置く措置がとられたことで、消費者の購買パターンは大きく変化しました。多くの人々がオンラインショッピングを始め、食料品をeコマースプラットフォームに頼るようになった。このシフトは、強力なオンライン流通網を持つ既存の植物性ミルクブランドに有利だった。しかし、実店舗や外食チャネルに大きく依存していた小規模ブランドやローカルブランドは、より大きな課題に直面しました。
目次
第1章 イントロダクション
第2章 エグゼクティブサマリー
第3章 市場概要
- 市場の定義と範囲
- 主な調査結果
- 影響要因
- 主な投資機会
- ポーターのファイブフォース分析
- 市場力学
- 促進要因
- 抑制要因
- 機会
- 市場シェア分析
- バリューチェーン分析
- 規制ガイドライン
- 主要規制分析
- 特許情勢
第4章 植物性ミルク市場:ミルクタイプ別
- 概要
- アーモンド
- 大豆
- 米
- オート麦
- ココナッツ
- その他
第5章 植物性ミルク市場:流通チャネル別
- 概要
- オンライン
- スーパーマーケット
- コンビニエンスストア
第6章 植物性ミルク市場:エンドユーザー別
- 概要
- 小売/家庭用
- 外食産業
- 飲食品産業
第7章 植物性ミルク市場:地域別
- 概要
- 北米
- 米国
- カナダ
- メキシコ
- 欧州
- ドイツ
- 英国
- フランス
- スペイン
- イタリア
- その他
- アジア太平洋
- 中国
- 日本
- インド
- 韓国
- オーストラリア
- その他
- ラテンアメリカ・中東・アフリカ
- ブラジル
- UAE
- サウジアラビア
- 南アフリカ
- その他
第8章 競争情勢
- イントロダクション
- 主要成功戦略
- 主要10社の製品マッピング
- 競合ダッシュボード
- 競合ヒートマップ
- 主要企業のポジショニング、2022年
第9章 企業プロファイル
- Pacific Foods of Oregon, Inc.
- The Hain Celestial Group Inc.
- Edward & Sons
- Earth's Own Food Company Inc.
- Goya Foods, Inc.
- Mc Cormick & Co.
- SunOpta Inc.
- Chef's Choice Food Manufacturer Company Limited
- The Hershey Company
- Vitasoy International Holdings Limited
LIST OF TABLES
- TABLE 01. GLOBAL PLANT-BASED MILK MARKET, BY MILK TYPE, 2022-2032 ($MILLION)
- TABLE 02. PLANT-BASED MILK MARKET FOR ALMOND, BY REGION, 2022-2032 ($MILLION)
- TABLE 03. PLANT-BASED MILK MARKET FOR SOY, BY REGION, 2022-2032 ($MILLION)
- TABLE 04. PLANT-BASED MILK MARKET FOR RICE, BY REGION, 2022-2032 ($MILLION)
- TABLE 05. PLANT-BASED MILK MARKET FOR OAT, BY REGION, 2022-2032 ($MILLION)
- TABLE 06. PLANT-BASED MILK MARKET FOR COCONUT, BY REGION, 2022-2032 ($MILLION)
- TABLE 07. PLANT-BASED MILK MARKET FOR OTHERS, BY REGION, 2022-2032 ($MILLION)
- TABLE 08. GLOBAL PLANT-BASED MILK MARKET, BY DISTRIBUTION CHANNEL, 2022-2032 ($MILLION)
- TABLE 09. PLANT-BASED MILK MARKET FOR ONLINE, BY REGION, 2022-2032 ($MILLION)
- TABLE 10. PLANT-BASED MILK MARKET FOR SUPERMARKET, BY REGION, 2022-2032 ($MILLION)
- TABLE 11. PLANT-BASED MILK MARKET FOR CONVENIENCE STORES, BY REGION, 2022-2032 ($MILLION)
- TABLE 12. GLOBAL PLANT-BASED MILK MARKET, BY END-USER, 2022-2032 ($MILLION)
- TABLE 13. PLANT-BASED MILK MARKET FOR RETAIL/HOUSEHOLD, BY REGION, 2022-2032 ($MILLION)
- TABLE 14. PLANT-BASED MILK MARKET FOR FOODSERVICES INDUSTRY, BY REGION, 2022-2032 ($MILLION)
- TABLE 15. PLANT-BASED MILK MARKET FOR FOOD AND BEVERAGE INDUSTRY, BY REGION, 2022-2032 ($MILLION)
- TABLE 16. PLANT-BASED MILK MARKET, BY REGION, 2022-2032 ($MILLION)
- TABLE 17. NORTH AMERICA PLANT-BASED MILK MARKET, BY MILK TYPE, 2022-2032 ($MILLION)
- TABLE 18. NORTH AMERICA PLANT-BASED MILK MARKET, BY DISTRIBUTION CHANNEL, 2022-2032 ($MILLION)
- TABLE 19. NORTH AMERICA PLANT-BASED MILK MARKET, BY END-USER, 2022-2032 ($MILLION)
- TABLE 20. NORTH AMERICA PLANT-BASED MILK MARKET, BY COUNTRY, 2022-2032 ($MILLION)
- TABLE 21. U.S. PLANT-BASED MILK MARKET, BY MILK TYPE, 2022-2032 ($MILLION)
- TABLE 22. U.S. PLANT-BASED MILK MARKET, BY DISTRIBUTION CHANNEL, 2022-2032 ($MILLION)
- TABLE 23. U.S. PLANT-BASED MILK MARKET, BY END-USER, 2022-2032 ($MILLION)
- TABLE 24. CANADA PLANT-BASED MILK MARKET, BY MILK TYPE, 2022-2032 ($MILLION)
- TABLE 25. CANADA PLANT-BASED MILK MARKET, BY DISTRIBUTION CHANNEL, 2022-2032 ($MILLION)
- TABLE 26. CANADA PLANT-BASED MILK MARKET, BY END-USER, 2022-2032 ($MILLION)
- TABLE 27. MEXICO PLANT-BASED MILK MARKET, BY MILK TYPE, 2022-2032 ($MILLION)
- TABLE 28. MEXICO PLANT-BASED MILK MARKET, BY DISTRIBUTION CHANNEL, 2022-2032 ($MILLION)
- TABLE 29. MEXICO PLANT-BASED MILK MARKET, BY END-USER, 2022-2032 ($MILLION)
- TABLE 30. EUROPE PLANT-BASED MILK MARKET, BY MILK TYPE, 2022-2032 ($MILLION)
- TABLE 31. EUROPE PLANT-BASED MILK MARKET, BY DISTRIBUTION CHANNEL, 2022-2032 ($MILLION)
- TABLE 32. EUROPE PLANT-BASED MILK MARKET, BY END-USER, 2022-2032 ($MILLION)
- TABLE 33. EUROPE PLANT-BASED MILK MARKET, BY COUNTRY, 2022-2032 ($MILLION)
- TABLE 34. GERMANY PLANT-BASED MILK MARKET, BY MILK TYPE, 2022-2032 ($MILLION)
- TABLE 35. GERMANY PLANT-BASED MILK MARKET, BY DISTRIBUTION CHANNEL, 2022-2032 ($MILLION)
- TABLE 36. GERMANY PLANT-BASED MILK MARKET, BY END-USER, 2022-2032 ($MILLION)
- TABLE 37. UK PLANT-BASED MILK MARKET, BY MILK TYPE, 2022-2032 ($MILLION)
- TABLE 38. UK PLANT-BASED MILK MARKET, BY DISTRIBUTION CHANNEL, 2022-2032 ($MILLION)
- TABLE 39. UK PLANT-BASED MILK MARKET, BY END-USER, 2022-2032 ($MILLION)
- TABLE 40. FRANCE PLANT-BASED MILK MARKET, BY MILK TYPE, 2022-2032 ($MILLION)
- TABLE 41. FRANCE PLANT-BASED MILK MARKET, BY DISTRIBUTION CHANNEL, 2022-2032 ($MILLION)
- TABLE 42. FRANCE PLANT-BASED MILK MARKET, BY END-USER, 2022-2032 ($MILLION)
- TABLE 43. SPAIN PLANT-BASED MILK MARKET, BY MILK TYPE, 2022-2032 ($MILLION)
- TABLE 44. SPAIN PLANT-BASED MILK MARKET, BY DISTRIBUTION CHANNEL, 2022-2032 ($MILLION)
- TABLE 45. SPAIN PLANT-BASED MILK MARKET, BY END-USER, 2022-2032 ($MILLION)
- TABLE 46. ITALY PLANT-BASED MILK MARKET, BY MILK TYPE, 2022-2032 ($MILLION)
- TABLE 47. ITALY PLANT-BASED MILK MARKET, BY DISTRIBUTION CHANNEL, 2022-2032 ($MILLION)
- TABLE 48. ITALY PLANT-BASED MILK MARKET, BY END-USER, 2022-2032 ($MILLION)
- TABLE 49. REST OF EUROPE PLANT-BASED MILK MARKET, BY MILK TYPE, 2022-2032 ($MILLION)
- TABLE 50. REST OF EUROPE PLANT-BASED MILK MARKET, BY DISTRIBUTION CHANNEL, 2022-2032 ($MILLION)
- TABLE 51. REST OF EUROPE PLANT-BASED MILK MARKET, BY END-USER, 2022-2032 ($MILLION)
- TABLE 52. ASIA-PACIFIC PLANT-BASED MILK MARKET, BY MILK TYPE, 2022-2032 ($MILLION)
- TABLE 53. ASIA-PACIFIC PLANT-BASED MILK MARKET, BY DISTRIBUTION CHANNEL, 2022-2032 ($MILLION)
- TABLE 54. ASIA-PACIFIC PLANT-BASED MILK MARKET, BY END-USER, 2022-2032 ($MILLION)
- TABLE 55. ASIA-PACIFIC PLANT-BASED MILK MARKET, BY COUNTRY, 2022-2032 ($MILLION)
- TABLE 56. CHINA PLANT-BASED MILK MARKET, BY MILK TYPE, 2022-2032 ($MILLION)
- TABLE 57. CHINA PLANT-BASED MILK MARKET, BY DISTRIBUTION CHANNEL, 2022-2032 ($MILLION)
- TABLE 58. CHINA PLANT-BASED MILK MARKET, BY END-USER, 2022-2032 ($MILLION)
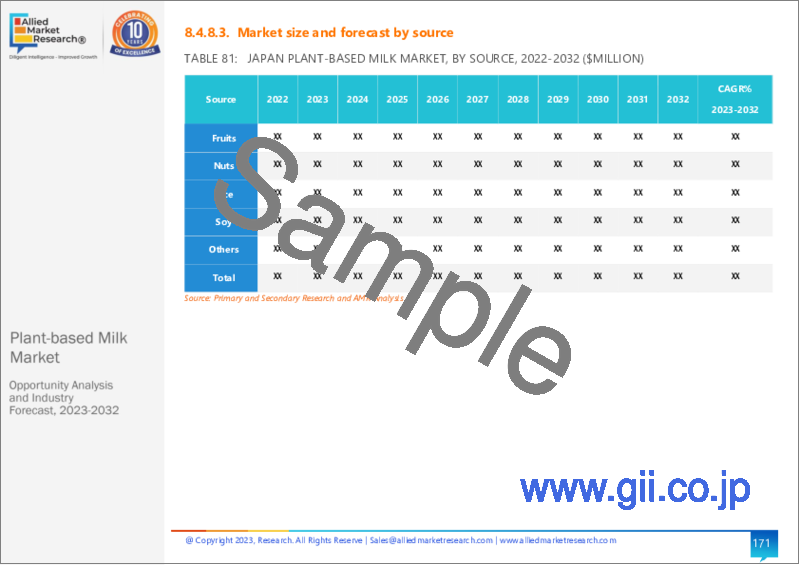
- TABLE 59. JAPAN PLANT-BASED MILK MARKET, BY MILK TYPE, 2022-2032 ($MILLION)
- TABLE 60. JAPAN PLANT-BASED MILK MARKET, BY DISTRIBUTION CHANNEL, 2022-2032 ($MILLION)
- TABLE 61. JAPAN PLANT-BASED MILK MARKET, BY END-USER, 2022-2032 ($MILLION)
- TABLE 62. INDIA PLANT-BASED MILK MARKET, BY MILK TYPE, 2022-2032 ($MILLION)
- TABLE 63. INDIA PLANT-BASED MILK MARKET, BY DISTRIBUTION CHANNEL, 2022-2032 ($MILLION)
- TABLE 64. INDIA PLANT-BASED MILK MARKET, BY END-USER, 2022-2032 ($MILLION)
- TABLE 65. SOUTH KOREA PLANT-BASED MILK MARKET, BY MILK TYPE, 2022-2032 ($MILLION)
- TABLE 66. SOUTH KOREA PLANT-BASED MILK MARKET, BY DISTRIBUTION CHANNEL, 2022-2032 ($MILLION)
- TABLE 67. SOUTH KOREA PLANT-BASED MILK MARKET, BY END-USER, 2022-2032 ($MILLION)
- TABLE 68. AUSTRALIA PLANT-BASED MILK MARKET, BY MILK TYPE, 2022-2032 ($MILLION)
- TABLE 69. AUSTRALIA PLANT-BASED MILK MARKET, BY DISTRIBUTION CHANNEL, 2022-2032 ($MILLION)
- TABLE 70. AUSTRALIA PLANT-BASED MILK MARKET, BY END-USER, 2022-2032 ($MILLION)
- TABLE 71. REST OF ASIA-PACIFIC PLANT-BASED MILK MARKET, BY MILK TYPE, 2022-2032 ($MILLION)
- TABLE 72. REST OF ASIA-PACIFIC PLANT-BASED MILK MARKET, BY DISTRIBUTION CHANNEL, 2022-2032 ($MILLION)
- TABLE 73. REST OF ASIA-PACIFIC PLANT-BASED MILK MARKET, BY END-USER, 2022-2032 ($MILLION)
- TABLE 74. LAMEA PLANT-BASED MILK MARKET, BY MILK TYPE, 2022-2032 ($MILLION)
- TABLE 75. LAMEA PLANT-BASED MILK MARKET, BY DISTRIBUTION CHANNEL, 2022-2032 ($MILLION)
- TABLE 76. LAMEA PLANT-BASED MILK MARKET, BY END-USER, 2022-2032 ($MILLION)
- TABLE 77. LAMEA PLANT-BASED MILK MARKET, BY COUNTRY, 2022-2032 ($MILLION)
- TABLE 78. BRAZIL PLANT-BASED MILK MARKET, BY MILK TYPE, 2022-2032 ($MILLION)
- TABLE 79. BRAZIL PLANT-BASED MILK MARKET, BY DISTRIBUTION CHANNEL, 2022-2032 ($MILLION)
- TABLE 80. BRAZIL PLANT-BASED MILK MARKET, BY END-USER, 2022-2032 ($MILLION)
- TABLE 81. UAE PLANT-BASED MILK MARKET, BY MILK TYPE, 2022-2032 ($MILLION)
- TABLE 82. UAE PLANT-BASED MILK MARKET, BY DISTRIBUTION CHANNEL, 2022-2032 ($MILLION)
- TABLE 83. UAE PLANT-BASED MILK MARKET, BY END-USER, 2022-2032 ($MILLION)
- TABLE 84. SAUDI ARABIA PLANT-BASED MILK MARKET, BY MILK TYPE, 2022-2032 ($MILLION)
- TABLE 85. SAUDI ARABIA PLANT-BASED MILK MARKET, BY DISTRIBUTION CHANNEL, 2022-2032 ($MILLION)
- TABLE 86. SAUDI ARABIA PLANT-BASED MILK MARKET, BY END-USER, 2022-2032 ($MILLION)
- TABLE 87. SOUTH AFRICA PLANT-BASED MILK MARKET, BY MILK TYPE, 2022-2032 ($MILLION)
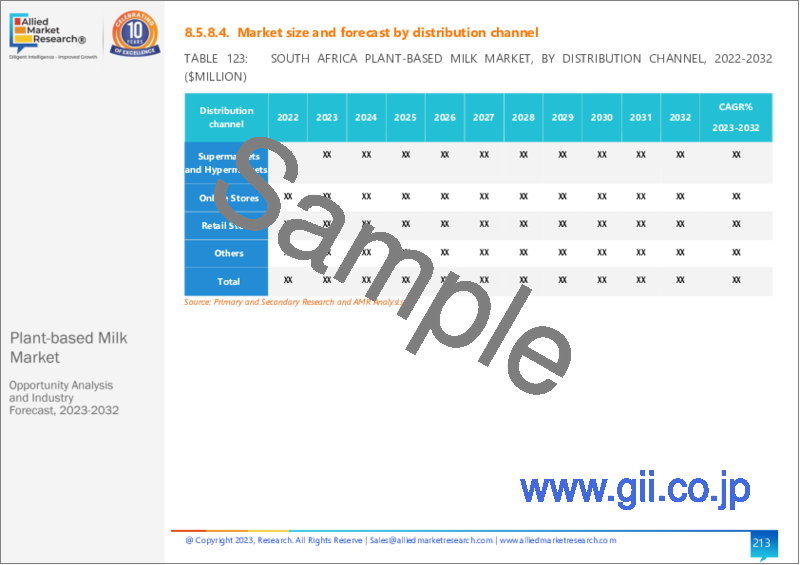
- TABLE 88. SOUTH AFRICA PLANT-BASED MILK MARKET, BY DISTRIBUTION CHANNEL, 2022-2032 ($MILLION)
- TABLE 89. SOUTH AFRICA PLANT-BASED MILK MARKET, BY END-USER, 2022-2032 ($MILLION)
- TABLE 90. REST OF LAMEA PLANT-BASED MILK MARKET, BY MILK TYPE, 2022-2032 ($MILLION)
- TABLE 91. REST OF LAMEA PLANT-BASED MILK MARKET, BY DISTRIBUTION CHANNEL, 2022-2032 ($MILLION)
- TABLE 92. REST OF LAMEA PLANT-BASED MILK MARKET, BY END-USER, 2022-2032 ($MILLION)
- TABLE 93. PACIFIC FOODS OF OREGON, INC.: KEY EXECUTIVES
- TABLE 94. PACIFIC FOODS OF OREGON, INC.: COMPANY SNAPSHOT
- TABLE 95. THE HAIN CELESTIAL GROUP INC.: KEY EXECUTIVES
- TABLE 96. THE HAIN CELESTIAL GROUP INC.: COMPANY SNAPSHOT
- TABLE 97. EDWARD & SONS: KEY EXECUTIVES
- TABLE 98. EDWARD & SONS: COMPANY SNAPSHOT
- TABLE 99. EARTH'S OWN FOOD COMPANY INC.: KEY EXECUTIVES
- TABLE 100. EARTH'S OWN FOOD COMPANY INC.: COMPANY SNAPSHOT
- TABLE 101. GOYA FOODS, INC.: KEY EXECUTIVES
- TABLE 102. GOYA FOODS, INC.: COMPANY SNAPSHOT
- TABLE 103. MC CORMICK & CO.: KEY EXECUTIVES
- TABLE 104. MC CORMICK & CO.: COMPANY SNAPSHOT
- TABLE 105. SUNOPTA INC.: KEY EXECUTIVES
- TABLE 106. SUNOPTA INC.: COMPANY SNAPSHOT
- TABLE 107. CHEF'S CHOICE FOOD MANUFACTURER COMPANY LIMITED: KEY EXECUTIVES
- TABLE 108. CHEF'S CHOICE FOOD MANUFACTURER COMPANY LIMITED: COMPANY SNAPSHOT
- TABLE 109. THE HERSHEY COMPANY: KEY EXECUTIVES
- TABLE 110. THE HERSHEY COMPANY: COMPANY SNAPSHOT
- TABLE 111. VITASOY INTERNATIONAL HOLDINGS LIMITED: KEY EXECUTIVES
- TABLE 112. VITASOY INTERNATIONAL HOLDINGS LIMITED: COMPANY SNAPSHOT
LIST OF FIGURES
- FIGURE 01. PLANT-BASED MILK MARKET, 2022-2032
- FIGURE 02. SEGMENTATION OF PLANT-BASED MILK MARKET,2022-2032
- FIGURE 03. TOP IMPACTING FACTORS IN PLANT-BASED MILK MARKET
- FIGURE 04. TOP INVESTMENT POCKETS IN PLANT-BASED MILK MARKET (2023-2032)
- FIGURE 05. BARGAINING POWER OF SUPPLIERS
- FIGURE 06. BARGAINING POWER OF BUYERS
- FIGURE 07. THREAT OF SUBSTITUTION
- FIGURE 08. THREAT OF SUBSTITUTION
- FIGURE 09. COMPETITIVE RIVALRY
- FIGURE 10. GLOBAL PLANT-BASED MILK MARKET:DRIVERS, RESTRAINTS AND OPPORTUNITIES
- FIGURE 11. REGULATORY GUIDELINES: PLANT-BASED MILK MARKET
- FIGURE 12. IMPACT OF KEY REGULATION: PLANT-BASED MILK MARKET
- FIGURE 13. PATENT ANALYSIS BY COMPANY
- FIGURE 14. PATENT ANALYSIS BY COUNTRY
- FIGURE 15. PLANT-BASED MILK MARKET, BY MILK TYPE, 2022 AND 2032(%)
- FIGURE 16. COMPARATIVE SHARE ANALYSIS OF PLANT-BASED MILK MARKET FOR ALMOND, BY COUNTRY 2022 AND 2032(%)
- FIGURE 17. COMPARATIVE SHARE ANALYSIS OF PLANT-BASED MILK MARKET FOR SOY, BY COUNTRY 2022 AND 2032(%)
- FIGURE 18. COMPARATIVE SHARE ANALYSIS OF PLANT-BASED MILK MARKET FOR RICE, BY COUNTRY 2022 AND 2032(%)
- FIGURE 19. COMPARATIVE SHARE ANALYSIS OF PLANT-BASED MILK MARKET FOR OAT, BY COUNTRY 2022 AND 2032(%)
- FIGURE 20. COMPARATIVE SHARE ANALYSIS OF PLANT-BASED MILK MARKET FOR COCONUT, BY COUNTRY 2022 AND 2032(%)
- FIGURE 21. COMPARATIVE SHARE ANALYSIS OF PLANT-BASED MILK MARKET FOR OTHERS, BY COUNTRY 2022 AND 2032(%)
- FIGURE 22. PLANT-BASED MILK MARKET, BY DISTRIBUTION CHANNEL, 2022 AND 2032(%)
- FIGURE 23. COMPARATIVE SHARE ANALYSIS OF PLANT-BASED MILK MARKET FOR ONLINE, BY COUNTRY 2022 AND 2032(%)
- FIGURE 24. COMPARATIVE SHARE ANALYSIS OF PLANT-BASED MILK MARKET FOR SUPERMARKET, BY COUNTRY 2022 AND 2032(%)
- FIGURE 25. COMPARATIVE SHARE ANALYSIS OF PLANT-BASED MILK MARKET FOR CONVENIENCE STORES, BY COUNTRY 2022 AND 2032(%)
- FIGURE 26. PLANT-BASED MILK MARKET, BY END-USER, 2022 AND 2032(%)
- FIGURE 27. COMPARATIVE SHARE ANALYSIS OF PLANT-BASED MILK MARKET FOR RETAIL/HOUSEHOLD, BY COUNTRY 2022 AND 2032(%)
- FIGURE 28. COMPARATIVE SHARE ANALYSIS OF PLANT-BASED MILK MARKET FOR FOODSERVICES INDUSTRY, BY COUNTRY 2022 AND 2032(%)
- FIGURE 29. COMPARATIVE SHARE ANALYSIS OF PLANT-BASED MILK MARKET FOR FOOD AND BEVERAGE INDUSTRY, BY COUNTRY 2022 AND 2032(%)
- FIGURE 30. PLANT-BASED MILK MARKET BY REGION, 2022 AND 2032(%)
- FIGURE 31. U.S. PLANT-BASED MILK MARKET, 2022-2032 ($MILLION)
- FIGURE 32. CANADA PLANT-BASED MILK MARKET, 2022-2032 ($MILLION)
- FIGURE 33. MEXICO PLANT-BASED MILK MARKET, 2022-2032 ($MILLION)
- FIGURE 34. GERMANY PLANT-BASED MILK MARKET, 2022-2032 ($MILLION)
- FIGURE 35. UK PLANT-BASED MILK MARKET, 2022-2032 ($MILLION)
- FIGURE 36. FRANCE PLANT-BASED MILK MARKET, 2022-2032 ($MILLION)
- FIGURE 37. SPAIN PLANT-BASED MILK MARKET, 2022-2032 ($MILLION)
- FIGURE 38. ITALY PLANT-BASED MILK MARKET, 2022-2032 ($MILLION)
- FIGURE 39. REST OF EUROPE PLANT-BASED MILK MARKET, 2022-2032 ($MILLION)
- FIGURE 40. CHINA PLANT-BASED MILK MARKET, 2022-2032 ($MILLION)
- FIGURE 41. JAPAN PLANT-BASED MILK MARKET, 2022-2032 ($MILLION)
- FIGURE 42. INDIA PLANT-BASED MILK MARKET, 2022-2032 ($MILLION)
- FIGURE 43. SOUTH KOREA PLANT-BASED MILK MARKET, 2022-2032 ($MILLION)
- FIGURE 44. AUSTRALIA PLANT-BASED MILK MARKET, 2022-2032 ($MILLION)
- FIGURE 45. REST OF ASIA-PACIFIC PLANT-BASED MILK MARKET, 2022-2032 ($MILLION)
- FIGURE 46. BRAZIL PLANT-BASED MILK MARKET, 2022-2032 ($MILLION)
- FIGURE 47. UAE PLANT-BASED MILK MARKET, 2022-2032 ($MILLION)
- FIGURE 48. SAUDI ARABIA PLANT-BASED MILK MARKET, 2022-2032 ($MILLION)
- FIGURE 49. SOUTH AFRICA PLANT-BASED MILK MARKET, 2022-2032 ($MILLION)
- FIGURE 50. REST OF LAMEA PLANT-BASED MILK MARKET, 2022-2032 ($MILLION)
- FIGURE 51. PRODUCT MAPPING OF TOP 10 PLAYERS
- FIGURE 52. COMPETITIVE DASHBOARD
- FIGURE 53. COMPETITIVE HEATMAP: PLANT-BASED MILK MARKET
- FIGURE 54. TOP PLAYER POSITIONING, 2022
According to a new report published by Allied Market Research, titled, "Plant-based Milk Market," The plant-based milk market was valued at $2.8 billion in 2022, and is estimated to reach $7.3 billion by 2032, growing at a CAGR of 10.3% from 2023 to 2032.
Increasing concerns about the environmental impact of the dairy industry is leading to rising popularity of plant-based milk. The dairy industry is often associated with deforestation, as land is cleared to create pasture for livestock and to grow animal feed crops. Deforestation contributes to the loss of biodiversity and releases significant amounts of carbon dioxide into the atmosphere. On the contrary, plant-based milk alternatives typically have a smaller land footprint and do not require large-scale deforestation. Moreover, livestock farming, including dairy production, is a major contributor to greenhouse gas emissions. Cows, in particular, produce methane, a potent greenhouse gas that significantly contributes to climate change. Conventional dairy farming requires substantial amounts of water for livestock hydration, cleaning, and crop irrigation for feed production. On the contrary, plant-based milk production generally has a lower water footprint since it primarily relies on plant cultivation, which typically requires less water compared to animal agriculture. This makes plant-based milk a more sustainable choice, especially in regions facing water scarcity.
While plant-based milk alternatives have improved in taste and texture over the years, some consumers still find them less appealing compared to dairy milk. Plant-based milks are made from different sources such as soy, almond, oat, rice, and coconut, each with its own unique taste. Finding a flavor that can satisfy a broad range of preferences can be challenging. Moreover, dairy milk has a creamy and smooth texture that is difficult to replicate with plant-based ingredients. Achieving a similar texture is particularly challenging for certain plant-based milk varieties. For example, almond milk may be thinner and less creamy compared to dairy milk. Texture differences can affect the overall sensory experience and may not meet the expectations of some consumers. The mouthfeel, or the sensation and texture experienced in the mouth while consuming a product, can be different in plant-based milk alternatives. Some consumers may perceive a grainy or chalky mouthfeel in certain plant-based milks, which can be less desirable. In addition, plant-based milks may have distinct aftertastes that differ from dairy milk, which can be a turn-off for some consumers.
While popular plant-based milk options like soy, almond, and oat milk are widely available, there is room for introducing new and exciting flavors. Companies can experiment with ingredients like spices, fruits, and natural sweeteners to create unique flavor profiles that appeal to different consumer preferences. For example, introducing flavors like matcha, turmeric, or exotic fruits can attract consumers looking for novel taste experiences. Moreover, plant-based milk products often differ in terms of their texture and mouthfeel. Companies can innovate by developing products with varying thickness, creaminess, and frothing capabilities. This can help cater to consumers who prefer different textures for their coffee, cereal, or cooking needs. For instance, creating a froth-friendly plant-based milk for specialty coffee beverages can target the growing demand in the coffee shop industry. Companies can focus on fortifying plant-based milk products with additional nutrients to meet specific dietary needs.
The COVID-19 pandemic had a significant impact on the market for plant based milk market. The plant based milk market has been experiencing steady growth, driven by factors such as health consciousness, environmental concerns, and dietary restrictions. During the pandemic, as people focused more on their health and well-being, there was a rising interest in plant-based alternatives, including plant-based milk. This increased consumer demand resulted in a surge in sales for many plant-based milk brands. Moreover, like other sectors, the plant based milk industry faced challenges in its supply chains due to the pandemic. Restrictions on transportation, lockdown measures, and disruptions in the availability of raw materials impacted the production and distribution of plant-based milk products. These factors led to temporary shortages or delays in product availability. With lockdowns and social distancing measures in place, consumers' purchasing patterns shifted significantly. Many people began shopping online, relying on e-commerce platforms for their groceries. This shift favored established plant-based milk brands with strong online distribution networks. However, smaller or local brands that relied heavily on physical stores or foodservice channels faced more significant challenges.
The key players profiled in this report include: Pacific Foods of Oregon, Inc., The Hain Celestial Group Inc., Edward & Sons, Earth's Own Food Company Inc., Goya Foods, Mc Cormick & Co., Sunopta Inc., Chef's Choice Food Manufacturer Company Limited, The Hershey Company, Vitasoy International Holdings Limited, Turtle Mountain LLC, and Natura Foods. The market players are continuously striving to achieve a dominant position in this competitive market using strategies such as collaborations and acquisitions.
Key Benefits For Stakeholders
- This report provides a quantitative analysis of the market segments, current trends, estimations, and dynamics of the plant-based milk market analysis from 2022 to 2032 to identify the prevailing plant-based milk market opportunities.
- The market research is offered along with information related to key drivers, restraints, and opportunities.
- Porter's five forces analysis highlights the potency of buyers and suppliers to enable stakeholders make profit-oriented business decisions and strengthen their supplier-buyer network.
- In-depth analysis of the plant-based milk market segmentation assists to determine the prevailing market opportunities.
- Major countries in each region are mapped according to their revenue contribution to the global market.
- Market player positioning facilitates benchmarking and provides a clear understanding of the present position of the market players.
- The report includes the analysis of the regional as well as global plant-based milk market trends, key players, market segments, application areas, and market growth strategies.
Additional benefits you will get with this purchase are:
- Quarterly Update and* (only available with a corporate license, on listed price)
- 5 additional Company Profile of client Choice pre- or Post-purchase, as a free update.
- Free Upcoming Version on the Purchase of Five and Enterprise User License.
- 16 analyst hours of support* (post-purchase, if you find additional data requirements upon review of the report, you may receive support amounting to 16 analyst hours to solve questions, and post-sale queries)
- 15% Free Customization* (in case the scope or segment of the report does not match your requirements, 15% is equivalent to 3 working days of free work, applicable once)
- Free data Pack on the Five and Enterprise User License. (Excel version of the report)
- Free Updated report if the report is 6-12 months old or older.
- 24-hour priority response*
- Free Industry updates and white papers.
Possible Customization with this report (with additional cost and timeline, please talk to the sales executive to know more)
- Investment Opportunities
- Technology Trend Analysis
- Go To Market Strategy
- Regulatory Guidelines
- Strategic Recommedations
- Additional company profiles with specific to client's interest
- Additional country or region analysis- market size and forecast
- Criss-cross segment analysis- market size and forecast
- Expanded list for Company Profiles
- Historic market data
- Key player details (including location, contact details, supplier/vendor network etc. in excel format)
- Market share analysis of players at global/region/country level
- SWOT Analysis
Key Market Segments
By Milk Type
- Almond
- Soy
- Rice
- Oat
- Coconut
- Others
By Distribution Channel
- Online
- Supermarket
- Convenience Stores
By End-User
- Retail/Household
- Foodservices Industry
- Food and Beverage Industry
By Region
- North America
- U.S.
- Canada
- Mexico
- Europe
- Germany
- UK
- France
- Spain
- Italy
- Rest of Europe
- Asia-Pacific
- China
- Japan
- India
- South Korea
- Australia
- Rest of Asia-Pacific
- LAMEA
- Brazil
- UAE
- Saudi Arabia
- South Africa
- Rest of LAMEA
Key Market Players:
- Pacific Foods of Oregon, Inc.
- The Hain Celestial Group Inc.
- Edward & Sons
- Earth's Own Food Company Inc.
- Goya Foods, Inc.
- Mc Cormick & Co.
- SunOpta Inc.
- Chef's Choice Food Manufacturer Company Limited
- The Hershey Company
- Vitasoy International Holdings Limited
TABLE OF CONTENTS
CHAPTER 1: INTRODUCTION
- 1.1. Report description
- 1.2. Key market segments
- 1.3. Key benefits to the stakeholders
- 1.4. Research methodology
- 1.4.1. Primary research
- 1.4.2. Secondary research
- 1.4.3. Analyst tools and models
CHAPTER 2: EXECUTIVE SUMMARY
- 2.1. CXO Perspective
CHAPTER 3: MARKET OVERVIEW
- 3.1. Market definition and scope
- 3.2. Key findings
- 3.2.1. Top impacting factors
- 3.2.2. Top investment pockets
- 3.3. Porter's five forces analysis
- 3.4. Market dynamics
- 3.4.1. Drivers
- 3.4.2. Restraints
- 3.4.3. Opportunities
- 3.5. Market Share Analysis
- 3.6. Value Chain Analysis
- 3.7. Regulatory Guidelines
- 3.8. Key Regulation Analysis
- 3.9. Patent Landscape
CHAPTER 4: PLANT-BASED MILK MARKET, BY MILK TYPE
- 4.1. Overview
- 4.1.1. Market size and forecast
- 4.2. Almond
- 4.2.1. Key market trends, growth factors and opportunities
- 4.2.2. Market size and forecast, by region
- 4.2.3. Market share analysis by country
- 4.3. Soy
- 4.3.1. Key market trends, growth factors and opportunities
- 4.3.2. Market size and forecast, by region
- 4.3.3. Market share analysis by country
- 4.4. Rice
- 4.4.1. Key market trends, growth factors and opportunities
- 4.4.2. Market size and forecast, by region
- 4.4.3. Market share analysis by country
- 4.5. Oat
- 4.5.1. Key market trends, growth factors and opportunities
- 4.5.2. Market size and forecast, by region
- 4.5.3. Market share analysis by country
- 4.6. Coconut
- 4.6.1. Key market trends, growth factors and opportunities
- 4.6.2. Market size and forecast, by region
- 4.6.3. Market share analysis by country
- 4.7. Others
- 4.7.1. Key market trends, growth factors and opportunities
- 4.7.2. Market size and forecast, by region
- 4.7.3. Market share analysis by country
CHAPTER 5: PLANT-BASED MILK MARKET, BY DISTRIBUTION CHANNEL
- 5.1. Overview
- 5.1.1. Market size and forecast
- 5.2. Online
- 5.2.1. Key market trends, growth factors and opportunities
- 5.2.2. Market size and forecast, by region
- 5.2.3. Market share analysis by country
- 5.3. Supermarket
- 5.3.1. Key market trends, growth factors and opportunities
- 5.3.2. Market size and forecast, by region
- 5.3.3. Market share analysis by country
- 5.4. Convenience Stores
- 5.4.1. Key market trends, growth factors and opportunities
- 5.4.2. Market size and forecast, by region
- 5.4.3. Market share analysis by country
CHAPTER 6: PLANT-BASED MILK MARKET, BY END-USER
- 6.1. Overview
- 6.1.1. Market size and forecast
- 6.2. Retail/Household
- 6.2.1. Key market trends, growth factors and opportunities
- 6.2.2. Market size and forecast, by region
- 6.2.3. Market share analysis by country
- 6.3. Foodservices Industry
- 6.3.1. Key market trends, growth factors and opportunities
- 6.3.2. Market size and forecast, by region
- 6.3.3. Market share analysis by country
- 6.4. Food and Beverage Industry
- 6.4.1. Key market trends, growth factors and opportunities
- 6.4.2. Market size and forecast, by region
- 6.4.3. Market share analysis by country
CHAPTER 7: PLANT-BASED MILK MARKET, BY REGION
- 7.1. Overview
- 7.1.1. Market size and forecast By Region
- 7.2. North America
- 7.2.1. Key market trends, growth factors and opportunities
- 7.2.2. Market size and forecast, by Milk Type
- 7.2.3. Market size and forecast, by Distribution Channel
- 7.2.4. Market size and forecast, by End-User
- 7.2.5. Market size and forecast, by country
- 7.2.5.1. U.S.
- 7.2.5.1.1. Market size and forecast, by Milk Type
- 7.2.5.1.2. Market size and forecast, by Distribution Channel
- 7.2.5.1.3. Market size and forecast, by End-User
- 7.2.5.2. Canada
- 7.2.5.2.1. Market size and forecast, by Milk Type
- 7.2.5.2.2. Market size and forecast, by Distribution Channel
- 7.2.5.2.3. Market size and forecast, by End-User
- 7.2.5.3. Mexico
- 7.2.5.3.1. Market size and forecast, by Milk Type
- 7.2.5.3.2. Market size and forecast, by Distribution Channel
- 7.2.5.3.3. Market size and forecast, by End-User
- 7.3. Europe
- 7.3.1. Key market trends, growth factors and opportunities
- 7.3.2. Market size and forecast, by Milk Type
- 7.3.3. Market size and forecast, by Distribution Channel
- 7.3.4. Market size and forecast, by End-User
- 7.3.5. Market size and forecast, by country
- 7.3.5.1. Germany
- 7.3.5.1.1. Market size and forecast, by Milk Type
- 7.3.5.1.2. Market size and forecast, by Distribution Channel
- 7.3.5.1.3. Market size and forecast, by End-User
- 7.3.5.2. UK
- 7.3.5.2.1. Market size and forecast, by Milk Type
- 7.3.5.2.2. Market size and forecast, by Distribution Channel
- 7.3.5.2.3. Market size and forecast, by End-User
- 7.3.5.3. France
- 7.3.5.3.1. Market size and forecast, by Milk Type
- 7.3.5.3.2. Market size and forecast, by Distribution Channel
- 7.3.5.3.3. Market size and forecast, by End-User
- 7.3.5.4. Spain
- 7.3.5.4.1. Market size and forecast, by Milk Type
- 7.3.5.4.2. Market size and forecast, by Distribution Channel
- 7.3.5.4.3. Market size and forecast, by End-User
- 7.3.5.5. Italy
- 7.3.5.5.1. Market size and forecast, by Milk Type
- 7.3.5.5.2. Market size and forecast, by Distribution Channel
- 7.3.5.5.3. Market size and forecast, by End-User
- 7.3.5.6. Rest of Europe
- 7.3.5.6.1. Market size and forecast, by Milk Type
- 7.3.5.6.2. Market size and forecast, by Distribution Channel
- 7.3.5.6.3. Market size and forecast, by End-User
- 7.4. Asia-Pacific
- 7.4.1. Key market trends, growth factors and opportunities
- 7.4.2. Market size and forecast, by Milk Type
- 7.4.3. Market size and forecast, by Distribution Channel
- 7.4.4. Market size and forecast, by End-User
- 7.4.5. Market size and forecast, by country
- 7.4.5.1. China
- 7.4.5.1.1. Market size and forecast, by Milk Type
- 7.4.5.1.2. Market size and forecast, by Distribution Channel
- 7.4.5.1.3. Market size and forecast, by End-User
- 7.4.5.2. Japan
- 7.4.5.2.1. Market size and forecast, by Milk Type
- 7.4.5.2.2. Market size and forecast, by Distribution Channel
- 7.4.5.2.3. Market size and forecast, by End-User
- 7.4.5.3. India
- 7.4.5.3.1. Market size and forecast, by Milk Type
- 7.4.5.3.2. Market size and forecast, by Distribution Channel
- 7.4.5.3.3. Market size and forecast, by End-User
- 7.4.5.4. South Korea
- 7.4.5.4.1. Market size and forecast, by Milk Type
- 7.4.5.4.2. Market size and forecast, by Distribution Channel
- 7.4.5.4.3. Market size and forecast, by End-User
- 7.4.5.5. Australia
- 7.4.5.5.1. Market size and forecast, by Milk Type
- 7.4.5.5.2. Market size and forecast, by Distribution Channel
- 7.4.5.5.3. Market size and forecast, by End-User
- 7.4.5.6. Rest of Asia-Pacific
- 7.4.5.6.1. Market size and forecast, by Milk Type
- 7.4.5.6.2. Market size and forecast, by Distribution Channel
- 7.4.5.6.3. Market size and forecast, by End-User
- 7.5. LAMEA
- 7.5.1. Key market trends, growth factors and opportunities
- 7.5.2. Market size and forecast, by Milk Type
- 7.5.3. Market size and forecast, by Distribution Channel
- 7.5.4. Market size and forecast, by End-User
- 7.5.5. Market size and forecast, by country
- 7.5.5.1. Brazil
- 7.5.5.1.1. Market size and forecast, by Milk Type
- 7.5.5.1.2. Market size and forecast, by Distribution Channel
- 7.5.5.1.3. Market size and forecast, by End-User
- 7.5.5.2. UAE
- 7.5.5.2.1. Market size and forecast, by Milk Type
- 7.5.5.2.2. Market size and forecast, by Distribution Channel
- 7.5.5.2.3. Market size and forecast, by End-User
- 7.5.5.3. Saudi Arabia
- 7.5.5.3.1. Market size and forecast, by Milk Type
- 7.5.5.3.2. Market size and forecast, by Distribution Channel
- 7.5.5.3.3. Market size and forecast, by End-User
- 7.5.5.4. South Africa
- 7.5.5.4.1. Market size and forecast, by Milk Type
- 7.5.5.4.2. Market size and forecast, by Distribution Channel
- 7.5.5.4.3. Market size and forecast, by End-User
- 7.5.5.5. Rest of LAMEA
- 7.5.5.5.1. Market size and forecast, by Milk Type
- 7.5.5.5.2. Market size and forecast, by Distribution Channel
- 7.5.5.5.3. Market size and forecast, by End-User
CHAPTER 8: COMPETITIVE LANDSCAPE
- 8.1. Introduction
- 8.2. Top winning strategies
- 8.3. Product mapping of top 10 player
- 8.4. Competitive dashboard
- 8.5. Competitive heatmap
- 8.6. Top player positioning, 2022
CHAPTER 9: COMPANY PROFILES
- 9.1. Pacific Foods of Oregon, Inc.
- 9.1.1. Company overview
- 9.1.2. Key executives
- 9.1.3. Company snapshot
- 9.2. The Hain Celestial Group Inc.
- 9.2.1. Company overview
- 9.2.2. Key executives
- 9.2.3. Company snapshot
- 9.3. Edward & Sons
- 9.3.1. Company overview
- 9.3.2. Key executives
- 9.3.3. Company snapshot
- 9.4. Earth's Own Food Company Inc.
- 9.4.1. Company overview
- 9.4.2. Key executives
- 9.4.3. Company snapshot
- 9.5. Goya Foods, Inc.
- 9.5.1. Company overview
- 9.5.2. Key executives
- 9.5.3. Company snapshot
- 9.6. Mc Cormick & Co.
- 9.6.1. Company overview
- 9.6.2. Key executives
- 9.6.3. Company snapshot
- 9.7. SunOpta Inc.
- 9.7.1. Company overview
- 9.7.2. Key executives
- 9.7.3. Company snapshot
- 9.8. Chef's Choice Food Manufacturer Company Limited
- 9.8.1. Company overview
- 9.8.2. Key executives
- 9.8.3. Company snapshot
- 9.9. The Hershey Company
- 9.9.1. Company overview
- 9.9.2. Key executives
- 9.9.3. Company snapshot
- 9.10. Vitasoy International Holdings Limited
- 9.10.1. Company overview
- 9.10.2. Key executives
- 9.10.3. Company snapshot
