|
|
市場調査レポート
商品コード
1365630
食品テクスチャー市場:タイプ別、用途別、製品別:世界の機会分析と産業予測、2023~2032年Food Texture Market By Type, By Application, By Product : Global Opportunity Analysis and Industry Forecast, 2023-2032 |
||||||
|
|
|||||||
|
|||||||


| 食品テクスチャー市場:タイプ別、用途別、製品別:世界の機会分析と産業予測、2023~2032年 |
|
出版日: 2023年07月01日
発行: Allied Market Research
ページ情報: 英文 378 Pages
納期: 2~3営業日
|

- 全表示
- 概要
- 図表
- 目次
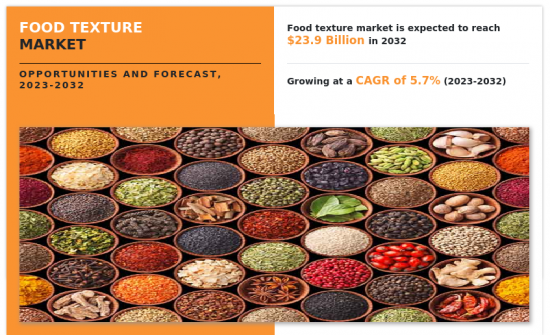
Allied Market Researchの最新レポート「食品テクスチャー市場」によると、食品テクスチャー市場は2022年に138億米ドルと評価され、2023年から2032年にかけてCAGR 5.7%で成長し、2032年には239億米ドルに達すると推定されます。
高い競争を特徴とする複雑な食品分野で企業が市場のトップに立つためには、製品の差別化が不可欠です。食品メーカーにとって、独特の食体験を提供するユニークな製品を開発する可能性は、食品テクスチャーの改良によってもたらされます。企業は、製品に特別な食品テクスチャーを加えることで競合他社と差別化することができ、そうすることで異なる種類の食品を求める消費者を惹きつけることができます。その結果、食品テクスチャー改良素材や、望ましい食品テクスチャーを一貫して効果的に作り出す技術に対するメーカーの要求はますます高まっています。さらに、植物代替品やタンパク質製品などの消費者動向の変化に対応するため、食品テクスチャー市場には常に革新が求められています。植物ベースの代替食品で肉や乳製品の食品テクスチャーを模倣できる食品テクスチャー改良ソリューションの開拓は、多くの企業にとって優先分野であり、食品テクスチャー市場の研究開発活動への投資につながっています。
消費者が個々のニーズや嗜好に適合した個別化ソリューションを求めるようになり、個別化栄養学が普及してきました。テクスチャーは、特定の栄養ニーズや状態を持つ個人の食品の受容性や楽しさに強い影響を与えるという事実により、個別化栄養において重要な役割を果たしています。嚥下障害を患い、咀嚼が困難な患者は、嚥下しやすい食品テクスチャーに変えたり、粘度を柔らかくしたりする必要があるかもしれないです。同様に、パフォーマンスを向上させたり、食事ガイドラインに準拠させたりするために食品の食品テクスチャーを変更することは、アスリートや特別な食事目標を持つ個人のためにカスタマイズされた栄養計画の一部であるかもしれないです。このため、食品テクスチャー市場では、こうした特別なニーズを満たす特定のテクスチャー化ソリューションを開拓する可能性が広がります。企業は、栄養における個別化動向を活用し、消費者の経験全体を向上させるオーダーメードのソリューションを通じて、個々の食品要件や味の嗜好を満たすことができる幅広い食品テクスチャーを提供することができます。
目次
第1章 イントロダクション
第2章 エグゼクティブサマリー
第3章 市場概要
- 市場の定義と範囲
- 主な調査結果
- 影響要因
- 主な投資機会
- ポーターのファイブフォース分析
- 市場力学
- 促進要因
- 消費者の嗜好の進化
- 製品の差別化と革新
- 健康とウェルネスの動向
- 抑制要因
- 規制と表示の課題
- 機会
- 植物ベースおよび代替タンパク質製品
- 個別化栄養と食品テクスチャー
- 促進要因
- COVID-19市場への影響分析
第4章 食品テクスチャー市場:タイプ別
- 概要
- セルロース誘導体
- ガム
- ペクチン
- ゼラチン
- デンプン
- イヌリン
- デキストリン
- その他
第5章 食品テクスチャー市場:用途別
- 概要
- 乳製品とアイスクリーム
- 菓子類
- ジャム
- レイヤー
- フィリング
- ベーカリー
- 肉製品
- レディミール
- ソース
- 飲料
- その他
第6章 食品テクスチャー市場:製品別
- 概要
- 天然
- 合成
第7章 食品テクスチャー市場:地域別
- 概要
- 北米
- 米国
- カナダ
- メキシコ
- 欧州
- 英国
- ドイツ
- フランス
- オランダ
- スペイン
- ベルギー
- ロシア
- ポーランド
- その他
- アジア太平洋
- 中国
- 日本
- インド
- 韓国
- オーストラリア
- インドネシア
- タイ
- マレーシア
- その他
- ラテンアメリカ・中東・アフリカ
- ブラジル
- 南アフリカ
- サウジアラビア
- その他
第8章 競争情勢
- イントロダクション
- 主要成功戦略
- 主要10社の製品マッピング
- 競合ダッシュボード
- 競合ヒートマップ
- 主要企業のポジショニング、2022年
第9章 企業プロファイル
- Cargill, Incorporated
- Ingredion Incorporated.
- Koninklijke DSM N.V.
- Archer-Daniels-Midland Company
- CP Kelco U.S., Inc
- Jungbunzlauer Suisse AG
- Deosen Biochemical(Ordos)Ltd.
- Euroduna Food Ingredients GmbH
- Kerry Group P.L.C.
- DuPont de Nemours, Inc.
LIST OF TABLES
- TABLE 01. GLOBAL FOOD TEXTURE MARKET, BY TYPE, 2022-2032 ($MILLION)
- TABLE 02. FOOD TEXTURE MARKET FOR CELLULOSE DERIVATIVES, BY REGION, 2022-2032 ($MILLION)
- TABLE 03. FOOD TEXTURE MARKET FOR GUMS, BY REGION, 2022-2032 ($MILLION)
- TABLE 04. FOOD TEXTURE MARKET FOR PECTINS, BY REGION, 2022-2032 ($MILLION)
- TABLE 05. FOOD TEXTURE MARKET FOR GELATINS, BY REGION, 2022-2032 ($MILLION)
- TABLE 06. FOOD TEXTURE MARKET FOR STARCH, BY REGION, 2022-2032 ($MILLION)
- TABLE 07. FOOD TEXTURE MARKET FOR INULIN, BY REGION, 2022-2032 ($MILLION)
- TABLE 08. FOOD TEXTURE MARKET FOR DEXTRINS, BY REGION, 2022-2032 ($MILLION)
- TABLE 09. FOOD TEXTURE MARKET FOR OTHERS, BY REGION, 2022-2032 ($MILLION)
- TABLE 10. GLOBAL FOOD TEXTURE MARKET, BY APPLICATION, 2022-2032 ($MILLION)
- TABLE 11. FOOD TEXTURE MARKET FOR DAIRY PRODUCTS AND ICE CREAMS, BY REGION, 2022-2032 ($MILLION)
- TABLE 12. FOOD TEXTURE MARKET FOR CONFECTIONERY, BY REGION, 2022-2032 ($MILLION)
- TABLE 13. FOOD TEXTURE MARKET FOR JAMS, BY REGION, 2022-2032 ($MILLION)
- TABLE 14. FOOD TEXTURE MARKET FOR LAYERS, BY REGION, 2022-2032 ($MILLION)
- TABLE 15. FOOD TEXTURE MARKET FOR FILLINGS, BY REGION, 2022-2032 ($MILLION)
- TABLE 16. FOOD TEXTURE MARKET FOR BAKERY, BY REGION, 2022-2032 ($MILLION)
- TABLE 17. FOOD TEXTURE MARKET FOR MEAT PRODUCTS, BY REGION, 2022-2032 ($MILLION)
- TABLE 18. FOOD TEXTURE MARKET FOR READY MEALS, BY REGION, 2022-2032 ($MILLION)
- TABLE 19. FOOD TEXTURE MARKET FOR SAUCES, BY REGION, 2022-2032 ($MILLION)
- TABLE 20. FOOD TEXTURE MARKET FOR BEVERAGE, BY REGION, 2022-2032 ($MILLION)
- TABLE 21. FOOD TEXTURE MARKET FOR OTHERS, BY REGION, 2022-2032 ($MILLION)
- TABLE 22. GLOBAL FOOD TEXTURE MARKET, BY PRODUCT, 2022-2032 ($MILLION)
- TABLE 23. FOOD TEXTURE MARKET FOR NATURAL, BY REGION, 2022-2032 ($MILLION)
- TABLE 24. FOOD TEXTURE MARKET FOR SYNTHETIC, BY REGION, 2022-2032 ($MILLION)
- TABLE 25. FOOD TEXTURE MARKET, BY REGION, 2022-2032 ($MILLION)
- TABLE 26. NORTH AMERICA FOOD TEXTURE MARKET, BY TYPE, 2022-2032 ($MILLION)
- TABLE 27. NORTH AMERICA FOOD TEXTURE MARKET, BY APPLICATION, 2022-2032 ($MILLION)
- TABLE 28. NORTH AMERICA FOOD TEXTURE MARKET, BY PRODUCT, 2022-2032 ($MILLION)
- TABLE 29. NORTH AMERICA FOOD TEXTURE MARKET, BY COUNTRY, 2022-2032 ($MILLION)
- TABLE 30. U.S. FOOD TEXTURE MARKET, BY TYPE, 2022-2032 ($MILLION)
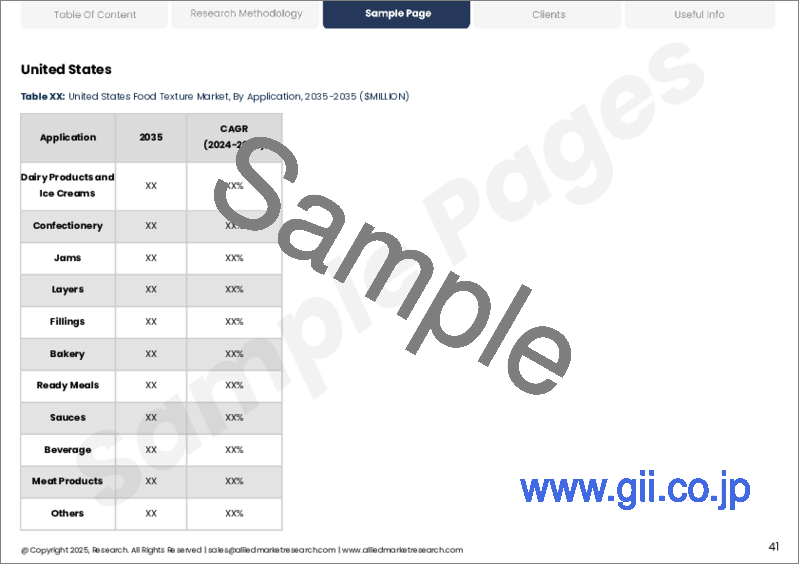
- TABLE 31. U.S. FOOD TEXTURE MARKET, BY APPLICATION, 2022-2032 ($MILLION)
- TABLE 32. U.S. FOOD TEXTURE MARKET, BY PRODUCT, 2022-2032 ($MILLION)
- TABLE 33. CANADA FOOD TEXTURE MARKET, BY TYPE, 2022-2032 ($MILLION)
- TABLE 34. CANADA FOOD TEXTURE MARKET, BY APPLICATION, 2022-2032 ($MILLION)
- TABLE 35. CANADA FOOD TEXTURE MARKET, BY PRODUCT, 2022-2032 ($MILLION)
- TABLE 36. MEXICO FOOD TEXTURE MARKET, BY TYPE, 2022-2032 ($MILLION)
- TABLE 37. MEXICO FOOD TEXTURE MARKET, BY APPLICATION, 2022-2032 ($MILLION)
- TABLE 38. MEXICO FOOD TEXTURE MARKET, BY PRODUCT, 2022-2032 ($MILLION)
- TABLE 39. EUROPE FOOD TEXTURE MARKET, BY TYPE, 2022-2032 ($MILLION)
- TABLE 40. EUROPE FOOD TEXTURE MARKET, BY APPLICATION, 2022-2032 ($MILLION)
- TABLE 41. EUROPE FOOD TEXTURE MARKET, BY PRODUCT, 2022-2032 ($MILLION)
- TABLE 42. EUROPE FOOD TEXTURE MARKET, BY COUNTRY, 2022-2032 ($MILLION)
- TABLE 43. UK FOOD TEXTURE MARKET, BY TYPE, 2022-2032 ($MILLION)
- TABLE 44. UK FOOD TEXTURE MARKET, BY APPLICATION, 2022-2032 ($MILLION)
- TABLE 45. UK FOOD TEXTURE MARKET, BY PRODUCT, 2022-2032 ($MILLION)
- TABLE 46. GERMANY FOOD TEXTURE MARKET, BY TYPE, 2022-2032 ($MILLION)
- TABLE 47. GERMANY FOOD TEXTURE MARKET, BY APPLICATION, 2022-2032 ($MILLION)
- TABLE 48. GERMANY FOOD TEXTURE MARKET, BY PRODUCT, 2022-2032 ($MILLION)
- TABLE 49. FRANCE FOOD TEXTURE MARKET, BY TYPE, 2022-2032 ($MILLION)
- TABLE 50. FRANCE FOOD TEXTURE MARKET, BY APPLICATION, 2022-2032 ($MILLION)
- TABLE 51. FRANCE FOOD TEXTURE MARKET, BY PRODUCT, 2022-2032 ($MILLION)
- TABLE 52. NETHERLANDS FOOD TEXTURE MARKET, BY TYPE, 2022-2032 ($MILLION)
- TABLE 53. NETHERLANDS FOOD TEXTURE MARKET, BY APPLICATION, 2022-2032 ($MILLION)
- TABLE 54. NETHERLANDS FOOD TEXTURE MARKET, BY PRODUCT, 2022-2032 ($MILLION)
- TABLE 55. SPAIN FOOD TEXTURE MARKET, BY TYPE, 2022-2032 ($MILLION)
- TABLE 56. SPAIN FOOD TEXTURE MARKET, BY APPLICATION, 2022-2032 ($MILLION)
- TABLE 57. SPAIN FOOD TEXTURE MARKET, BY PRODUCT, 2022-2032 ($MILLION)
- TABLE 58. BELGIUM FOOD TEXTURE MARKET, BY TYPE, 2022-2032 ($MILLION)
- TABLE 59. BELGIUM FOOD TEXTURE MARKET, BY APPLICATION, 2022-2032 ($MILLION)
- TABLE 60. BELGIUM FOOD TEXTURE MARKET, BY PRODUCT, 2022-2032 ($MILLION)
- TABLE 61. RUSSIA FOOD TEXTURE MARKET, BY TYPE, 2022-2032 ($MILLION)
- TABLE 62. RUSSIA FOOD TEXTURE MARKET, BY APPLICATION, 2022-2032 ($MILLION)
- TABLE 63. RUSSIA FOOD TEXTURE MARKET, BY PRODUCT, 2022-2032 ($MILLION)
- TABLE 64. POLAND FOOD TEXTURE MARKET, BY TYPE, 2022-2032 ($MILLION)
- TABLE 65. POLAND FOOD TEXTURE MARKET, BY APPLICATION, 2022-2032 ($MILLION)
- TABLE 66. POLAND FOOD TEXTURE MARKET, BY PRODUCT, 2022-2032 ($MILLION)
- TABLE 67. REST OF EUROPE FOOD TEXTURE MARKET, BY TYPE, 2022-2032 ($MILLION)
- TABLE 68. REST OF EUROPE FOOD TEXTURE MARKET, BY APPLICATION, 2022-2032 ($MILLION)
- TABLE 69. REST OF EUROPE FOOD TEXTURE MARKET, BY PRODUCT, 2022-2032 ($MILLION)
- TABLE 70. ASIA-PACIFIC FOOD TEXTURE MARKET, BY TYPE, 2022-2032 ($MILLION)
- TABLE 71. ASIA-PACIFIC FOOD TEXTURE MARKET, BY APPLICATION, 2022-2032 ($MILLION)
- TABLE 72. ASIA-PACIFIC FOOD TEXTURE MARKET, BY PRODUCT, 2022-2032 ($MILLION)
- TABLE 73. ASIA-PACIFIC FOOD TEXTURE MARKET, BY COUNTRY, 2022-2032 ($MILLION)
- TABLE 74. CHINA FOOD TEXTURE MARKET, BY TYPE, 2022-2032 ($MILLION)
- TABLE 75. CHINA FOOD TEXTURE MARKET, BY APPLICATION, 2022-2032 ($MILLION)
- TABLE 76. CHINA FOOD TEXTURE MARKET, BY PRODUCT, 2022-2032 ($MILLION)
- TABLE 77. JAPAN FOOD TEXTURE MARKET, BY TYPE, 2022-2032 ($MILLION)
- TABLE 78. JAPAN FOOD TEXTURE MARKET, BY APPLICATION, 2022-2032 ($MILLION)
- TABLE 79. JAPAN FOOD TEXTURE MARKET, BY PRODUCT, 2022-2032 ($MILLION)
- TABLE 80. INDIA FOOD TEXTURE MARKET, BY TYPE, 2022-2032 ($MILLION)
- TABLE 81. INDIA FOOD TEXTURE MARKET, BY APPLICATION, 2022-2032 ($MILLION)
- TABLE 82. INDIA FOOD TEXTURE MARKET, BY PRODUCT, 2022-2032 ($MILLION)
- TABLE 83. SOUTH KOREA FOOD TEXTURE MARKET, BY TYPE, 2022-2032 ($MILLION)
- TABLE 84. SOUTH KOREA FOOD TEXTURE MARKET, BY APPLICATION, 2022-2032 ($MILLION)
- TABLE 85. SOUTH KOREA FOOD TEXTURE MARKET, BY PRODUCT, 2022-2032 ($MILLION)
- TABLE 86. AUSTRALIA FOOD TEXTURE MARKET, BY TYPE, 2022-2032 ($MILLION)
- TABLE 87. AUSTRALIA FOOD TEXTURE MARKET, BY APPLICATION, 2022-2032 ($MILLION)
- TABLE 88. AUSTRALIA FOOD TEXTURE MARKET, BY PRODUCT, 2022-2032 ($MILLION)
- TABLE 89. INDONESIA FOOD TEXTURE MARKET, BY TYPE, 2022-2032 ($MILLION)
- TABLE 90. INDONESIA FOOD TEXTURE MARKET, BY APPLICATION, 2022-2032 ($MILLION)
- TABLE 91. INDONESIA FOOD TEXTURE MARKET, BY PRODUCT, 2022-2032 ($MILLION)
- TABLE 92. THAILAND FOOD TEXTURE MARKET, BY TYPE, 2022-2032 ($MILLION)
- TABLE 93. THAILAND FOOD TEXTURE MARKET, BY APPLICATION, 2022-2032 ($MILLION)
- TABLE 94. THAILAND FOOD TEXTURE MARKET, BY PRODUCT, 2022-2032 ($MILLION)
- TABLE 95. MALAYSIA FOOD TEXTURE MARKET, BY TYPE, 2022-2032 ($MILLION)
- TABLE 96. MALAYSIA FOOD TEXTURE MARKET, BY APPLICATION, 2022-2032 ($MILLION)
- TABLE 97. MALAYSIA FOOD TEXTURE MARKET, BY PRODUCT, 2022-2032 ($MILLION)
- TABLE 98. REST OF ASIA-PACIFIC FOOD TEXTURE MARKET, BY TYPE, 2022-2032 ($MILLION)
- TABLE 99. REST OF ASIA-PACIFIC FOOD TEXTURE MARKET, BY APPLICATION, 2022-2032 ($MILLION)
- TABLE 100. REST OF ASIA-PACIFIC FOOD TEXTURE MARKET, BY PRODUCT, 2022-2032 ($MILLION)
- TABLE 101. LAMEA FOOD TEXTURE MARKET, BY TYPE, 2022-2032 ($MILLION)
- TABLE 102. LAMEA FOOD TEXTURE MARKET, BY APPLICATION, 2022-2032 ($MILLION)
- TABLE 103. LAMEA FOOD TEXTURE MARKET, BY PRODUCT, 2022-2032 ($MILLION)
- TABLE 104. LAMEA FOOD TEXTURE MARKET, BY COUNTRY, 2022-2032 ($MILLION)
- TABLE 105. BRAZIL FOOD TEXTURE MARKET, BY TYPE, 2022-2032 ($MILLION)
- TABLE 106. BRAZIL FOOD TEXTURE MARKET, BY APPLICATION, 2022-2032 ($MILLION)
- TABLE 107. BRAZIL FOOD TEXTURE MARKET, BY PRODUCT, 2022-2032 ($MILLION)
- TABLE 108. SOUTH AFRICA, FOOD TEXTURE MARKET, BY TYPE, 2022-2032 ($MILLION)
- TABLE 109. SOUTH AFRICA, FOOD TEXTURE MARKET, BY APPLICATION, 2022-2032 ($MILLION)
- TABLE 110. SOUTH AFRICA, FOOD TEXTURE MARKET, BY PRODUCT, 2022-2032 ($MILLION)
- TABLE 111. SAUDI ARABIA FOOD TEXTURE MARKET, BY TYPE, 2022-2032 ($MILLION)
- TABLE 112. SAUDI ARABIA FOOD TEXTURE MARKET, BY APPLICATION, 2022-2032 ($MILLION)
- TABLE 113. SAUDI ARABIA FOOD TEXTURE MARKET, BY PRODUCT, 2022-2032 ($MILLION)
- TABLE 114. REST OF LAMEA FOOD TEXTURE MARKET, BY TYPE, 2022-2032 ($MILLION)
- TABLE 115. REST OF LAMEA FOOD TEXTURE MARKET, BY APPLICATION, 2022-2032 ($MILLION)
- TABLE 116. REST OF LAMEA FOOD TEXTURE MARKET, BY PRODUCT, 2022-2032 ($MILLION)
- TABLE 117. CARGILL, INCORPORATED: KEY EXECUTIVES
- TABLE 118. CARGILL, INCORPORATED: COMPANY SNAPSHOT
- TABLE 119. CARGILL, INCORPORATED: PRODUCT SEGMENTS
- TABLE 120. CARGILL, INCORPORATED: PRODUCT PORTFOLIO
- TABLE 121. CARGILL, INCORPORATED: KEY STRATERGIES
- TABLE 122. INGREDION INCORPORATED.: KEY EXECUTIVES
- TABLE 123. INGREDION INCORPORATED.: COMPANY SNAPSHOT
- TABLE 124. INGREDION INCORPORATED.: PRODUCT SEGMENTS
- TABLE 125. INGREDION INCORPORATED.: PRODUCT PORTFOLIO
- TABLE 126. INGREDION INCORPORATED.: KEY STRATERGIES
- TABLE 127. KONINKLIJKE DSM N.V.: KEY EXECUTIVES
- TABLE 128. KONINKLIJKE DSM N.V.: COMPANY SNAPSHOT
- TABLE 129. KONINKLIJKE DSM N.V.: PRODUCT SEGMENTS
- TABLE 130. KONINKLIJKE DSM N.V.: PRODUCT PORTFOLIO
- TABLE 131. ARCHER-DANIELS-MIDLAND COMPANY: KEY EXECUTIVES
- TABLE 132. ARCHER-DANIELS-MIDLAND COMPANY: COMPANY SNAPSHOT
- TABLE 133. ARCHER-DANIELS-MIDLAND COMPANY: PRODUCT SEGMENTS
- TABLE 134. ARCHER-DANIELS-MIDLAND COMPANY: PRODUCT PORTFOLIO
- TABLE 135. ARCHER-DANIELS-MIDLAND COMPANY: KEY STRATERGIES
- TABLE 136. CP KELCO U.S., INC: KEY EXECUTIVES
- TABLE 137. CP KELCO U.S., INC: COMPANY SNAPSHOT
- TABLE 138. CP KELCO U.S., INC: PRODUCT SEGMENTS
- TABLE 139. CP KELCO U.S., INC: PRODUCT PORTFOLIO
- TABLE 140. JUNGBUNZLAUER SUISSE AG: KEY EXECUTIVES
- TABLE 141. JUNGBUNZLAUER SUISSE AG: COMPANY SNAPSHOT
- TABLE 142. JUNGBUNZLAUER SUISSE AG: PRODUCT SEGMENTS
- TABLE 143. JUNGBUNZLAUER SUISSE AG: PRODUCT PORTFOLIO
- TABLE 144. JUNGBUNZLAUER SUISSE AG: KEY STRATERGIES
- TABLE 145. DEOSEN BIOCHEMICAL (ORDOS) LTD.: KEY EXECUTIVES
- TABLE 146. DEOSEN BIOCHEMICAL (ORDOS) LTD.: COMPANY SNAPSHOT
- TABLE 147. DEOSEN BIOCHEMICAL (ORDOS) LTD.: PRODUCT SEGMENTS
- TABLE 148. DEOSEN BIOCHEMICAL (ORDOS) LTD.: PRODUCT PORTFOLIO
- TABLE 149. EURODUNA FOOD INGREDIENTS GMBH: KEY EXECUTIVES
- TABLE 150. EURODUNA FOOD INGREDIENTS GMBH: COMPANY SNAPSHOT
- TABLE 151. EURODUNA FOOD INGREDIENTS GMBH: PRODUCT SEGMENTS
- TABLE 152. EURODUNA FOOD INGREDIENTS GMBH: PRODUCT PORTFOLIO
- TABLE 153. KERRY GROUP P.L.C.: KEY EXECUTIVES
- TABLE 154. KERRY GROUP P.L.C.: COMPANY SNAPSHOT
- TABLE 155. KERRY GROUP P.L.C.: PRODUCT SEGMENTS
- TABLE 156. KERRY GROUP P.L.C.: PRODUCT PORTFOLIO
- TABLE 157. DUPONT DE NEMOURS, INC.: KEY EXECUTIVES
- TABLE 158. DUPONT DE NEMOURS, INC.: COMPANY SNAPSHOT
- TABLE 159. DUPONT DE NEMOURS, INC.: PRODUCT SEGMENTS
- TABLE 160. DUPONT DE NEMOURS, INC.: PRODUCT PORTFOLIO
- TABLE 161. DUPONT DE NEMOURS, INC.: KEY STRATERGIES
LIST OF FIGURES
- FIGURE 01. FOOD TEXTURE MARKET, 2022-2032
- FIGURE 02. SEGMENTATION OF FOOD TEXTURE MARKET, 2022-2032
- FIGURE 03. TOP INVESTMENT POCKETS IN FOOD TEXTURE MARKET (2023-2032)
- FIGURE 04. MODERATE BARGAINING POWER OF SUPPLIERS
- FIGURE 05. LOW THREAT OF NEW ENTRANTS
- FIGURE 06. HIGH THREAT OF SUBSTITUTES
- FIGURE 07. MODERATE INTENSITY OF RIVALRY
- FIGURE 08. MODERATE TO HIGH BARGAINING POWER OF BUYERS
- FIGURE 09. DRIVERS, RESTRAINTS AND OPPORTUNITIES: GLOBALFOOD TEXTURE MARKET
- FIGURE 09. FOOD TEXTURE MARKET, BY TYPE, 2022(%)
- FIGURE 10. COMPARATIVE SHARE ANALYSIS OF FOOD TEXTURE MARKET FOR CELLULOSE DERIVATIVES, BY COUNTRY 2022 AND 2032(%)
- FIGURE 11. COMPARATIVE SHARE ANALYSIS OF FOOD TEXTURE MARKET FOR GUMS, BY COUNTRY 2022 AND 2032(%)
- FIGURE 12. COMPARATIVE SHARE ANALYSIS OF FOOD TEXTURE MARKET FOR PECTINS, BY COUNTRY 2022 AND 2032(%)
- FIGURE 13. COMPARATIVE SHARE ANALYSIS OF FOOD TEXTURE MARKET FOR GELATINS, BY COUNTRY 2022 AND 2032(%)
- FIGURE 14. COMPARATIVE SHARE ANALYSIS OF FOOD TEXTURE MARKET FOR STARCH, BY COUNTRY 2022 AND 2032(%)
- FIGURE 15. COMPARATIVE SHARE ANALYSIS OF FOOD TEXTURE MARKET FOR INULIN, BY COUNTRY 2022 AND 2032(%)
- FIGURE 16. COMPARATIVE SHARE ANALYSIS OF FOOD TEXTURE MARKET FOR DEXTRINS, BY COUNTRY 2022 AND 2032(%)
- FIGURE 17. COMPARATIVE SHARE ANALYSIS OF FOOD TEXTURE MARKET FOR OTHERS, BY COUNTRY 2022 AND 2032(%)
- FIGURE 18. FOOD TEXTURE MARKET, BY APPLICATION, 2022(%)
- FIGURE 19. COMPARATIVE SHARE ANALYSIS OF FOOD TEXTURE MARKET FOR DAIRY PRODUCTS AND ICE CREAMS, BY COUNTRY 2022 AND 2032(%)
- FIGURE 20. COMPARATIVE SHARE ANALYSIS OF FOOD TEXTURE MARKET FOR CONFECTIONERY, BY COUNTRY 2022 AND 2032(%)
- FIGURE 21. COMPARATIVE SHARE ANALYSIS OF FOOD TEXTURE MARKET FOR JAMS, BY COUNTRY 2022 AND 2032(%)
- FIGURE 22. COMPARATIVE SHARE ANALYSIS OF FOOD TEXTURE MARKET FOR LAYERS, BY COUNTRY 2022 AND 2032(%)
- FIGURE 23. COMPARATIVE SHARE ANALYSIS OF FOOD TEXTURE MARKET FOR FILLINGS, BY COUNTRY 2022 AND 2032(%)
- FIGURE 24. COMPARATIVE SHARE ANALYSIS OF FOOD TEXTURE MARKET FOR BAKERY, BY COUNTRY 2022 AND 2032(%)
- FIGURE 25. COMPARATIVE SHARE ANALYSIS OF FOOD TEXTURE MARKET FOR MEAT PRODUCTS, BY COUNTRY 2022 AND 2032(%)
- FIGURE 26. COMPARATIVE SHARE ANALYSIS OF FOOD TEXTURE MARKET FOR READY MEALS, BY COUNTRY 2022 AND 2032(%)
- FIGURE 27. COMPARATIVE SHARE ANALYSIS OF FOOD TEXTURE MARKET FOR SAUCES, BY COUNTRY 2022 AND 2032(%)
- FIGURE 28. COMPARATIVE SHARE ANALYSIS OF FOOD TEXTURE MARKET FOR BEVERAGE, BY COUNTRY 2022 AND 2032(%)
- FIGURE 29. COMPARATIVE SHARE ANALYSIS OF FOOD TEXTURE MARKET FOR OTHERS, BY COUNTRY 2022 AND 2032(%)
- FIGURE 30. FOOD TEXTURE MARKET, BY PRODUCT, 2022(%)
- FIGURE 31. COMPARATIVE SHARE ANALYSIS OF FOOD TEXTURE MARKET FOR NATURAL, BY COUNTRY 2022 AND 2032(%)
- FIGURE 32. COMPARATIVE SHARE ANALYSIS OF FOOD TEXTURE MARKET FOR SYNTHETIC, BY COUNTRY 2022 AND 2032(%)
- FIGURE 33. FOOD TEXTURE MARKET BY REGION, 2022
- FIGURE 34. U.S. FOOD TEXTURE MARKET, 2022-2032 ($MILLION)
- FIGURE 35. CANADA FOOD TEXTURE MARKET, 2022-2032 ($MILLION)
- FIGURE 36. MEXICO FOOD TEXTURE MARKET, 2022-2032 ($MILLION)
- FIGURE 37. UK FOOD TEXTURE MARKET, 2022-2032 ($MILLION)
- FIGURE 38. GERMANY FOOD TEXTURE MARKET, 2022-2032 ($MILLION)
- FIGURE 39. FRANCE FOOD TEXTURE MARKET, 2022-2032 ($MILLION)
- FIGURE 40. NETHERLANDS FOOD TEXTURE MARKET, 2022-2032 ($MILLION)
- FIGURE 41. SPAIN FOOD TEXTURE MARKET, 2022-2032 ($MILLION)
- FIGURE 42. BELGIUM FOOD TEXTURE MARKET, 2022-2032 ($MILLION)
- FIGURE 43. RUSSIA FOOD TEXTURE MARKET, 2022-2032 ($MILLION)
- FIGURE 44. POLAND FOOD TEXTURE MARKET, 2022-2032 ($MILLION)
- FIGURE 45. REST OF EUROPE FOOD TEXTURE MARKET, 2022-2032 ($MILLION)
- FIGURE 46. CHINA FOOD TEXTURE MARKET, 2022-2032 ($MILLION)
- FIGURE 47. JAPAN FOOD TEXTURE MARKET, 2022-2032 ($MILLION)
- FIGURE 48. INDIA FOOD TEXTURE MARKET, 2022-2032 ($MILLION)
- FIGURE 49. SOUTH KOREA FOOD TEXTURE MARKET, 2022-2032 ($MILLION)
- FIGURE 50. AUSTRALIA FOOD TEXTURE MARKET, 2022-2032 ($MILLION)
- FIGURE 51. INDONESIA FOOD TEXTURE MARKET, 2022-2032 ($MILLION)
- FIGURE 52. THAILAND FOOD TEXTURE MARKET, 2022-2032 ($MILLION)
- FIGURE 53. MALAYSIA FOOD TEXTURE MARKET, 2022-2032 ($MILLION)
- FIGURE 54. REST OF ASIA-PACIFIC FOOD TEXTURE MARKET, 2022-2032 ($MILLION)
- FIGURE 55. BRAZIL FOOD TEXTURE MARKET, 2022-2032 ($MILLION)
- FIGURE 56. SOUTH AFRICA, FOOD TEXTURE MARKET, 2022-2032 ($MILLION)
- FIGURE 57. SAUDI ARABIA FOOD TEXTURE MARKET, 2022-2032 ($MILLION)
- FIGURE 58. REST OF LAMEA FOOD TEXTURE MARKET, 2022-2032 ($MILLION)
- FIGURE 59. TOP WINNING STRATEGIES, BY YEAR
- FIGURE 60. TOP WINNING STRATEGIES, BY DEVELOPMENT
- FIGURE 61. TOP WINNING STRATEGIES, BY COMPANY
- FIGURE 62. PRODUCT MAPPING OF TOP 10 PLAYERS
- FIGURE 63. COMPETITIVE DASHBOARD
- FIGURE 64. COMPETITIVE HEATMAP: FOOD TEXTURE MARKET
- FIGURE 65. TOP PLAYER POSITIONING, 2022
- FIGURE 66. INGREDION INCORPORATED.: NET REVENUE, 2020-2022 ($MILLION)
- FIGURE 67. INGREDION INCORPORATED.: RESEARCH & DEVELOPMENT EXPENDITURE, 2020-2022 ($MILLION)
- FIGURE 68. INGREDION INCORPORATED.: REVENUE SHARE BY SEGMENT, 2022 (%)
- FIGURE 69. KONINKLIJKE DSM N.V.: NET SALES, 2018-2020 ($MILLION)
- FIGURE 70. KONINKLIJKE DSM N.V.: REVENUE SHARE BY SEGMENT, 2020 (%)
- FIGURE 71. KONINKLIJKE DSM N.V.: REVENUE SHARE BY REGION, 2020 (%)
- FIGURE 72. ARCHER-DANIELS-MIDLAND COMPANY: NET REVENUE, 2020-2022 ($MILLION)
- FIGURE 73. ARCHER-DANIELS-MIDLAND COMPANY: RESEARCH & DEVELOPMENT EXPENDITURE, 2020-2022 ($MILLION)
- FIGURE 74. ARCHER-DANIELS-MIDLAND COMPANY: REVENUE SHARE BY SEGMENT, 2022 (%)
- FIGURE 75. ARCHER-DANIELS-MIDLAND COMPANY: REVENUE SHARE BY REGION, 2022 (%)
- FIGURE 76. KERRY GROUP P.L.C.: NET SALES, 2020-2022 ($MILLION)
- FIGURE 77. KERRY GROUP P.L.C.: RESEARCH & DEVELOPMENT EXPENDITURE, 2020-2022 ($MILLION)
- FIGURE 78. KERRY GROUP P.L.C.: REVENUE SHARE BY SEGMENT, 2022 (%)
- FIGURE 79. KERRY GROUP P.L.C.: REVENUE SHARE BY REGION, 2022 (%)
- FIGURE 80. DUPONT DE NEMOURS, INC.: RESEARCH & DEVELOPMENT EXPENDITURE, 2019-2021
- FIGURE 81. DUPONT DE NEMOURS, INC.: NET REVENUE, 2019-2021 ($MILLION)
- FIGURE 82. DUPONT DE NEMOURS, INC.: REVENUE SHARE BY SEGMENT, 2021 (%)
- FIGURE 83. DUPONT DE NEMOURS, INC.: REVENUE SHARE BY REGION, 2021 (%)
According to a new report published by Allied Market Research, titled, "Food Texture Market," The food texture market was valued at $13.8 billion in 2022, and is estimated to reach $23.9 billion by 2032, growing at a CAGR of 5.7% from 2023 to 2032.
Product differentiation is essential for companies to be at the head of the market in a complex food sector characterized by high competition. For food manufacturers, the possibility of developing unique products offering a distinct eating experience is provided by texture modification. Companies can distinguish themselves from their competitors by adding special textures to products, and in doing so attract consumers who look for a different kind of food. Consequently, manufacturers' requirements for texturizing ingredients and technology enables them to create desired textures consistently and effectively are increasing. Furthermore, innovation is always needed in the food texture market to respond to changes in consumer trends such as plant substitutes and protein products. Developing texturization solutions that can mimic the texture of meat and dairy products in plant-based alternatives is a priority area for many companies, leading them to invest in R&D activities in the texture market.
As consumers seek a personalized solution adapted to their individual needs and preferences, personalized nutrition has become more popular. Texture plays an important role in personalized nutrition owing to the fact that it has a strong influence on the acceptability and enjoyment of foods for individuals with specific nutritional needs or conditions. Patients suffering with dysphagia, who face difficulty in swallowing, and cannot chew may need to change the texture of the product that is easy for them to swallow or soften its consistency. Similarly, modifying the texture of foods to increase performance or comply with diet guidelines may be part of a customized nutrition plan for athletes or individuals who have special food goals. This opens the possibility of developing specific texturization solutions that meet these special needs within the food texture market. Companies can take advantage of the personalized trends in nutrition, offering a wide range of textures that allow them to meet each individual food requirement and taste preference through tailored solutions that will improve the entire consumer experience.
The food texture market is segmented on the basis of type, application, product, and region. On the basis of type, the market is classified into cellulose derivatives, gums, pectins, gelatins, starch, inulin, dextrins, and others. On the basis of application, the market is categorized into dairy products & ice creams, confectionery, jams, layers, fillings, bakery, meat products, ready meals, sauces, beverage, and others. By product, the market is bifurcated into natural and synthetic. Region-wise the market is analyzed across North America (the U.S., Canada, and Mexico), Europe (the UK, Germany, France, the Netherlands, Spain, Belgium, Russia, Poland, and rest of Europe), Asia-Pacific (China, Japan, India, South Korea, Australia, Indonesia, Thailand, Malaysia, and rest of Asia-Pacific), LAMEA (Brazil, South Africa, Saudi Arabia, and rest of LAMEA).
The major players operating in the market focus on key market strategies, such as mergers, product launches, acquisitions, collaborations, and partnerships. They have also been focusing on strengthening their market reach to maintain their goodwill in the ever-competitive market. Some of the key players in the food texture market include Cargill Incorporated, DuPont de Nemours, Inc.., Ingredion Inc., Koninklijke DSM N.V., CP Kelco, Kerry Group PLC, Jungbunzlauer Holding AG Deosen Biochemical (Ordos) Ltd., Euroduna Food Ingredients GmbH, and Archer Daniels Midland Company.
Key Benefits For Stakeholders
- This report provides a quantitative analysis of the market segments, current trends, estimations, and dynamics of the food texture market analysis from 2022 to 2032 to identify the prevailing food texture market opportunities.
- The market research is offered along with information related to key drivers, restraints, and opportunities.
- Porter's five forces analysis highlights the potency of buyers and suppliers to enable stakeholders make profit-oriented business decisions and strengthen their supplier-buyer network.
- In-depth analysis of the food texture market segmentation assists to determine the prevailing market opportunities.
- Major countries in each region are mapped according to their revenue contribution to the global market.
- Market player positioning facilitates benchmarking and provides a clear understanding of the present position of the market players.
- The report includes the analysis of the regional as well as global food texture market trends, key players, market segments, application areas, and market growth strategies.
Additional benefits you will get with this purchase are:
- Quarterly Update and* (only available with a corporate license, on listed price)
- 5 additional Company Profile of client Choice pre- or Post-purchase, as a free update.
- Free Upcoming Version on the Purchase of Five and Enterprise User License.
- 16 analyst hours of support* (post-purchase, if you find additional data requirements upon review of the report, you may receive support amounting to 16 analyst hours to solve questions, and post-sale queries)
- 15% Free Customization* (in case the scope or segment of the report does not match your requirements, 20% is equivalent to 3 working days of free work, applicable once)
- Free data Pack on the Five and Enterprise User License. (Excel version of the report)
- Free Updated report if the report is 6-12 months old or older.
- 24-hour priority response*
- Free Industry updates and white papers.
Possible Customization with this report (with additional cost and timeline talk to the sales executive to know more)
- Brands Share Analysis
- Expanded list for Company Profiles
Key Market Segments
By Type
- Gums
- Pectins
- Gelatins
- Starch
- Inulin
- Dextrins
- Others
- Cellulose Derivatives
By Application
- Dairy Products and Ice Creams
- Confectionery
- Jams
- Layers
- Fillings
- Bakery
- Ready Meals
- Sauces
- Beverage
- Others
- Meat Products
By Product
- Natural
- Synthetic
By Region
- North America
- U.S.
- Canada
- Mexico
- Europe
- UK
- Germany
- France
- Netherlands
- Spain
- Belgium
- Russia
- Poland
- Rest of Europe
- Asia-Pacific
- China
- Japan
- India
- South Korea
- Australia
- Indonesia
- Thailand
- Malaysia
- Rest of Asia-Pacific
- LAMEA
- Brazil
- South Africa,
- Saudi Arabia
- Rest of LAMEA
Key Market Players:
- Archer-Daniels-Midland Company
- Cargill, Incorporated
- CP Kelco U.S., Inc
- Deosen Biochemical (Ordos) Ltd.
- DuPont de Nemours, Inc.
- Euroduna Food Ingredients GmbH
- Ingredion Incorporated.
- Jungbunzlauer Suisse AG
- Kerry Group P.L.C.
- Koninklijke DSM N.V.
TABLE OF CONTENTS
CHAPTER 1: INTRODUCTION
- 1.1. Report description
- 1.2. Key market segments
- 1.3. Key benefits to the stakeholders
- 1.4. Research Methodology
- 1.4.1. Primary research
- 1.4.2. Secondary research
- 1.4.3. Analyst tools and models
CHAPTER 2: EXECUTIVE SUMMARY
- 2.1. CXO Perspective
CHAPTER 3: MARKET OVERVIEW
- 3.1. Market definition and scope
- 3.2. Key findings
- 3.2.1. Top impacting factors
- 3.2.2. Top investment pockets
- 3.3. Porter's five forces analysis
- 3.3.1. Moderate bargaining power of suppliers
- 3.3.2. Low threat of new entrants
- 3.3.3. High threat of substitutes
- 3.3.4. Moderate intensity of rivalry
- 3.3.5. Moderate to high bargaining power of buyers
- 3.4. Market dynamics
- 3.4.1. Drivers
- 3.4.1.1. Evolving Consumer Preferences
- 3.4.1.2. Product Differentiation and Innovation
- 3.4.1.3. Health and Wellness Trends
- 3.4.1. Drivers
- 3.4.2. Restraints
- 3.4.2.1. Regulatory and Labeling Challenges
- 3.4.3. Opportunities
- 3.4.3.1. Plant-Based and Alternative Protein Products
- 3.4.3.2. Personalized Nutrition and Texture
- 3.5. COVID-19 Impact Analysis on the market
CHAPTER 4: FOOD TEXTURE MARKET, BY TYPE
- 4.1. Overview
- 4.1.1. Market size and forecast
- 4.2. Cellulose Derivatives
- 4.2.1. Key market trends, growth factors and opportunities
- 4.2.2. Market size and forecast, by region
- 4.2.3. Market share analysis by country
- 4.3. Gums
- 4.3.1. Key market trends, growth factors and opportunities
- 4.3.2. Market size and forecast, by region
- 4.3.3. Market share analysis by country
- 4.4. Pectins
- 4.4.1. Key market trends, growth factors and opportunities
- 4.4.2. Market size and forecast, by region
- 4.4.3. Market share analysis by country
- 4.5. Gelatins
- 4.5.1. Key market trends, growth factors and opportunities
- 4.5.2. Market size and forecast, by region
- 4.5.3. Market share analysis by country
- 4.6. Starch
- 4.6.1. Key market trends, growth factors and opportunities
- 4.6.2. Market size and forecast, by region
- 4.6.3. Market share analysis by country
- 4.7. Inulin
- 4.7.1. Key market trends, growth factors and opportunities
- 4.7.2. Market size and forecast, by region
- 4.7.3. Market share analysis by country
- 4.8. Dextrins
- 4.8.1. Key market trends, growth factors and opportunities
- 4.8.2. Market size and forecast, by region
- 4.8.3. Market share analysis by country
- 4.9. Others
- 4.9.1. Key market trends, growth factors and opportunities
- 4.9.2. Market size and forecast, by region
- 4.9.3. Market share analysis by country
CHAPTER 5: FOOD TEXTURE MARKET, BY APPLICATION
- 5.1. Overview
- 5.1.1. Market size and forecast
- 5.2. Dairy Products and Ice Creams
- 5.2.1. Key market trends, growth factors and opportunities
- 5.2.2. Market size and forecast, by region
- 5.2.3. Market share analysis by country
- 5.3. Confectionery
- 5.3.1. Key market trends, growth factors and opportunities
- 5.3.2. Market size and forecast, by region
- 5.3.3. Market share analysis by country
- 5.4. Jams
- 5.4.1. Key market trends, growth factors and opportunities
- 5.4.2. Market size and forecast, by region
- 5.4.3. Market share analysis by country
- 5.5. Layers
- 5.5.1. Key market trends, growth factors and opportunities
- 5.5.2. Market size and forecast, by region
- 5.5.3. Market share analysis by country
- 5.6. Fillings
- 5.6.1. Key market trends, growth factors and opportunities
- 5.6.2. Market size and forecast, by region
- 5.6.3. Market share analysis by country
- 5.7. Bakery
- 5.7.1. Key market trends, growth factors and opportunities
- 5.7.2. Market size and forecast, by region
- 5.7.3. Market share analysis by country
- 5.8. Meat Products
- 5.8.1. Key market trends, growth factors and opportunities
- 5.8.2. Market size and forecast, by region
- 5.8.3. Market share analysis by country
- 5.9. Ready Meals
- 5.9.1. Key market trends, growth factors and opportunities
- 5.9.2. Market size and forecast, by region
- 5.9.3. Market share analysis by country
- 5.10. Sauces
- 5.10.1. Key market trends, growth factors and opportunities
- 5.10.2. Market size and forecast, by region
- 5.10.3. Market share analysis by country
- 5.11. Beverage
- 5.11.1. Key market trends, growth factors and opportunities
- 5.11.2. Market size and forecast, by region
- 5.11.3. Market share analysis by country
- 5.12. Others
- 5.12.1. Key market trends, growth factors and opportunities
- 5.12.2. Market size and forecast, by region
- 5.12.3. Market share analysis by country
CHAPTER 6: FOOD TEXTURE MARKET, BY PRODUCT
- 6.1. Overview
- 6.1.1. Market size and forecast
- 6.2. Natural
- 6.2.1. Key market trends, growth factors and opportunities
- 6.2.2. Market size and forecast, by region
- 6.2.3. Market share analysis by country
- 6.3. Synthetic
- 6.3.1. Key market trends, growth factors and opportunities
- 6.3.2. Market size and forecast, by region
- 6.3.3. Market share analysis by country
CHAPTER 7: FOOD TEXTURE MARKET, BY REGION
- 7.1. Overview
- 7.1.1. Market size and forecast By Region
- 7.2. North America
- 7.2.1. Key trends and opportunities
- 7.2.2. Market size and forecast, by Type
- 7.2.3. Market size and forecast, by Application
- 7.2.4. Market size and forecast, by Product
- 7.2.5. Market size and forecast, by country
- 7.2.5.1. U.S.
- 7.2.5.1.1. Key market trends, growth factors and opportunities
- 7.2.5.1.2. Market size and forecast, by Type
- 7.2.5.1.3. Market size and forecast, by Application
- 7.2.5.1.4. Market size and forecast, by Product
- 7.2.5.2. Canada
- 7.2.5.2.1. Key market trends, growth factors and opportunities
- 7.2.5.2.2. Market size and forecast, by Type
- 7.2.5.2.3. Market size and forecast, by Application
- 7.2.5.2.4. Market size and forecast, by Product
- 7.2.5.3. Mexico
- 7.2.5.3.1. Key market trends, growth factors and opportunities
- 7.2.5.3.2. Market size and forecast, by Type
- 7.2.5.3.3. Market size and forecast, by Application
- 7.2.5.3.4. Market size and forecast, by Product
- 7.3. Europe
- 7.3.1. Key trends and opportunities
- 7.3.2. Market size and forecast, by Type
- 7.3.3. Market size and forecast, by Application
- 7.3.4. Market size and forecast, by Product
- 7.3.5. Market size and forecast, by country
- 7.3.5.1. UK
- 7.3.5.1.1. Key market trends, growth factors and opportunities
- 7.3.5.1.2. Market size and forecast, by Type
- 7.3.5.1.3. Market size and forecast, by Application
- 7.3.5.1.4. Market size and forecast, by Product
- 7.3.5.2. Germany
- 7.3.5.2.1. Key market trends, growth factors and opportunities
- 7.3.5.2.2. Market size and forecast, by Type
- 7.3.5.2.3. Market size and forecast, by Application
- 7.3.5.2.4. Market size and forecast, by Product
- 7.3.5.3. France
- 7.3.5.3.1. Key market trends, growth factors and opportunities
- 7.3.5.3.2. Market size and forecast, by Type
- 7.3.5.3.3. Market size and forecast, by Application
- 7.3.5.3.4. Market size and forecast, by Product
- 7.3.5.4. Netherlands
- 7.3.5.4.1. Key market trends, growth factors and opportunities
- 7.3.5.4.2. Market size and forecast, by Type
- 7.3.5.4.3. Market size and forecast, by Application
- 7.3.5.4.4. Market size and forecast, by Product
- 7.3.5.5. Spain
- 7.3.5.5.1. Key market trends, growth factors and opportunities
- 7.3.5.5.2. Market size and forecast, by Type
- 7.3.5.5.3. Market size and forecast, by Application
- 7.3.5.5.4. Market size and forecast, by Product
- 7.3.5.6. Belgium
- 7.3.5.6.1. Key market trends, growth factors and opportunities
- 7.3.5.6.2. Market size and forecast, by Type
- 7.3.5.6.3. Market size and forecast, by Application
- 7.3.5.6.4. Market size and forecast, by Product
- 7.3.5.7. Russia
- 7.3.5.7.1. Key market trends, growth factors and opportunities
- 7.3.5.7.2. Market size and forecast, by Type
- 7.3.5.7.3. Market size and forecast, by Application
- 7.3.5.7.4. Market size and forecast, by Product
- 7.3.5.8. Poland
- 7.3.5.8.1. Key market trends, growth factors and opportunities
- 7.3.5.8.2. Market size and forecast, by Type
- 7.3.5.8.3. Market size and forecast, by Application
- 7.3.5.8.4. Market size and forecast, by Product
- 7.3.5.9. Rest of Europe
- 7.3.5.9.1. Key market trends, growth factors and opportunities
- 7.3.5.9.2. Market size and forecast, by Type
- 7.3.5.9.3. Market size and forecast, by Application
- 7.3.5.9.4. Market size and forecast, by Product
- 7.4. Asia-Pacific
- 7.4.1. Key trends and opportunities
- 7.4.2. Market size and forecast, by Type
- 7.4.3. Market size and forecast, by Application
- 7.4.4. Market size and forecast, by Product
- 7.4.5. Market size and forecast, by country
- 7.4.5.1. China
- 7.4.5.1.1. Key market trends, growth factors and opportunities
- 7.4.5.1.2. Market size and forecast, by Type
- 7.4.5.1.3. Market size and forecast, by Application
- 7.4.5.1.4. Market size and forecast, by Product
- 7.4.5.2. Japan
- 7.4.5.2.1. Key market trends, growth factors and opportunities
- 7.4.5.2.2. Market size and forecast, by Type
- 7.4.5.2.3. Market size and forecast, by Application
- 7.4.5.2.4. Market size and forecast, by Product
- 7.4.5.3. India
- 7.4.5.3.1. Key market trends, growth factors and opportunities
- 7.4.5.3.2. Market size and forecast, by Type
- 7.4.5.3.3. Market size and forecast, by Application
- 7.4.5.3.4. Market size and forecast, by Product
- 7.4.5.4. South Korea
- 7.4.5.4.1. Key market trends, growth factors and opportunities
- 7.4.5.4.2. Market size and forecast, by Type
- 7.4.5.4.3. Market size and forecast, by Application
- 7.4.5.4.4. Market size and forecast, by Product
- 7.4.5.5. Australia
- 7.4.5.5.1. Key market trends, growth factors and opportunities
- 7.4.5.5.2. Market size and forecast, by Type
- 7.4.5.5.3. Market size and forecast, by Application
- 7.4.5.5.4. Market size and forecast, by Product
- 7.4.5.6. Indonesia
- 7.4.5.6.1. Key market trends, growth factors and opportunities
- 7.4.5.6.2. Market size and forecast, by Type
- 7.4.5.6.3. Market size and forecast, by Application
- 7.4.5.6.4. Market size and forecast, by Product
- 7.4.5.7. Thailand
- 7.4.5.7.1. Key market trends, growth factors and opportunities
- 7.4.5.7.2. Market size and forecast, by Type
- 7.4.5.7.3. Market size and forecast, by Application
- 7.4.5.7.4. Market size and forecast, by Product
- 7.4.5.8. Malaysia
- 7.4.5.8.1. Key market trends, growth factors and opportunities
- 7.4.5.8.2. Market size and forecast, by Type
- 7.4.5.8.3. Market size and forecast, by Application
- 7.4.5.8.4. Market size and forecast, by Product
- 7.4.5.9. Rest of Asia-Pacific
- 7.4.5.9.1. Key market trends, growth factors and opportunities
- 7.4.5.9.2. Market size and forecast, by Type
- 7.4.5.9.3. Market size and forecast, by Application
- 7.4.5.9.4. Market size and forecast, by Product
- 7.5. LAMEA
- 7.5.1. Key trends and opportunities
- 7.5.2. Market size and forecast, by Type
- 7.5.3. Market size and forecast, by Application
- 7.5.4. Market size and forecast, by Product
- 7.5.5. Market size and forecast, by country
- 7.5.5.1. Brazil
- 7.5.5.1.1. Key market trends, growth factors and opportunities
- 7.5.5.1.2. Market size and forecast, by Type
- 7.5.5.1.3. Market size and forecast, by Application
- 7.5.5.1.4. Market size and forecast, by Product
- 7.5.5.2. South Africa,
- 7.5.5.2.1. Key market trends, growth factors and opportunities
- 7.5.5.2.2. Market size and forecast, by Type
- 7.5.5.2.3. Market size and forecast, by Application
- 7.5.5.2.4. Market size and forecast, by Product
- 7.5.5.3. Saudi Arabia
- 7.5.5.3.1. Key market trends, growth factors and opportunities
- 7.5.5.3.2. Market size and forecast, by Type
- 7.5.5.3.3. Market size and forecast, by Application
- 7.5.5.3.4. Market size and forecast, by Product
- 7.5.5.4. Rest of LAMEA
- 7.5.5.4.1. Key market trends, growth factors and opportunities
- 7.5.5.4.2. Market size and forecast, by Type
- 7.5.5.4.3. Market size and forecast, by Application
- 7.5.5.4.4. Market size and forecast, by Product
CHAPTER 8: COMPETITIVE LANDSCAPE
- 8.1. Introduction
- 8.2. Top winning strategies
- 8.3. Product Mapping of Top 10 Player
- 8.4. Competitive Dashboard
- 8.5. Competitive Heatmap
- 8.6. Top player positioning, 2022
CHAPTER 9: COMPANY PROFILES
- 9.1. Cargill, Incorporated
- 9.1.1. Company overview
- 9.1.2. Key Executives
- 9.1.3. Company snapshot
- 9.1.4. Operating business segments
- 9.1.5. Product portfolio
- 9.1.6. Key strategic moves and developments
- 9.2. Ingredion Incorporated.
- 9.2.1. Company overview
- 9.2.2. Key Executives
- 9.2.3. Company snapshot
- 9.2.4. Operating business segments
- 9.2.5. Product portfolio
- 9.2.6. Business performance
- 9.2.7. Key strategic moves and developments
- 9.3. Koninklijke DSM N.V.
- 9.3.1. Company overview
- 9.3.2. Key Executives
- 9.3.3. Company snapshot
- 9.3.4. Operating business segments
- 9.3.5. Product portfolio
- 9.3.6. Business performance
- 9.4. Archer-Daniels-Midland Company
- 9.4.1. Company overview
- 9.4.2. Key Executives
- 9.4.3. Company snapshot
- 9.4.4. Operating business segments
- 9.4.5. Product portfolio
- 9.4.6. Business performance
- 9.4.7. Key strategic moves and developments
- 9.5. CP Kelco U.S., Inc
- 9.5.1. Company overview
- 9.5.2. Key Executives
- 9.5.3. Company snapshot
- 9.5.4. Operating business segments
- 9.5.5. Product portfolio
- 9.6. Jungbunzlauer Suisse AG
- 9.6.1. Company overview
- 9.6.2. Key Executives
- 9.6.3. Company snapshot
- 9.6.4. Operating business segments
- 9.6.5. Product portfolio
- 9.6.6. Key strategic moves and developments
- 9.7. Deosen Biochemical (Ordos) Ltd.
- 9.7.1. Company overview
- 9.7.2. Key Executives
- 9.7.3. Company snapshot
- 9.7.4. Operating business segments
- 9.7.5. Product portfolio
- 9.8. Euroduna Food Ingredients GmbH
- 9.8.1. Company overview
- 9.8.2. Key Executives
- 9.8.3. Company snapshot
- 9.8.4. Operating business segments
- 9.8.5. Product portfolio
- 9.9. Kerry Group P.L.C.
- 9.9.1. Company overview
- 9.9.2. Key Executives
- 9.9.3. Company snapshot
- 9.9.4. Operating business segments
- 9.9.5. Product portfolio
- 9.9.6. Business performance
- 9.10. DuPont de Nemours, Inc.
- 9.10.1. Company overview
- 9.10.2. Key Executives
- 9.10.3. Company snapshot
- 9.10.4. Operating business segments
- 9.10.5. Product portfolio
- 9.10.6. Business performance
- 9.10.7. Key strategic moves and developments