|
|
市場調査レポート
商品コード
1676063
陸上電力供給の世界市場調査レポート:産業分析、規模、シェア、成長、動向、2025年から2033年までの予測Global Shore Power Market Research Report- Industry Analysis, Size, Share, Growth, Trends and Forecast 2025 to 2033 |
||||||
|
|||||||
カスタマイズ可能
|
|||||||

| 陸上電力供給の世界市場調査レポート:産業分析、規模、シェア、成長、動向、2025年から2033年までの予測 |
|
出版日: 2025年03月01日
発行: Value Market Research
ページ情報: 英文 238 Pages
納期: 即日から翌営業日
|

全表示
- 概要
- 図表
- 目次
陸上電力供給供給の世界市場規模は、2024年の22億1,000万米ドルから2033年には55億5,000万米ドルに成長し、2026~2033年の予測期間中に10.78%の堅調な年間平均成長率(CAGR)を示すと予測されます。
海運産業では、排出量を削減しエネルギー効率を高めるサステイナブルソリューションを求める傾向が強まっており、陸上電力供給供給市場は大きな成長を遂げる構えです。世界貿易と海運活動の増加に伴い、コールドアイロンとしても知られる陸上電力供給供給の需要が勢いを増しています。この技術は、停泊中の船舶が電力網に接続することを可能にし、ディーゼル発電機を停止して二酸化炭素排出量を大幅に削減することを可能にします。世界中の港湾がより厳しい環境規制を採用する中、陸上電力供給システムの導入はコンプライアンス上不可欠となっており、市場拡大を後押ししています。
技術の進歩もまた、陸上電力供給市場の進化に極めて重要な役割を果たしています。電気インフラとグリッド管理における革新は、陸上電力供給システムの信頼性と効率を高めています。スマートグリッド技術の統合は、より良い負荷管理とエネルギー分配を可能にし、船舶が中断を最小限に抑えながら安定した電力供給を受けることを保証します。さらに、大容量の変圧器とコンバータの開発により、陸上電力供給への移行が促進され、より幅広い船舶にとって実行可能な選択肢となっています。これらの技術が進歩し続けるにつれて、陸上電力供給市場は官民双方から大きな投資を集めると予想されます。
さらに、持続可能性と企業責任への関心の高まりが、陸上電力供給市場の成長軌道に影響を与えています。海運会社は、よりエコフレンドリープラクティスを採用するよう迫られており、陸上電力供給を利用することは、環境目標を達成するための現実的な解決策です。政府や環境団体を含む利害関係者がよりクリーンな海運プラクティスを提唱するにつれて、陸上電力供給インフラに対する需要が高まる可能性が高いです。この動向は、陸上電力供給市場の成長を支えるだけでなく、こうした技術に投資する企業を、よりサステイナブル海運産業への移行におけるリーダーとして位置付けています。
当社のレポートは、様々な産業や市場に関する包括的かつ実用的な洞察を顧客に提供するために綿密に作成されています。各レポートは、市場情勢を完全に理解するために、いくつかの重要な要素を含んでいます。
市場概要:市場概要:定義、分類、産業の現状など、市場に関する詳細なイントロダクション。
市場促進要因:市場成長に影響を与える主要促進要因・抑制要因・市場促進要因・課題を詳細に分析します。このセクションでは、技術の進歩、規制の変更、新たな動向などの要因を検証します。
セグメンテーション分析:製品タイプ、用途、エンドユーザー、地域などの基準に基づき、市場を明確なセグメントに内訳。この分析により、各セグメントの業績と将来性を明らかにします。
競合情勢:市場シェア、製品ポートフォリオ、戦略的イニシアティブ、財務実績など、主要市場参入企業の包括的評価。主要企業が採用する競合力学と主要戦略に関する考察を記載しています。
市場予測:過去のデータと現在の市場状況に基づき、一定期間における市場規模と成長動向を予測。これには、定量的分析と将来の市場軌跡を示すグラフ表示が含まれます。
地域分析:地域による市場パフォーマンスを評価し、主要市場や地域動向を明らかにします。地域の市場力学とビジネス機会を理解するのに役立ちます。
新たな動向と機会:現在の市場動向と新たな市場動向、技術革新、潜在的な投資対象セグメントを特定します。将来の市場開拓と成長展望に関する洞察を記載しています。
目次
第1章 序文
第2章 エグゼクティブサマリー
- 市場のハイライト
- 世界市場スナップショット
第3章 沿岸発電産業分析
- イントロダクション:市場力学
- 市場促進要因
- 市場抑制要因
- 機会
- 産業動向
- ポーターのファイブフォース分析
- 市場の魅力分析
第4章 バリューチェーン分析
- バリューチェーン分析
- 原料分析
- 原料リスト
- 原料メーカー一覧
- 主要原料の価格動向
- 潜在的バイヤーリスト
- マーケティングチャネル
- 直接マーケティング
- 間接マーケティング
- マーケティングチャネル発展動向
第5章 陸上電力供給の世界市場分析:出力別
- 出力別概要
- 出力別過去・予測データ分析
- 3MVA以下
- 3~10MVA
- 10MVA以上
第6章 陸上電力供給の世界市場分析:設置別
- 設置別概要
- 設置別過去・予測データ分析
- 新設
- 改修設置
第7章 世界の陸上電力供給市場分析:接続別
- 接続別概要
- 接続別過去・予測データ分析
- 港湾ターミナル
- 船舶への電力供給
- 電子船舶への充電
第8章 陸上電力供給供給の世界市場分析:コンポーネント別
- コンポーネント別概要
- コンポーネント別過去・予測データ分析
- 変圧器
- 配電システム
- 制御盤
- 周波数変換器
- ケーブルリールとコネクター
- 配電盤
- その他
第9章 陸上電力供給の世界市場分析:地域別
- 地域別展望
- イントロダクション
- 北米の売上分析
- 概要、実績と予測
- 北米:セグメント別
- 北米:国別
- 米国
- カナダ
- メキシコ
- 欧州売上分析
- 概要、実績と予測
- 欧州:セグメント別
- 欧州:国別
- 英国
- フランス
- ドイツ
- イタリア
- ロシア
- その他の欧州
- アジア太平洋売上分析
- 概要、実績と予測
- アジア太平洋:セグメント別
- アジア太平洋:国別
- 中国
- インド
- 日本
- 韓国
- オーストラリア
- 東南アジア
- その他のアジア太平洋
- ラテンアメリカ売上分析
- 概要、実績と予測
- ラテンアメリカ:セグメント別
- ラテンアメリカ:国別
- ブラジル
- アルゼンチン
- ペルー
- チリ
- その他のラテンアメリカ
- 中東・アフリカ売上分析
- 概要、実績と予測
- 中東・アフリカ:セグメント別
- 中東・アフリカ:国別一覧
- サウジアラビア
- アラブ首長国連邦
- イスラエル
- 南アフリカ
- その他の中東・アフリカ
第10章 陸上電力供給企業の競合情勢
- 陸上電力供給市場の競合
- 提携・協力・協定
- 合併・買収
- 新製品投入
- その他の開発
第11章 企業プロファイル
- 上位企業の市場シェア分析
- 市場集中度
- ABB
- Wartsila
- Cavotec SA
- Siemens
- Yara Marine Technologies
- PowerCon A/S.
- Preen(AC Power Corp)
- Danfoss
- Hareid Group.
- Schneider Electric
- Wabtec Corporation
- General Electric
- Blueday Technology AS
LIST OF TABLES
- Market Snapshot
- Drivers: Impact Analysis
- Restraints: Impact Analysis
- List of Raw Material
- List of Raw Material Manufactures
- Analysis By Power Output (KVA for volume and USD MN)
- Upto3 MVA Market Sales By Geography (KVA for volume and USD MN)
- 3MVAto 10 MVA Market Sales By Geography (KVA for volume and USD MN)
- >10MVA Market Sales By Geography (KVA for volume and USD MN)
- Analysis By Installation (KVA for volume and USD MN)
- New Market Sales By Geography (KVA for volume and USD MN)
- Retrofit Market Sales By Geography (KVA for volume and USD MN)
- Analysis By Connection (KVA for volume and USD MN)
- Port Terminal Market Sales By Geography (KVA for volume and USD MN)
- Shore Power to Ship Market Sales By Geography (KVA for volume and USD MN)
- E-Vessel Charging Market Sales By Geography (KVA for volume and USD MN)
- Analysis By Component (KVA for volume and USD MN)
- Transformer Market Sales By Geography (KVA for volume and USD MN)
- Power Distribution System Market Sales By Geography (KVA for volume and USD MN)
- Control Panel Market Sales By Geography (KVA for volume and USD MN)
- Frequency Converter Market Sales By Geography (KVA for volume and USD MN)
- Cable Reel and Connectors Market Sales By Geography (KVA for volume and USD MN)
- Switchboard Market Sales By Geography (KVA for volume and USD MN)
- Others Market Sales By Geography (KVA for volume and USD MN)
- Global Shore Power Market Sales By Geography (KVA for volume and USD MN)
- North America Market Analysis (KVA for volume and USD MN)
- United States Market Analysis (KVA for volume and USD MN)
- Canada Market Analysis (KVA for volume and USD MN)
- Mexico Market Analysis (KVA for volume and USD MN)
- Europe Market Analysis (KVA for volume and USD MN)
- Europe Market Estimate By Country (KVA for volume and USD MN)
- United Kingdom Market Analysis (KVA for volume and USD MN)
- France Market Analysis (KVA for volume and USD MN)
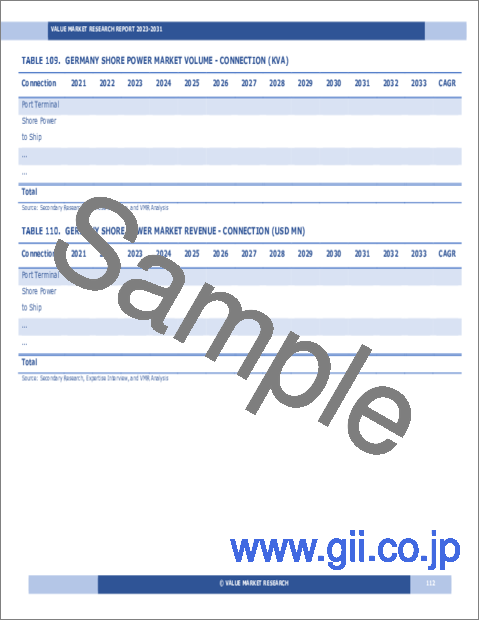
- Germany Market Analysis (KVA for volume and USD MN)
- Italy Market Analysis (KVA for volume and USD MN)
- Russia Market Analysis (KVA for volume and USD MN)
- Spain Market Analysis (KVA for volume and USD MN)
- Rest of Europe Market Analysis (KVA for volume and USD MN)
- Asia Pacific Market Analysis (KVA for volume and USD MN)
- China Market Analysis (KVA for volume and USD MN)
- Japan Market Analysis (KVA for volume and USD MN)
- India Market Analysis (KVA for volume and USD MN)
- South Korea Market Analysis (KVA for volume and USD MN)
- Australia Market Analysis (KVA for volume and USD MN)
- South East Asia Market Analysis (KVA for volume and USD MN)
- Rest of Asia Pacific Market Analysis (KVA for volume and USD MN)
- Latin America Market Analysis (KVA for volume and USD MN)
- Brazil Market Analysis (KVA for volume and USD MN)
- Argentina Market Analysis (KVA for volume and USD MN)
- Peru Market Analysis (KVA for volume and USD MN)
- Chile Market Analysis (KVA for volume and USD MN)
- Rest of Latin America Market Analysis (KVA for volume and USD MN)
- Middle East & Africa Market Analysis (KVA for volume and USD MN)
- Saudi Arabia Market Analysis (KVA for volume and USD MN)
- UAE Market Analysis (KVA for volume and USD MN)
- Israel Market Analysis (KVA for volume and USD MN)
- South Africa Market Analysis (KVA for volume and USD MN)
- Rest of Middle East and Africa Market Analysis (KVA for volume and USD MN)
- Partnership/Collaboration/Agreement
- Mergers And Acquisition
LIST OF FIGURES
- Research Scope of Shore Power Report
- Market Research Process
- Market Research Methodology
- Global Shore Power Market Size, By Region (KVA for volume and USD MN)
- Porters Five Forces Analysis
- Market Attractiveness Analysis By Power Output
- Market Attractiveness Analysis By Installation
- Market Attractiveness Analysis By Connection
- Market Attractiveness Analysis By Component
- Market Attractiveness Analysis By Region
- Value Chain Analysis
- Global Market Analysis By Power Output (KVA for volume and USD MN)
- Upto3 MVA Market Sales By Geography (KVA for volume and USD MN)
- 3MVAto 10 MVA Market Sales By Geography (KVA for volume and USD MN)
- >10MVA Market Sales By Geography (KVA for volume and USD MN)
- Global Market Analysis By Installation (KVA for volume and USD MN)
- New Market Sales By Geography (KVA for volume and USD MN)
- Retrofit Market Sales By Geography (KVA for volume and USD MN)
- Global Market Analysis By Connection (KVA for volume and USD MN)
- Port Terminal Market Sales By Geography (KVA for volume and USD MN)
- Shore Power to Ship Market Sales By Geography (KVA for volume and USD MN)
- E-Vessel Charging Market Sales By Geography (KVA for volume and USD MN)
- Global Market Analysis By Component (KVA for volume and USD MN)
- Transformer Market Sales By Geography (KVA for volume and USD MN)
- Power Distribution System Market Sales By Geography (KVA for volume and USD MN)
- Control Panel Market Sales By Geography (KVA for volume and USD MN)
- Frequency Converter Market Sales By Geography (KVA for volume and USD MN)
- Cable Reel and Connectors Market Sales By Geography (KVA for volume and USD MN)
- Switchboard Market Sales By Geography (KVA for volume and USD MN)
- Others Market Sales By Geography (KVA for volume and USD MN)
- Global Market Sales (KVA for volume and USD MN)
- North America Market Sales (KVA for volume and USD MN)
- Europe Market Sales (KVA for volume and USD MN)
- Asia Pacific Market Sales (KVA for volume and USD MN)
- Latin America Market Sales (KVA for volume and USD MN)
- Middle East & Africa Market Sales (KVA for volume and USD MN)
- Recent Development in Industry
- Top Company Market Share Analysis
Kindly note that the above listed are the basic tables and figures of the report and are not limited to the TOC.
Global Shore Power Market size is anticipated to grow from USD 2.21 Billion in 2024 to USD 5.55 Billion by 2033, showcasing a robust Compound Annual Growth Rate (CAGR) of 10.78% during the forecast period of 2026 to 2033.
The Shore Power Market is poised for significant growth as the maritime industry increasingly seeks sustainable solutions to reduce emissions and enhance energy efficiency. With the rise in global trade and shipping activities, the demand for shore power-also known as cold ironing-has gained momentum. This technology allows vessels to connect to the electrical grid while docked, enabling them to turn off their diesel generators and significantly lower their carbon footprint. As ports around the world adopt stricter environmental regulations, the implementation of shore power systems is becoming essential for compliance, driving market expansion.
Technological advancements are also playing a pivotal role in the evolution of the shore power market. Innovations in electrical infrastructure and grid management are enhancing the reliability and efficiency of shore power systems. The integration of smart grid technologies allows for better load management and energy distribution, ensuring that vessels receive a stable power supply while minimizing disruptions. Additionally, the development of high-capacity transformers and converters is facilitating the transition to shore power, making it a more viable option for a wider range of vessels. As these technologies continue to advance, the shore power market is expected to attract significant investments from both public and private sectors.
Moreover, the increasing focus on sustainability and corporate responsibility is influencing the shore power market's growth trajectory. Shipping companies are under pressure to adopt greener practices, and utilizing shore power is a practical solution to meet environmental targets. As stakeholders, including governments and environmental organizations, advocate for cleaner shipping practices, the demand for shore power infrastructure is likely to rise. This trend not only supports the growth of the shore power market but also positions companies that invest in these technologies as leaders in the transition towards a more sustainable maritime industry.
Our reports are meticulously crafted to provide clients with comprehensive and actionable insights into various industries and markets. Each report encompasses several critical components to ensure a thorough understanding of the market landscape:
Market Overview: A detailed introduction to the market, including definitions, classifications, and an overview of the industry's current state.
Market Dynamics: In-depth analysis of key drivers, restraints, opportunities, and challenges influencing market growth. This section examines factors such as technological advancements, regulatory changes, and emerging trends.
Segmentation Analysis: Breakdown of the market into distinct segments based on criteria like product type, application, end-user, and geography. This analysis highlights the performance and potential of each segment.
Competitive Landscape: Comprehensive assessment of major market players, including their market share, product portfolio, strategic initiatives, and financial performance. This section provides insights into the competitive dynamics and key strategies adopted by leading companies.
Market Forecast: Projections of market size and growth trends over a specified period, based on historical data and current market conditions. This includes quantitative analyses and graphical representations to illustrate future market trajectories.
Regional Analysis: Evaluation of market performance across different geographical regions, identifying key markets and regional trends. This helps in understanding regional market dynamics and opportunities.
Emerging Trends and Opportunities: Identification of current and emerging market trends, technological innovations, and potential areas for investment. This section offers insights into future market developments and growth prospects.
SEGMENTATION COVERED IN THE REPORT
By Power Output
- Upto3 MVA
- 3MVAto 10 MVA
- >10MVA
By Installation
- New
- Retrofit
By Connection
- Port Terminal
- Shore Power to Ship
- E-Vessel Charging
By Component
- Transformer
- Power Distribution System
- Control Panel
- Frequency Converter
- Cable Reel and Connectors
- Switchboard
- Others
- COMPANIES PROFILED
- ABB
- Wartsila
- Cavotec SA
- Siemens
- Yara Marine Technologies
- PowerCon A/S.
- Preen (AC Power Corp)
- Danfoss
- Hareid Group.
- Schneider Electric
- Wabtec Corporation
- General Electric
- Blueday Technology AS
- The above list can be customized.
TABLE OF CONTENTS
1. PREFACE
- 1.1. Report Description
- 1.1.1 Objective
- 1.1.2 Target Audience
- 1.1.3 Unique Selling Proposition (USP) & offerings
- 1.2. Research Scope
- 1.3. Research Methodology
- 1.3.1 Market Research Process
- 1.3.2 Market Research Methodology
2. EXECUTIVE SUMMARY
- 2.1. Highlights of Market
- 2.2. Global Market Snapshot
3. SHORE POWER a€" INDUSTRY ANALYSIS
- 3.1. Introduction - Market Dynamics
- 3.2. Market Drivers
- 3.3. Market Restraints
- 3.4. Opportunities
- 3.5. Industry Trends
- 3.6. Porters Five Force Analysis
- 3.7. Market Attractiveness Analysis
- 3.7.1 Market Attractiveness Analysis By Power Output
- 3.7.2 Market Attractiveness Analysis By Installation
- 3.7.3 Market Attractiveness Analysis By Connection
- 3.7.4 Market Attractiveness Analysis By Component
- 3.7.5 Market Attractiveness Analysis By Region
4. VALUE CHAIN ANALYSIS
- 4.1. Value Chain Analysis
- 4.2. Raw Material Analysis
- 4.2.1 List of Raw Materials
- 4.2.2 Raw Material Manufactures List
- 4.2.3 Price Trend of Key Raw Materials
- 4.3. List of Potential Buyers
- 4.4. Marketing Channel
- 4.4.1 Direct Marketing
- 4.4.2 Indirect Marketing
- 4.4.3 Marketing Channel Development Trend
5. GLOBAL SHORE POWER MARKET ANALYSIS BY POWER OUTPUT
- 5.1. Overview By Power Output
- 5.2. Historical and Forecast Data Analysis By Power Output
- 5.3. Upto3 MVA Historic and Forecast Sales By Regions
- 5.4. 3MVAto 10 MVA Historic and Forecast Sales By Regions
- 5.5. >10MVA Historic and Forecast Sales By Regions
6. GLOBAL SHORE POWER MARKET ANALYSIS BY INSTALLATION
- 6.1. Overview By Installation
- 6.2. Historical and Forecast Data Analysis By Installation
- 6.3. New Historic and Forecast Sales By Regions
- 6.4. Retrofit Historic and Forecast Sales By Regions
7. GLOBAL SHORE POWER MARKET ANALYSIS BY CONNECTION
- 7.1. Overview By Connection
- 7.2. Historical and Forecast Data Analysis By Connection
- 7.3. Port Terminal Historic and Forecast Sales By Regions
- 7.4. Shore Power to Ship Historic and Forecast Sales By Regions
- 7.5. E-Vessel Charging Historic and Forecast Sales By Regions
8. GLOBAL SHORE POWER MARKET ANALYSIS BY COMPONENT
- 8.1. Overview By Component
- 8.2. Historical and Forecast Data Analysis By Component
- 8.3. Transformer Historic and Forecast Sales By Regions
- 8.4. Power Distribution System Historic and Forecast Sales By Regions
- 8.5. Control Panel Historic and Forecast Sales By Regions
- 8.6. Frequency Converter Historic and Forecast Sales By Regions
- 8.7. Cable Reel and Connectors Historic and Forecast Sales By Regions
- 8.8. Switchboard Historic and Forecast Sales By Regions
- 8.9. Others Historic and Forecast Sales By Regions
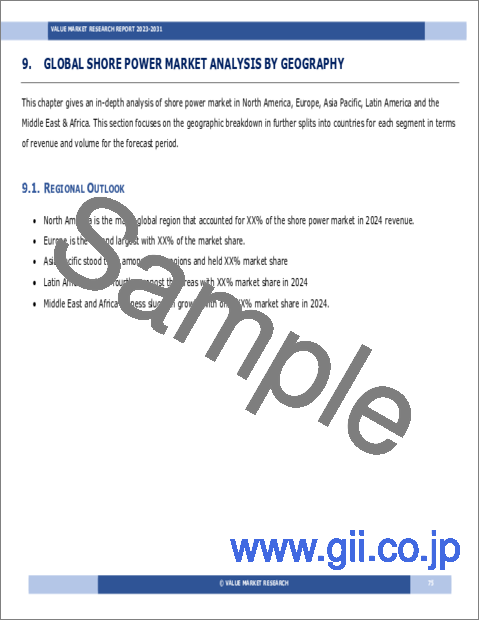
9. GLOBAL SHORE POWER MARKET ANALYSIS BY GEOGRAPHY
- 9.1. Regional Outlook
- 9.2. Introduction
- 9.3. North America Sales Analysis
- 9.3.1 Overview, Historic and Forecast Data Sales Analysis
- 9.3.2 North America By Segment Sales Analysis
- 9.3.3 North America By Country Sales Analysis
- 9.3.4 United States Sales Analysis
- 9.3.5 Canada Sales Analysis
- 9.3.6 Mexico Sales Analysis
- 9.4. Europe Sales Analysis
- 9.4.1 Overview, Historic and Forecast Data Sales Analysis
- 9.4.2 Europe By Segment Sales Analysis
- 9.4.3 Europe By Country Sales Analysis
- 9.4.4 United Kingdom Sales Analysis
- 9.4.5 France Sales Analysis
- 9.4.6 Germany Sales Analysis
- 9.4.7 Italy Sales Analysis
- 9.4.8 Russia Sales Analysis
- 9.4.9 Rest Of Europe Sales Analysis
- 9.5. Asia Pacific Sales Analysis
- 9.5.1 Overview, Historic and Forecast Data Sales Analysis
- 9.5.2 Asia Pacific By Segment Sales Analysis
- 9.5.3 Asia Pacific By Country Sales Analysis
- 9.5.4 China Sales Analysis
- 9.5.5 India Sales Analysis
- 9.5.6 Japan Sales Analysis
- 9.5.7 South Korea Sales Analysis
- 9.5.8 Australia Sales Analysis
- 9.5.9 South East Asia Sales Analysis
- 9.5.10 Rest Of Asia Pacific Sales Analysis
- 9.6. Latin America Sales Analysis
- 9.6.1 Overview, Historic and Forecast Data Sales Analysis
- 9.6.2 Latin America By Segment Sales Analysis
- 9.6.3 Latin America By Country Sales Analysis
- 9.6.4 Brazil Sales Analysis
- 9.6.5 Argentina Sales Analysis
- 9.6.6 Peru Sales Analysis
- 9.6.7 Chile Sales Analysis
- 9.6.8 Rest of Latin America Sales Analysis
- 9.7. Middle East & Africa Sales Analysis
- 9.7.1 Overview, Historic and Forecast Data Sales Analysis
- 9.7.2 Middle East & Africa By Segment Sales Analysis
- 9.7.3 Middle East & Africa By Country Sales Analysis
- 9.7.4 Saudi Arabia Sales Analysis
- 9.7.5 UAE Sales Analysis
- 9.7.6 Israel Sales Analysis
- 9.7.7 South Africa Sales Analysis
- 9.7.8 Rest Of Middle East And Africa Sales Analysis
10. COMPETITIVE LANDSCAPE OF THE SHORE POWER COMPANIES
- 10.1. Shore Power Market Competition
- 10.2. Partnership/Collaboration/Agreement
- 10.3. Merger And Acquisitions
- 10.4. New Product Launch
- 10.5. Other Developments
11. COMPANY PROFILES OF SHORE POWER INDUSTRY
- 11.1. Top Companies Market Share Analysis
- 11.2. Market Concentration Rate
- 11.3. ABB
- 11.3.1 Company Overview
- 11.3.2 Company Revenue
- 11.3.3 Products
- 11.3.4 Recent Developments
- 11.4. Wartsila
- 11.4.1 Company Overview
- 11.4.2 Company Revenue
- 11.4.3 Products
- 11.4.4 Recent Developments
- 11.5. Cavotec SA
- 11.5.1 Company Overview
- 11.5.2 Company Revenue
- 11.5.3 Products
- 11.5.4 Recent Developments
- 11.6. Siemens
- 11.6.1 Company Overview
- 11.6.2 Company Revenue
- 11.6.3 Products
- 11.6.4 Recent Developments
- 11.7. Yara Marine Technologies
- 11.7.1 Company Overview
- 11.7.2 Company Revenue
- 11.7.3 Products
- 11.7.4 Recent Developments
- 11.8. PowerCon A/S.
- 11.8.1 Company Overview
- 11.8.2 Company Revenue
- 11.8.3 Products
- 11.8.4 Recent Developments
- 11.9. Preen (AC Power Corp)
- 11.9.1 Company Overview
- 11.9.2 Company Revenue
- 11.9.3 Products
- 11.9.4 Recent Developments
- 11.10. Danfoss
- 11.10.1 Company Overview
- 11.10.2 Company Revenue
- 11.10.3 Products
- 11.10.4 Recent Developments
- 11.11. Hareid Group.
- 11.11.1 Company Overview
- 11.11.2 Company Revenue
- 11.11.3 Products
- 11.11.4 Recent Developments
- 11.12. Schneider Electric
- 11.12.1 Company Overview
- 11.12.2 Company Revenue
- 11.12.3 Products
- 11.12.4 Recent Developments
- 11.13. Wabtec Corporation
- 11.13.1 Company Overview
- 11.13.2 Company Revenue
- 11.13.3 Products
- 11.13.4 Recent Developments
- 11.14. General Electric
- 11.14.1 Company Overview
- 11.14.2 Company Revenue
- 11.14.3 Products
- 11.14.4 Recent Developments
- 11.15. Blueday Technology AS
- 11.15.1 Company Overview
- 11.15.2 Company Revenue
- 11.15.3 Products
- 11.15.4 Recent Developments
- 11.16.
- 11.16.1 Company Overview
- 11.16.2 Company Revenue
- 11.16.3 Products
- 11.16.4 Recent Developments

