|
|
市場調査レポート
商品コード
1594228
陸上電力供給市場:設置タイプ別、接続タイプ別、コンポーネント別、出力別、地域別 - 2029年までの予測Shore Power Market by Installation Type (Shoreside, Shipside), Connection (New Installation, Retrofit), Component (Transformer, Switchgear, Frequency converter, Cables and Accessories), Power Output - Global Forecast to 2029 |
||||||
|
|||||||
カスタマイズ可能
|
|||||||

| 陸上電力供給市場:設置タイプ別、接続タイプ別、コンポーネント別、出力別、地域別 - 2029年までの予測 |
|
出版日: 2024年11月14日
発行: MarketsandMarkets
ページ情報: 英文 314 Pages
納期: 即納可能
|

全表示
- 概要
- 図表
- 目次
世界の陸上電力供給の市場規模は、2024年の20億3,000万米ドルから2029年には35億8,000万米ドルへと、予測期間中に12.0%のCAGRで大きく成長すると予測されています。
世界の陸上電力供給市場の成長を後押しする要因は複数あります。環境意識の高まりや海運活動からの排出を制限する規制があるため、港湾や海運会社は陸上電力供給のような環境に優しい選択肢を取り入れる必要があります。もう一つの重要な要因は、脱炭素化とクリーンエネルギー技術への重点が高まっていることで、特にこのシステムが陸上電力の調達に役立つことで、温室効果ガスの排出を容易に削減し、世界の持続可能性目標を達成することが可能になっています。さらに、アップグレードされた陸上電力システムやエネルギー効率の高い機器などの要因により、これらのシステムを採用することが実行可能で費用対効果が高くなっています。さらに、政府の政策やインセンティブは、ショアパワーネットワークの世界の発展を促進するのに役立っています。
| 調査範囲 | |
|---|---|
| 調査対象年 | 2020年~2029年 |
| 基準年 | 2023年 |
| 予測期間 | 2024年~2029年 |
| 検討単位 | 金額(100万米ドル/10億米ドル) |
| セグメント別 | 設置タイプ別、接続タイプ別、コンポーネント別、出力別、地域別 |
| 対象地域 | 北米、欧州、アジア太平洋、中東・アフリカ、南米 |
世界の陸上電力供給市場セグメント「60MVA以上」は、市場シェア第3位にランクされています。その主な理由は、コンテナ船や石油タンカーのような大型船舶で使用される大容量電力ソリューションのニーズが高まっていることです。これらのタイプの船舶は、多くのシステムが船上で稼動しているため、大量の電気エネルギーを消費しており、効果的でクリーンな運用のためには、大容量の配備可能な陸上電力供給接続が必要です。さらに、港湾は、船舶が停泊している間の排出ガスの大幅な削減を含む、より大きなオペレーションを担当するためのより良い施設を開発しています。このセグメントはまた、排出を回避するために大型船舶にショアパワーの使用を義務付ける規制の実施が増加していることによって牽引されています。したがって、これらの理由により、60MVA以上のシステム能力を持つ陸上電力供給システムに対する要求が高まっており、市場での地位を確立しています。
世界の陸上電力供給市場における設置タイプ別市場の範囲内の「新規設置」サブセグメントは、陸上電力供給システムを備えた新しい港湾施設の建設動向の高まりにより、2番目に大きな市場シェアを獲得しています。港湾や海運会社は、持続可能性や二酸化炭素排出量削減への関心を高めており、新港や新造船に陸上電力設備を組み込む新規プロジェクトが増加傾向にあります。古い施設の改築のための高水準の投資は、政府のインフラ目標に沿い、効率的でもある、よりクリーンで環境に優しい技術を採用する意欲を示しています。さらに、陸上電力供給ソリューションにおける先端技術の統合は、より高度でエネルギー消費量の多い船舶が港湾に導入されるにつれて、重要な市場戦略となり、新規設置の市場を加速させます。
当レポートでは、世界の陸上電力供給市場について調査し、設置タイプ別、接続タイプ別、コンポーネント別、出力別、地域別動向、および市場に参入する企業のプロファイルなどをまとめています。
目次
第1章 イントロダクション
第2章 調査手法
第3章 エグゼクティブサマリー
第4章 重要考察
第5章 市場概要
- イントロダクション
- 市場力学
- 顧客ビジネスに影響を与える動向/混乱
- エコシステム分析
- 価格分析
- 投資と資金調達のシナリオ
- サプライチェーン分析
- 技術分析
- 2024年~2025年の主な会議とイベント
- 貿易分析
- 関税と規制状況
- 特許分析
- ポーターのファイブフォース分析
- 主な利害関係者と購入基準
- ケーススタディ分析
- 生成AI/AIが陸上電力市場に与える影響
- 陸上電力供給市場のマクロ経済見通し
第6章 陸上電力供給市場(設置タイプ別)
- イントロダクション
- ショアサイド
- シップサイド
第7章 陸上電力供給市場(接続タイプ別)
- イントロダクション
- 新規
- 改造
第8章 陸上電力供給市場(コンポーネント別)
- イントロダクション
- 周波数コンバータ
- トランスフォーマー
- スイッチギアデバイス
- ケーブルとアクセサリー
- その他
第9章 陸上電力市場(出力別)
- イントロダクション
- 30MVA以下
- 30~60MVA
- 60MVA以上
第10章 陸上電力市場(地域別)
- イントロダクション
- アジア太平洋
- 北米
- 欧州
- 中東・アフリカ
- 南米
第11章 競合情勢
- イントロダクション
- 主要参入企業の戦略/強み、2021年~2024年
- 収益分析、2019年~2023年
- 市場シェア分析、2023年
- 企業価値評価と財務指標
- 製品タイプ/地理的プレゼンスの比較
- 企業評価マトリックス:主要参入企業、2023年
- 企業評価マトリックス:スタートアップ/中小企業、2023年
- 競合シナリオ
第12章 企業プロファイル
- 主要参入企業
- GENERAL ELECTRIC COMPANY
- SIEMENS
- SCHNEIDER ELECTRIC
- ABB
- CAVOTEC SA
- EATON
- VINCI ENERGIES
- WARTSILA
- HITACHI ENERGY LTD.
- DANFOSS
- WABTEC CORPORATION
- POWERCON A/S
- ESL POWER SYSTEMS, INC.
- IGUS
- BLUE DAY TECHNOLOGY
- WATTS MARINE
- AC POWER CORP.
- SMARTPLUG
- PILLER POWER SYSTEMS
- POWER SYSTEMS INTERNATIONAL
- その他の企業
- MANTA MARINE TECHNOLOGIES
- CONNTEK INTEGRATED SOLUTIONS INC(U.S.A)
- PATTON & COOKE CO.
- RATIO ELECTRIC B.V.
- SYDNEY MARINE ELECTRICALS
第13章 付録
List of Tables
- TABLE 1 SHORE POWER MARKET, BY INSTALLATION TYPE: INCLUSIONS AND EXCLUSIONS
- TABLE 2 SHORE POWER MARKET, BY CONNECTION TYPE: INCLUSIONS AND EXCLUSIONS
- TABLE 3 SHORE POWER MARKET, BY COMPONENT: INCLUSIONS AND EXCLUSIONS
- TABLE 4 SHORE POWER MARKET, BY POWER OUTPUT: INCLUSIONS AND EXCLUSIONS
- TABLE 5 SHORE POWER MARKET SIZE ESTIMATION METHODOLOGY (DEMAND SIDE)
- TABLE 6 SHORE POWER MARKET: RISK ANALYSIS
- TABLE 7 SNAPSHOT OF SHORE POWER MARKET
- TABLE 8 SELECTED VOLUNTARY INITIATIVES FOR DECARBONIZING SHIPPING
- TABLE 9 ESTIMATED COST FOR IMPLEMENTING SHORE POWER ON BOARD VESSELS, BY CAPACITY (USD)
- TABLE 10 PORTS WITH CARBON-NEUTRAL AND SHORE POWER AMBITIONS OR TARGETS
- TABLE 11 ROLE OF COMPANIES IN ECOSYSTEM
- TABLE 12 INDICATIVE PRICING OF SHORE POWER SYSTEM COMPONENTS, 2023
- TABLE 13 INDICATIVE PRICING OF SHORE POWER SYSTEMS, BY VESSEL, 2023
- TABLE 14 SHORE POWER MARKET: LIST OF CONFERENCES AND EVENTS, 2024-2025
- TABLE 15 IMPORT SCENARIO FOR HS CODE 8504-COMPLIANT PRODUCTS, BY COUNTRY, 2019-2023 (USD THOUSAND)
- TABLE 16 EXPORT SCENARIO FOR HS CODE 8504-COMPLIANT PRODUCTS, BY COUNTRY, 2019-2023 (USD THOUSAND)
- TABLE 17 IMPORT TARIFFS FOR HS 8504-COMPLIANT PRODUCTS, BY COUNTRY, 2023
- TABLE 18 NORTH AMERICA: LIST OF REGULATORY BODIES, GOVERNMENT AGENCIES, AND OTHER ORGANIZATIONS
- TABLE 19 EUROPE: LIST OF REGULATORY BODIES, GOVERNMENT AGENCIES, AND OTHER ORGANIZATIONS
- TABLE 20 ASIA PACIFIC: LIST OF REGULATORY BODIES, GOVERNMENT AGENCIES, AND OTHER ORGANIZATIONS
- TABLE 21 MIDDLE EAST & AFRICA: LIST OF REGULATORY BODIES, GOVERNMENT AGENCIES, AND OTHER ORGANIZATIONS
- TABLE 22 SOUTH AMERICA: LIST OF REGULATORY BODIES, GOVERNMENT AGENCIES, AND OTHER ORGANIZATIONS
- TABLE 23 SHORE POWER MARKET: CODES AND REGULATIONS
- TABLE 24 SHORE POWER MARKET: INNOVATIONS AND PATENT REGISTRATIONS, JANUARY 2020-DECEMBER 2023
- TABLE 25 SHORE POWER MARKET: PORTER'S FIVE FORCES ANALYSIS
- TABLE 26 INFLUENCE OF KEY STAKEHOLDERS ON BUYING PROCESS FOR TOP 3 COMPONENTS
- TABLE 27 KEY BUYING CRITERIA FOR TOP 3 COMPONENTS
- TABLE 28 SHORE POWER MARKET, BY INSTALLATION TYPE, 2020-2023 (USD MILLION)
- TABLE 29 SHORE POWER MARKET, BY INSTALLATION TYPE, 2024-2029 (USD MILLION)
- TABLE 30 SHORESIDE: SHORE POWER MARKET, BY REGION, 2020-2023 (USD MILLION)
- TABLE 31 SHORESIDE: SHORE POWER MARKET, BY REGION, 2024-2029 (USD MILLION)
- TABLE 32 SHIPSIDE: SHORE POWER MARKET, BY REGION, 2020-2023 (USD MILLION)
- TABLE 33 SHIPSIDE: SHORE POWER MARKET, BY REGION, 2024-2029 (USD MILLION)
- TABLE 34 SHIPSIDE: SHORE POWER MARKET, BY VESSEL, 2020-2023 (USD MILLION)
- TABLE 35 SHIPSIDE: SHORE POWER MARKET, BY VESSEL, 2024-2029 (USD MILLION)
- TABLE 36 CRUISE: SHORE POWER MARKET FOR SHIPSIDE INSTALLATIONS, BY REGION, 2020-2023 (USD MILLION)
- TABLE 37 CRUISE: SHORE POWER MARKET FOR SHIPSIDE INSTALLATIONS, BY REGION, 2024-2029 (USD MILLION)
- TABLE 38 FERRY: SHORE POWER MARKET FOR SHIPSIDE INSTALLATIONS, BY REGION, 2020-2023 (USD MILLION)
- TABLE 39 FERRY: SHORE POWER MARKET FOR SHIPSIDE INSTALLATIONS, BY REGION, 2024-2029 (USD MILLION)
- TABLE 40 CONTAINER VESSEL: SHORE POWER MARKET FOR SHIPSIDE INSTALLATIONS, BY REGION, 2020-2023 (USD MILLION)
- TABLE 41 CONTAINER VESSEL: SHORE POWER MARKET FOR SHIPSIDE INSTALLATIONS, BY REGION, 2024-2029 (USD MILLION)
- TABLE 42 RO-RO AND VEHICLE CARRIER: SHORE POWER MARKET FOR SHIPSIDE INSTALLATIONS, BY REGION, 2020-2023 (USD MILLION)
- TABLE 43 RO-RO AND VEHICLE CARRIER: SHORE POWER MARKET FOR SHIPSIDE INSTALLATIONS, BY REGION, 2024-2029 (USD MILLION)
- TABLE 44 BULK CARRIER: SHORE POWER MARKET FOR SHIPSIDE INSTALLATIONS, BY REGION, 2020-2023 (USD MILLION)
- TABLE 45 BULK CARRIER: SHORE POWER MARKET FOR SHIPSIDE INSTALLATIONS, BY REGION, 2024-2029 (USD MILLION)
- TABLE 46 TANKER: SHORE POWER MARKET FOR SHIPSIDE INSTALLATIONS, BY REGION, 2020-2023 (USD MILLION)
- TABLE 47 TANKER: SHORE POWER MARKET FOR SHIPSIDE INSTALLATIONS, BY REGION, 2024-2029 (USD MILLION)
- TABLE 48 GENERAL CARGO: SHORE POWER MARKET FOR SHIPSIDE INSTALLATIONS, BY REGION, 2020-2023 (USD MILLION)
- TABLE 49 GENERAL CARGO: SHORE POWER MARKET FOR SHIPSIDE INSTALLATIONS, BY REGION, 2024-2029 (USD MILLION)
- TABLE 50 OTHER VESSELS: SHORE POWER MARKET FOR SHIPSIDE INSTALLATIONS, BY REGION, 2020-2023 (USD MILLION)
- TABLE 51 OTHER VESSELS: SHORE POWER MARKET FOR SHIPSIDE INSTALLATIONS, BY REGION, 2024-2029 (USD MILLION)
- TABLE 52 SHORE POWER MARKET, BY CONNECTION TYPE, 2020-2023 (USD MILLION)
- TABLE 53 SHORE POWER MARKET, BY CONNECTION TYPE, 2024-2029 (USD MILLION)
- TABLE 54 NEW INSTALLATIONS: SHORE POWER MARKET, BY REGION, 2020-2023 (USD MILLION)
- TABLE 55 NEW INSTALLATIONS: SHORE POWER MARKET, BY REGION, 2024-2029 (USD MILLION)
- TABLE 56 RETROFITS: SHORE POWER MARKET, BY REGION, 2020-2023 (USD MILLION)
- TABLE 57 RETROFITS: SHORE POWER MARKET, BY REGION, 2024-2029 (USD MILLION)
- TABLE 58 SHORE POWER MARKET, BY COMPONENT, 2020-2023 (USD MILLION)
- TABLE 59 SHORE POWER MARKET, BY COMPONENT, 2024-2029 (USD MILLION)
- TABLE 60 FREQUENCY CONVERTERS: SHORE POWER MARKET, BY REGION, 2020-2023 (USD MILLION)
- TABLE 61 FREQUENCY CONVERTERS: SHORE POWER MARKET, BY REGION, 2024-2029 (USD MILLION)
- TABLE 62 TRANSFORMERS: SHORE POWER MARKET, BY REGION, 2020-2023 (USD MILLION)
- TABLE 63 TRANSFORMERS: SHORE POWER MARKET, BY REGION, 2024-2029 (USD MILLION)
- TABLE 64 SWITCHGEAR DEVICES: SHORE POWER MARKET, BY REGION, 2020-2023 (USD MILLION)
- TABLE 65 SWITCHGEAR DEVICES: SHORE POWER MARKET, BY REGION, 2024-2029 (USD MILLION)
- TABLE 66 CABLES & ACCESSORIES: SHORE POWER MARKET, BY REGION, 2020-2023 (USD MILLION)
- TABLE 67 CABLES & ACCESSORIES: SHORE POWER MARKET, BY REGION, 2024-2029 (USD MILLION)
- TABLE 68 OTHER COMPONENTS: SHORE POWER MARKET, BY REGION, 2020-2023 (USD MILLION)
- TABLE 69 OTHER COMPONENTS: SHORE POWER MARKET, BY REGION, 2024-2029 (USD MILLION)
- TABLE 70 SHORE POWER MARKET, BY POWER OUTPUT, 2020-2023 (USD MILLION)
- TABLE 71 SHORE POWER MARKET, BY POWER OUTPUT, 2024-2029 (USD MILLION)
- TABLE 72 BELOW 30 MVA: SHORE POWER MARKET, BY REGION, 2020-2023 (USD MILLION)
- TABLE 73 BELOW 30 MVA: SHORE POWER MARKET, BY REGION, 2024-2029 (USD MILLION)
- TABLE 74 30-60 MVA: SHORE POWER MARKET, BY REGION, 2020-2023 (USD MILLION)
- TABLE 75 30-60 MVA: SHORE POWER MARKET, BY REGION, 2024-2029 (USD MILLION)
- TABLE 76 ABOVE 60 MVA: SHORE POWER MARKET, BY REGION, 2020-2023 (USD MILLION)
- TABLE 77 ABOVE 60 MVA: SHORE POWER MARKET, BY REGION, 2024-2029 (USD MILLION)
- TABLE 78 SHORE POWER MARKET, BY REGION, 2020-2023 (USD MILLION)
- TABLE 79 SHORE POWER MARKET, BY REGION, 2024-2029 (USD MILLION)
- TABLE 80 ASIA PACIFIC: SHORE POWER MARKET, BY INSTALLATION TYPE, 2020-2023 (USD MILLION)
- TABLE 81 ASIA PACIFIC: SHORE POWER MARKET, BY INSTALLATION TYPE, 2024-2029 (USD MILLION)
- TABLE 82 ASIA PACIFIC: SHORE POWER MARKET FOR SHIPSIDE INSTALLATIONS, BY VESSEL, 2020-2023 (USD MILLION)
- TABLE 83 ASIA PACIFIC: SHORE POWER MARKET FOR SHIPSIDE INSTALLATIONS, BY VESSEL, 2024-2029 (USD MILLION)
- TABLE 84 ASIA PACIFIC: SHORE POWER MARKET, BY CONNECTION TYPE, 2020-2023 (USD MILLION)
- TABLE 85 ASIA PACIFIC: SHORE POWER MARKET, BY CONNECTION TYPE, 2024-2029 (USD MILLION)
- TABLE 86 ASIA PACIFIC: SHORE POWER MARKET, BY COMPONENT, 2020-2023 (USD MILLION)
- TABLE 87 ASIA PACIFIC: SHORE POWER MARKET, BY COMPONENT, 2024-2029 (USD MILLION)
- TABLE 88 ASIA PACIFIC: SHORE POWER MARKET, BY POWER OUTPUT, 2020-2023 (USD MILLION)
- TABLE 89 ASIA PACIFIC: SHORE POWER MARKET, BY POWER OUTPUT, 2024-2029 (USD MILLION)
- TABLE 90 ASIA PACIFIC: SHORE POWER MARKET, BY COUNTRY, 2020-2023 (USD MILLION)
- TABLE 91 ASIA PACIFIC: SHORE POWER MARKET, BY COUNTRY, 2024-2029 (USD MILLION)
- TABLE 92 CHINA: SHORE POWER MARKET, BY INSTALLATION TYPE, 2020-2023 (USD MILLION)
- TABLE 93 CHINA: SHORE POWER MARKET, BY INSTALLATION TYPE, 2024-2029 (USD MILLION)
- TABLE 94 CHINA: SHORE POWER MARKET, BY CONNECTION TYPE, 2020-2023 (USD MILLION)
- TABLE 95 CHINA: SHORE POWER MARKET, BY CONNECTION TYPE, 2024-2029 (USD MILLION)
- TABLE 96 CHINA: SHORE POWER MARKET, BY COMPONENT, 2020-2023 (USD MILLION)
- TABLE 97 CHINA: SHORE POWER MARKET, BY COMPONENT, 2024-2029 (USD MILLION)
- TABLE 98 INDIA: SHORE POWER MARKET, BY INSTALLATION TYPE, 2020-2023 (USD MILLION)
- TABLE 99 INDIA: SHORE POWER MARKET, BY INSTALLATION TYPE, 2024-2029 (USD MILLION)
- TABLE 100 INDIA: SHORE POWER MARKET, BY CONNECTION TYPE, 2020-2023 (USD MILLION)
- TABLE 101 INDIA: SHORE POWER MARKET, BY CONNECTION TYPE, 2024-2029 (USD MILLION)
- TABLE 102 INDIA: SHORE POWER MARKET, BY COMPONENT, 2020-2023 (USD MILLION)
- TABLE 103 INDIA: SHORE POWER MARKET, BY COMPONENT, 2024-2029 (USD MILLION)
- TABLE 104 SOUTH KOREA: SHORE POWER MARKET, BY INSTALLATION TYPE, 2020-2023 (USD MILLION)
- TABLE 105 SOUTH KOREA: SHORE POWER MARKET, BY INSTALLATION TYPE, 2024-2029 (USD MILLION)
- TABLE 106 SOUTH KOREA: SHORE POWER MARKET, BY CONNECTION TYPE, 2020-2023 (USD MILLION)
- TABLE 107 SOUTH KOREA: SHORE POWER MARKET, BY CONNECTION TYPE, 2024-2029 (USD MILLION)
- TABLE 108 SOUTH KOREA: SHORE POWER MARKET, BY COMPONENT, 2020-2023 (USD MILLION)
- TABLE 109 SOUTH KOREA: SHORE POWER MARKET, BY COMPONENT, 2024-2029 (USD MILLION)
- TABLE 110 AUSTRALIA: SHORE POWER MARKET, BY INSTALLATION TYPE, 2020-2023 (USD MILLION)
- TABLE 111 AUSTRALIA: SHORE POWER MARKET, BY INSTALLATION TYPE, 2024-2029 (USD MILLION)
- TABLE 112 AUSTRALIA: SHORE POWER MARKET, BY CONNECTION TYPE, 2020-2023 (USD MILLION)
- TABLE 113 AUSTRALIA: SHORE POWER MARKET, BY CONNECTION TYPE, 2024-2029 (USD MILLION)
- TABLE 114 AUSTRALIA: SHORE POWER MARKET, BY COMPONENT, 2020-2023 (USD MILLION)
- TABLE 115 AUSTRALIA: SHORE POWER MARKET, BY COMPONENT, 2024-2029 (USD MILLION)
- TABLE 116 SINGAPORE: SHORE POWER MARKET, BY INSTALLATION TYPE, 2020-2023 (USD MILLION)
- TABLE 117 SINGAPORE: SHORE POWER MARKET, BY INSTALLATION TYPE, 2024-2029 (USD MILLION)
- TABLE 118 SINGAPORE: SHORE POWER MARKET, BY CONNECTION TYPE, 2020-2023 (USD MILLION)
- TABLE 119 SINGAPORE: SHORE POWER MARKET, BY CONNECTION TYPE, 2024-2029 (USD MILLION)
- TABLE 120 SINGAPORE: SHORE POWER MARKET, BY COMPONENT, 2020-2023 (USD MILLION)
- TABLE 121 SINGAPORE: SHORE POWER MARKET, BY COMPONENT, 2024-2029 (USD MILLION)
- TABLE 122 JAPAN: SHORE POWER MARKET, BY INSTALLATION TYPE, 2020-2023 (USD MILLION)
- TABLE 123 JAPAN: SHORE POWER MARKET, BY INSTALLATION TYPE, 2024-2029 (USD MILLION)
- TABLE 124 JAPAN: SHORE POWER MARKET, BY CONNECTION TYPE, 2020-2023 (USD MILLION)
- TABLE 125 JAPAN: SHORE POWER MARKET, BY CONNECTION TYPE, 2024-2029 (USD MILLION)
- TABLE 126 JAPAN: SHORE POWER MARKET, BY COMPONENT, 2020-2023 (USD MILLION)
- TABLE 127 JAPAN: SHORE POWER MARKET, BY COMPONENT, 2024-2029 (USD MILLION)
- TABLE 128 REST OF ASIA PACIFIC: SHORE POWER MARKET, BY INSTALLATION TYPE, 2020-2023 (USD MILLION)
- TABLE 129 REST OF ASIA PACIFIC: SHORE POWER MARKET, BY INSTALLATION TYPE, 2024-2029 (USD MILLION)
- TABLE 130 REST OF ASIA PACIFIC: SHORE POWER MARKET, BY CONNECTION TYPE, 2020-2023 (USD MILLION)
- TABLE 131 REST OF ASIA PACIFIC: SHORE POWER MARKET, BY CONNECTION TYPE, 2024-2029 (USD MILLION)
- TABLE 132 REST OF ASIA PACIFIC: SHORE POWER MARKET, BY COMPONENT, 2020-2023 (USD MILLION)
- TABLE 133 REST OF ASIA PACIFIC: SHORE POWER MARKET, BY COMPONENT, 2024-2029 (USD MILLION)
- TABLE 134 NORTH AMERICA: SHORE POWER MARKET, BY INSTALLATION TYPE, 2020-2023 (USD MILLION)
- TABLE 135 NORTH AMERICA: SHORE POWER MARKET, BY INSTALLATION TYPE, 2024-2029 (USD MILLION)
- TABLE 136 NORTH AMERICA: SHORE POWER MARKET FOR SHIPSIDE INSTALLATIONS, BY VESSEL, 2020-2023 (USD MILLION)
- TABLE 137 NORTH AMERICA: SHORE POWER MARKET FOR SHIPSIDE INSTALLATIONS, BY VESSEL, 2024-2029 (USD MILLION)
- TABLE 138 NORTH AMERICA: SHORE POWER MARKET, BY CONNECTION TYPE, 2020-2023 (USD MILLION)
- TABLE 139 NORTH AMERICA: SHORE POWER MARKET, BY CONNECTION TYPE, 2024-2029 (USD MILLION)
- TABLE 140 NORTH AMERICA: SHORE POWER MARKET, BY COMPONENT, 2020-2023 (USD MILLION)
- TABLE 141 NORTH AMERICA: SHORE POWER MARKET, BY COMPONENT, 2024-2029 (USD MILLION)
- TABLE 142 NORTH AMERICA: SHORE POWER MARKET, BY POWER OUTPUT, 2020-2023 (USD MILLION)
- TABLE 143 NORTH AMERICA: SHORE POWER MARKET, BY POWER OUTPUT, 2024-2029 (USD MILLION)
- TABLE 144 NORTH AMERICA: SHORE POWER MARKET, BY COUNTRY, 2020-2023 (USD MILLION)
- TABLE 145 NORTH AMERICA: SHORE POWER MARKET, BY COUNTRY, 2024-2029 (USD MILLION)
- TABLE 146 US: SHORE POWER MARKET, BY INSTALLATION TYPE, 2020-2023 (USD MILLION)
- TABLE 147 US: SHORE POWER MARKET, BY INSTALLATION TYPE, 2024-2029 (USD MILLION)
- TABLE 148 US: SHORE POWER MARKET, BY CONNECTION TYPE, 2020-2023 (USD MILLION)
- TABLE 149 US: SHORE POWER MARKET, BY CONNECTION TYPE, 2024-2029 (USD MILLION)
- TABLE 150 US: SHORE POWER MARKET, BY COMPONENT, 2020-2023 (USD MILLION)
- TABLE 151 US: SHORE POWER MARKET, BY COMPONENT, 2024-2029 (USD MILLION)
- TABLE 152 CANADA: SHORE POWER MARKET, BY INSTALLATION TYPE, 2020-2023 (USD MILLION)
- TABLE 153 CANADA: SHORE POWER MARKET, BY INSTALLATION TYPE, 2024-2029 (USD MILLION)
- TABLE 154 CANADA: SHORE POWER MARKET, BY CONNECTION TYPE, 2020-2023 (USD MILLION)
- TABLE 155 CANADA: SHORE POWER MARKET, BY CONNECTION TYPE, 2024-2029 (USD MILLION)
- TABLE 156 CANADA: SHORE POWER MARKET, BY COMPONENT, 2020-2023 (USD MILLION)
- TABLE 157 CANADA: SHORE POWER MARKET, BY COMPONENT, 2024-2029 (USD MILLION)
- TABLE 158 MEXICO: SHORE POWER MARKET, BY INSTALLATION TYPE, 2020-2023 (USD MILLION)
- TABLE 159 MEXICO: SHORE POWER MARKET, BY INSTALLATION TYPE, 2024-2029 (USD MILLION)
- TABLE 160 MEXICO: SHORE POWER MARKET, BY CONNECTION TYPE, 2020-2023 (USD MILLION)
- TABLE 161 MEXICO: SHORE POWER MARKET, BY CONNECTION TYPE, 2024-2029 (USD MILLION)
- TABLE 162 MEXICO: SHORE POWER MARKET, BY COMPONENT, 2020-2023 (USD MILLION)
- TABLE 163 MEXICO: SHORE POWER MARKET, BY COMPONENT, 2024-2029 (USD MILLION)
- TABLE 164 EUROPE: SHORE POWER MARKET, BY INSTALLATION TYPE, 2020-2023 (USD MILLION)
- TABLE 165 EUROPE: SHORE POWER MARKET, BY INSTALLATION TYPE, 2024-2029 (USD MILLION)
- TABLE 166 EUROPE: SHORE POWER MARKET FOR SHIPSIDE INSTALLATIONS, BY VESSEL, 2020-2023 (USD MILLION)
- TABLE 167 EUROPE: SHORE POWER MARKET FOR SHIPSIDE INSTALLATIONS, BY VESSEL, 2024-2029 (USD MILLION)
- TABLE 168 EUROPE: SHORE POWER MARKET, BY CONNECTION TYPE, 2020-2023 (USD MILLION)
- TABLE 169 EUROPE: SHORE POWER MARKET, BY CONNECTION TYPE, 2024-2029 (USD MILLION)
- TABLE 170 EUROPE: SHORE POWER MARKET, BY COMPONENT, 2020-2023 (USD MILLION)
- TABLE 171 EUROPE: SHORE POWER MARKET, BY COMPONENT, 2024-2029 (USD MILLION)
- TABLE 172 EUROPE: SHORE POWER MARKET, BY POWER OUTPUT, 2020-2023 (USD MILLION)
- TABLE 173 EUROPE: SHORE POWER MARKET, BY POWER OUTPUT, 2024-2029 (USD MILLION)
- TABLE 174 EUROPE: SHORE POWER MARKET, BY COUNTRY, 2020-2023 (USD MILLION)
- TABLE 175 EUROPE: SHORE POWER MARKET, BY COUNTRY, 2024-2029 (USD MILLION)
- TABLE 176 GERMANY: SHORE POWER MARKET, BY INSTALLATION TYPE, 2020-2023 (USD MILLION)
- TABLE 177 GERMANY: SHORE POWER MARKET, BY INSTALLATION TYPE, 2024-2029 (USD MILLION)
- TABLE 178 GERMANY: SHORE POWER MARKET, BY CONNECTION TYPE, 2020-2023 (USD MILLION)
- TABLE 179 GERMANY: SHORE POWER MARKET, BY CONNECTION TYPE, 2024-2029 (USD MILLION)
- TABLE 180 GERMANY: SHORE POWER MARKET, BY COMPONENT, 2020-2023 (USD MILLION)
- TABLE 181 GERMANY: SHORE POWER MARKET, BY COMPONENT, 2024-2029 (USD MILLION)
- TABLE 182 UK: SHORE POWER MARKET, BY INSTALLATION TYPE, 2020-2023 (USD MILLION)
- TABLE 183 UK: SHORE POWER MARKET, BY INSTALLATION TYPE, 2024-2029 (USD MILLION)
- TABLE 184 UK: SHORE POWER MARKET, BY CONNECTION TYPE, 2020-2023 (USD MILLION)
- TABLE 185 UK: SHORE POWER MARKET, BY CONNECTION TYPE, 2024-2029 (USD MILLION)
- TABLE 186 UK: SHORE POWER MARKET, BY COMPONENT, 2020-2023 (USD MILLION)
- TABLE 187 UK: SHORE POWER MARKET, BY COMPONENT, 2024-2029 (USD MILLION)
- TABLE 188 SWEDEN: SHORE POWER MARKET, BY INSTALLATION TYPE, 2020-2023 (USD MILLION)
- TABLE 189 SWEDEN: SHORE POWER MARKET, BY INSTALLATION TYPE, 2024-2029 (USD MILLION)
- TABLE 190 SWEDEN: SHORE POWER MARKET, BY CONNECTION TYPE, 2020-2023 (USD MILLION)
- TABLE 191 SWEDEN: SHORE POWER MARKET, BY CONNECTION TYPE, 2024-2029 (USD MILLION)
- TABLE 192 SWEDEN: SHORE POWER MARKET, BY COMPONENT, 2020-2023 (USD MILLION)
- TABLE 193 SWEDEN: SHORE POWER MARKET, BY COMPONENT, 2024-2029 (USD MILLION)
- TABLE 194 NETHERLANDS: SHORE POWER MARKET, BY INSTALLATION TYPE, 2020-2023 (USD MILLION)
- TABLE 195 NETHERLANDS: SHORE POWER MARKET, BY INSTALLATION TYPE, 2024-2029 (USD MILLION)
- TABLE 196 NETHERLANDS: SHORE POWER MARKET, BY CONNECTION TYPE, 2020-2023 (USD MILLION)
- TABLE 197 NETHERLANDS: SHORE POWER MARKET, BY CONNECTION TYPE, 2024-2029 (USD MILLION)
- TABLE 198 NETHERLANDS: SHORE POWER MARKET, BY COMPONENT, 2020-2023 (USD MILLION)
- TABLE 199 NETHERLANDS: SHORE POWER MARKET, BY COMPONENT, 2024-2029 (USD MILLION)
- TABLE 200 NORWAY: SHORE POWER MARKET, BY INSTALLATION TYPE, 2020-2023 (USD MILLION)
- TABLE 201 NORWAY: SHORE POWER MARKET, BY INSTALLATION TYPE, 2024-2029 (USD MILLION)
- TABLE 202 NORWAY: SHORE POWER MARKET, BY CONNECTION TYPE, 2020-2023 (USD MILLION)
- TABLE 203 NORWAY: SHORE POWER MARKET, BY CONNECTION TYPE, 2024-2029 (USD MILLION)
- TABLE 204 NORWAY: SHORE POWER MARKET, BY COMPONENT, 2020-2023 (USD MILLION)
- TABLE 205 NORWAY: SHORE POWER MARKET, BY COMPONENT, 2024-2029 (USD MILLION)
- TABLE 206 REST OF EUROPE: SHORE POWER MARKET, BY INSTALLATION TYPE, 2020-2023 (USD MILLION)
- TABLE 207 REST OF EUROPE: SHORE POWER MARKET, BY INSTALLATION TYPE, 2024-2029 (USD MILLION)
- TABLE 208 REST OF EUROPE: SHORE POWER MARKET, BY CONNECTION TYPE, 2020-2023 (USD MILLION)
- TABLE 209 REST OF EUROPE: SHORE POWER MARKET, BY CONNECTION TYPE, 2024-2029 (USD MILLION)
- TABLE 210 REST OF EUROPE: SHORE POWER MARKET, BY COMPONENT, 2020-2023 (USD MILLION)
- TABLE 211 REST OF EUROPE: SHORE POWER MARKET, BY COMPONENT, 2024-2029 (USD MILLION)
- TABLE 212 MIDDLE EAST & AFRICA: SHORE POWER MARKET, BY INSTALLATION TYPE, 2020-2023 (USD MILLION)
- TABLE 213 MIDDLE EAST & AFRICA: SHORE POWER MARKET, BY INSTALLATION TYPE, 2024-2029 (USD MILLION)
- TABLE 214 MIDDLE EAST & AFRICA: SHORE POWER MARKET FOR SHIPSIDE INSTALLATIONS, BY VESSEL, 2020-2023 (USD MILLION)
- TABLE 215 MIDDLE EAST & AFRICA: SHORE POWER MARKET FOR SHIPSIDE INSTALLATIONS, BY VESSEL, 2024-2029 (USD MILLION)
- TABLE 216 MIDDLE EAST & AFRICA: SHORE POWER MARKET, BY CONNECTION TYPE, 2020-2023 (USD MILLION)
- TABLE 217 MIDDLE EAST & AFRICA: SHORE POWER MARKET, BY CONNECTION TYPE, 2024-2029 (USD MILLION)
- TABLE 218 MIDDLE EAST & AFRICA: SHORE POWER MARKET, BY COMPONENT, 2020-2023 (USD MILLION)
- TABLE 219 MIDDLE EAST & AFRICA: SHORE POWER MARKET, BY COMPONENT, 2024-2029 (USD MILLION)
- TABLE 220 MIDDLE EAST & AFRICA: SHORE POWER MARKET, BY POWER OUTPUT, 2020-2023 (USD MILLION)
- TABLE 221 MIDDLE EAST & AFRICA: SHORE POWER MARKET, BY POWER OUTPUT, 2024-2029 (USD MILLION)
- TABLE 222 MIDDLE EAST & AFRICA: SHORE POWER MARKET, BY COUNTRY, 2020-2023 (USD MILLION)
- TABLE 223 MIDDLE EAST & AFRICA: SHORE POWER MARKET, BY COUNTRY, 2024-2029 (USD MILLION)
- TABLE 224 GCC: SHORE POWER MARKET, BY COUNTRY, 2020-2023 (USD MILLION)
- TABLE 225 GCC: SHORE POWER MARKET, BY COUNTRY, 2024-2029 (USD MILLION)
- TABLE 226 SAUDI ARABIA: SHORE POWER MARKET, BY INSTALLATION TYPE, 2020-2023 (USD MILLION)
- TABLE 227 SAUDI ARABIA: SHORE POWER MARKET, BY INSTALLATION TYPE, 2024-2029 (USD MILLION)
- TABLE 228 SAUDI ARABIA: SHORE POWER MARKET, BY CONNECTION TYPE, 2020-2023 (USD MILLION)
- TABLE 229 SAUDI ARABIA: SHORE POWER MARKET, BY CONNECTION TYPE, 2024-2029 (USD MILLION)
- TABLE 230 SAUDI ARABIA: SHORE POWER MARKET, BY COMPONENT, 2020-2023 (USD MILLION)
- TABLE 231 SAUDI ARABIA: SHORE POWER MARKET, BY COMPONENT, 2024-2029 (USD MILLION)
- TABLE 232 UAE: SHORE POWER MARKET, BY INSTALLATION TYPE, 2020-2023 (USD MILLION)
- TABLE 233 UAE: SHORE POWER MARKET, BY INSTALLATION TYPE, 2024-2029 (USD MILLION)
- TABLE 234 UAE: SHORE POWER MARKET, BY CONNECTION TYPE, 2020-2023 (USD MILLION)
- TABLE 235 UAE: SHORE POWER MARKET, BY CONNECTION TYPE, 2024-2029 (USD MILLION)
- TABLE 236 UAE: SHORE POWER MARKET, BY COMPONENT, 2020-2023 (USD MILLION)
- TABLE 237 UAE: SHORE POWER MARKET, BY COMPONENT, 2024-2029 (USD MILLION)
- TABLE 238 REST OF GCC: SHORE POWER MARKET, BY INSTALLATION TYPE, 2020-2023 (USD MILLION)
- TABLE 239 REST OF GCC: SHORE POWER MARKET, BY INSTALLATION TYPE, 2024-2029 (USD MILLION)
- TABLE 240 REST OF GCC: SHORE POWER MARKET, BY CONNECTION TYPE, 2020-2023 (USD MILLION)
- TABLE 241 REST OF GCC: SHORE POWER MARKET, BY CONNECTION TYPE, 2024-2029 (USD MILLION)
- TABLE 242 REST OF GCC: SHORE POWER MARKET, BY COMPONENT, 2020-2023 (USD MILLION)
- TABLE 243 REST OF GCC: SHORE POWER MARKET, BY COMPONENT, 2024-2029 (USD MILLION)
- TABLE 244 EGYPT: SHORE POWER MARKET, BY INSTALLATION TYPE, 2020-2023 (USD MILLION)
- TABLE 245 EGYPT: SHORE POWER MARKET, BY INSTALLATION TYPE, 2024-2029 (USD MILLION)
- TABLE 246 EGYPT: SHORE POWER MARKET, BY CONNECTION TYPE, 2020-2023 (USD MILLION)
- TABLE 247 EGYPT: SHORE POWER MARKET, BY CONNECTION TYPE, 2024-2029 (USD MILLION)
- TABLE 248 EGYPT: SHORE POWER MARKET, BY COMPONENT, 2020-2023 (USD MILLION)
- TABLE 249 EGYPT: SHORE POWER MARKET, BY COMPONENT, 2024-2029 (USD MILLION)
- TABLE 250 SOUTH AFRICA: SHORE POWER MARKET, BY INSTALLATION TYPE, 2020-2023 (USD MILLION)
- TABLE 251 SOUTH AFRICA: SHORE POWER MARKET, BY INSTALLATION TYPE, 2024-2029 (USD MILLION)
- TABLE 252 SOUTH AFRICA: SHORE POWER MARKET, BY CONNECTION TYPE, 2020-2023 (USD MILLION)
- TABLE 253 SOUTH AFRICA: SHORE POWER MARKET, BY CONNECTION TYPE, 2024-2029 (USD MILLION)
- TABLE 254 SOUTH AFRICA: SHORE POWER MARKET, BY COMPONENT, 2020-2023 (USD MILLION)
- TABLE 255 SOUTH AFRICA: SHORE POWER MARKET, BY COMPONENT, 2024-2029 (USD MILLION)
- TABLE 256 REST OF MIDDLE EAST & AFRICA: SHORE POWER MARKET, BY INSTALLATION TYPE, 2020-2023 (USD MILLION)
- TABLE 257 REST OF MIDDLE EAST & AFRICA: SHORE POWER MARKET, BY INSTALLATION TYPE, 2024-2029 (USD MILLION)
- TABLE 258 REST OF MIDDLE EAST & AFRICA: SHORE POWER MARKET, BY CONNECTION TYPE, 2020-2023 (USD MILLION)
- TABLE 259 REST OF MIDDLE EAST & AFRICA: SHORE POWER MARKET, BY CONNECTION TYPE, 2024-2029 (USD MILLION)
- TABLE 260 REST OF MIDDLE EAST & AFRICA: SHORE POWER MARKET, BY COMPONENT, 2020-2023 (USD MILLION)
- TABLE 261 REST OF MIDDLE EAST & AFRICA: SHORE POWER MARKET, BY COMPONENT, 2024-2029 (USD MILLION)
- TABLE 262 SOUTH AMERICA: SHORE POWER MARKET, BY INSTALLATION TYPE, 2020-2023 (USD MILLION)
- TABLE 263 SOUTH AMERICA: SHORE POWER MARKET, BY INSTALLATION TYPE, 2024-2029 (USD MILLION)
- TABLE 264 SOUTH AMERICA: SHORE POWER MARKET FOR SHIPSIDE INSTALLATIONS, BY VESSEL, 2020-2023 (USD MILLION)
- TABLE 265 SOUTH AMERICA: SHORE POWER MARKET FOR SHIPSIDE INSTALLATIONS, BY VESSEL, 2024-2029 (USD MILLION)
- TABLE 266 SOUTH AMERICA: SHORE POWER MARKET, BY CONNECTION TYPE, 2020-2023 (USD MILLION)
- TABLE 267 SOUTH AMERICA: SHORE POWER MARKET, BY CONNECTION TYPE, 2024-2029 (USD MILLION)
- TABLE 268 SOUTH AMERICA: SHORE POWER MARKET, BY COMPONENT, 2020-2023 (USD MILLION)
- TABLE 269 SOUTH AMERICA: SHORE POWER MARKET, BY COMPONENT, 2024-2029 (USD MILLION)
- TABLE 270 SOUTH AMERICA: SHORE POWER MARKET, BY POWER OUTPUT, 2020-2023 (USD MILLION)
- TABLE 271 SOUTH AMERICA: SHORE POWER MARKET, BY POWER OUTPUT, 2024-2029 (USD MILLION)
- TABLE 272 SOUTH AMERICA: SHORE POWER MARKET, BY COUNTRY, 2020-2023 (USD MILLION)
- TABLE 273 SOUTH AMERICA: SHORE POWER MARKET, BY COUNTRY, 2024-2029 (USD MILLION)
- TABLE 274 BRAZIL: SHORE POWER MARKET, BY INSTALLATION TYPE, 2020-2023 (USD MILLION)
- TABLE 275 BRAZIL: SHORE POWER MARKET, BY INSTALLATION TYPE, 2024-2029 (USD MILLION)
- TABLE 276 BRAZIL: SHORE POWER MARKET, BY CONNECTION TYPE, 2020-2023 (USD MILLION)
- TABLE 277 BRAZIL: SHORE POWER MARKET, BY CONNECTION TYPE, 2024-2029 (USD MILLION)
- TABLE 278 BRAZIL: SHORE POWER MARKET, BY COMPONENT, 2020-2023 (USD MILLION)
- TABLE 279 BRAZIL: SHORE POWER MARKET, BY COMPONENT, 2024-2029 (USD MILLION)
- TABLE 280 ARGENTINA: SHORE POWER MARKET, BY INSTALLATION TYPE, 2020-2023 (USD MILLION)
- TABLE 281 ARGENTINA: SHORE POWER MARKET, BY INSTALLATION TYPE, 2024-2029 (USD MILLION)
- TABLE 282 ARGENTINA: SHORE POWER MARKET, BY CONNECTION TYPE, 2020-2023 (USD MILLION)
- TABLE 283 ARGENTINA: SHORE POWER MARKET, BY CONNECTION TYPE, 2024-2029 (USD MILLION)
- TABLE 284 ARGENTINA: SHORE POWER MARKET, BY COMPONENT, 2020-2023 (USD MILLION)
- TABLE 285 ARGENTINA: SHORE POWER MARKET, BY COMPONENT, 2024-2029 (USD MILLION)
- TABLE 286 REST OF SOUTH AMERICA: SHORE POWER MARKET, BY INSTALLATION TYPE, 2020-2023 (USD MILLION)
- TABLE 287 REST OF SOUTH AMERICA: SHORE POWER MARKET, BY INSTALLATION TYPE, 2024-2029 (USD MILLION)
- TABLE 288 REST OF SOUTH AMERICA: SHORE POWER MARKET, BY CONNECTION TYPE, 2020-2023 (USD MILLION)
- TABLE 289 REST OF SOUTH AMERICA: SHORE POWER MARKET, BY CONNECTION TYPE, 2024-2029 (USD MILLION)
- TABLE 290 REST OF SOUTH AMERICA: SHORE POWER MARKET, BY COMPONENT, 2020-2023 (USD MILLION)
- TABLE 291 REST OF SOUTH AMERICA: SHORE POWER MARKET, BY COMPONENT, 2024-2029 (USD MILLION)
- TABLE 292 SHORE POWER MARKET: OVERVIEW OF STRATEGIES ADOPTED BY KEY PLAYERS, 2021-2024
- TABLE 293 SHORE POWER MARKET: DEGREE OF COMPETITION, 2023
- TABLE 294 SHORE POWER MARKET: REGION FOOTPRINT
- TABLE 295 SHORE POWER MARKET: INSTALLATION TYPE FOOTPRINT
- TABLE 296 SHORE POWER MARKET: POWER OUTPUT FOOTPRINT
- TABLE 297 SHORE POWER MARKET: CONNECTION TYPE FOOTPRINT
- TABLE 298 SHORE POWER MARKET: LIST OF KEY STARTUPS/SMES
- TABLE 299 SHORE POWER MARKET: COMPETITIVE BENCHMARKING OF KEY STARTUPS/SMES
- TABLE 300 SHORE POWER MARKET: PRODUCT LAUNCHES/DEVELOPMENTS, MARCH 2021-AUGUST 2024
- TABLE 301 SHORE POWER MARKET: DEALS, MARCH 2021-AUGUST 2024
- TABLE 302 SHORE POWER MARKET: EXPANSIONS, MARCH 2021-AUGUST 2024
- TABLE 303 SHORE POWER MARKET: OTHER DEVELOPMENTS, MARCH 2021-AUGUST 2024
- TABLE 304 GENERAL ELECTRIC COMPANY: COMPANY OVERVIEW
- TABLE 305 GENERAL ELECTRIC COMPANY: PRODUCTS OFFERED
- TABLE 306 GENERAL ELECTRIC COMPANY: DEALS
- TABLE 307 SIEMENS: COMPANY OVERVIEW
- TABLE 308 SIEMENS: PRODUCTS OFFERED
- TABLE 309 SIEMENS: PRODUCT LAUNCHES/DEVELOPMENTS
- TABLE 310 SIEMENS: DEALS
- TABLE 311 SIEMENS: OTHER DEVELOPMENTS
- TABLE 312 SIEMENS: EXPANSIONS
- TABLE 313 SCHNEIDER ELECTRIC: COMPANY OVERVIEW
- TABLE 314 SCHNEIDER ELECTRIC: PRODUCTS OFFERED
- TABLE 315 SCHNEIDER ELECTRIC: DEALS
- TABLE 316 SCHNEIDER ELECTRIC: EXPANSIONS
- TABLE 317 ABB: COMPANY OVERVIEW
- TABLE 318 ABB: PRODUCTS OFFERED
- TABLE 319 ABB: PRODUCT LAUNCHES
- TABLE 320 ABB: DEALS
- TABLE 321 ABB: OTHER DEVELOPMENTS
- TABLE 322 CAVOTEC SA: COMPANY OVERVIEW
- TABLE 323 CAVOTEC SA: PRODUCTS OFFERED
- TABLE 324 CAVOTEC SA: DEALS
- TABLE 325 CAVOTEC SA: OTHER DEVELOPMENTS
- TABLE 326 EATON: COMPANY OVERVIEW
- TABLE 327 EATON: PRODUCTS OFFERED
- TABLE 328 EATON: DEALS
- TABLE 329 EATON: OTHER DEVELOPMENTS
- TABLE 330 VINCI ENERGIES: COMPANY OVERVIEW
- TABLE 331 VINCI ENERGIES: PRODUCTS OFFERED
- TABLE 332 VINCI ENERGIES: DEALS
- TABLE 333 WARTSILA: COMPANY OVERVIEW
- TABLE 334 WARTSILA: PRODUCTS OFFERED
- TABLE 335 WARTSILA: DEALS
- TABLE 336 HITACHI ENERGY LTD.: COMPANY OVERVIEW
- TABLE 337 HITACHI ENERGY LTD.: PRODUCTS OFFERED
- TABLE 338 HITACHI ENERGY LTD.: DEVELOPMENTS
- TABLE 339 DANFOSS: COMPANY OVERVIEW
- TABLE 340 DANFOSS: PRODUCTS OFFERED
- TABLE 341 DANFOSS: DEALS
- TABLE 342 WABTEC CORPORATION: COMPANY OVERVIEW
- TABLE 343 WABTEC CORPORATION: PRODUCTS OFFERED
- TABLE 344 WABTEC CORPORATION: DEALS
- TABLE 345 POWERCON A/S: COMPANY OVERVIEW
- TABLE 346 POWERCON A/S: PRODUCTS OFFERED
- TABLE 347 POWERCON A/S: DEALS
- TABLE 348 ESL POWER SYSTEMS, INC.: COMPANY OVERVIEW
- TABLE 349 ESL POWER SYSTEMS, INC.: PRODUCTS OFFERED
- TABLE 350 IGUS: COMPANY OVERVIEW
- TABLE 351 IGUS: PRODUCTS OFFERED
- TABLE 352 BLUE DAY TECHNOLOGY: COMPANY OVERVIEW
- TABLE 353 BLUE DAY TECHNOLOGY: PRODUCTS OFFERED
- TABLE 354 BLUE DAY TECHNOLOGY: DEALS
- TABLE 355 BLUE DAY TECHNOLOGY: OTHER DEVELOPMENTS
- TABLE 356 WATTS MARINE: COMPANY OVERVIEW
- TABLE 357 WATTS MARINE: PRODUCTS OFFERED
- TABLE 358 WATTS MARINE: DEALS
- TABLE 359 AC POWER CORP.: COMPANY OVERVIEW
- TABLE 360 AC POWER CORP.: PRODUCTS OFFERED
- TABLE 361 SMARTPLUG: BUSINESS OVERVIEW
- TABLE 362 SMARTPLUG: PRODUCTS OFFERED
- TABLE 363 PILLER POWER SYSTEMS: COMPANY OVERVIEW
- TABLE 364 PILLER POWER SYSTEMS: PRODUCTS OFFERED
- TABLE 365 POWER SYSTEMS INTERNATIONAL: COMPANY OVERVIEW
- TABLE 366 POWER SYSTEMS INTERNATIONAL: PRODUCTS OFFERED
List of Figures
- FIGURE 1 SHORE POWER MARKET: RESEARCH DESIGN
- FIGURE 2 KEY METRICS CONSIDERED TO ANALYZE DEMAND FOR SHORE POWER SYSTEMS
- FIGURE 3 SHORE POWER MARKET: BOTTOM-UP APPROACH
- FIGURE 4 SHORE POWER MARKET: TOP-DOWN APPROACH
- FIGURE 5 KEY STEPS CONSIDERED TO ASSESS SUPPLY OF SHORE POWER SYSTEMS
- FIGURE 6 SHORE POWER MARKET SIZE ESTIMATION METHODOLOGY (SUPPLY SIDE)
- FIGURE 7 SHORE POWER MARKET: DATA TRIANGULATION
- FIGURE 8 SHORESIDE SEGMENT TO HOLD MORE SIGNIFICANT SHARE OF SHORE POWER MARKET, BY INSTALLATION TYPE, DURING FORECAST PERIOD
- FIGURE 9 RETROFITS SEGMENT TO LEAD SHORE POWER MARKET, BY CONNECTION TYPE, THROUGHOUT FORECAST PERIOD
- FIGURE 10 FREQUENCY CONVERTERS SEGMENT TO LEAD SHORE POWER MARKET, BY COMPONENT, DURING FORECAST PERIOD
- FIGURE 11 BELOW 30 MVA SEGMENT TO DOMINATE SHORE POWER MARKET, BY POWER OUTPUT, THROUGHOUT FORECAST PERIOD
- FIGURE 12 ASIA PACIFIC DOMINATED GLOBAL SHORE POWER MARKET IN 2023
- FIGURE 13 INCREASING FOCUS OF MARITIME SECTOR ON SUSTAINABILITY AND DECARBONIZATION TO DRIVE MARKET
- FIGURE 14 ASIA PACIFIC TO WITNESS HIGHEST CAGR IN GLOBAL SHORE POWER MARKET DURING FORECAST PERIOD
- FIGURE 15 CHINA HELD LARGEST SHARE OF ASIA PACIFIC MARKET IN 2023
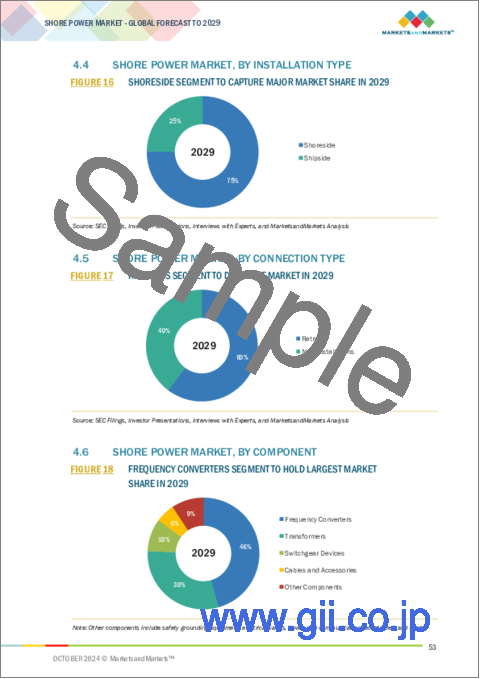
- FIGURE 16 SHORESIDE SEGMENT TO CAPTURE MAJOR MARKET SHARE IN 2029
- FIGURE 17 RETROFITS SEGMENT TO DOMINATE MARKET IN 2029
- FIGURE 18 FREQUENCY CONVERTERS SEGMENT TO HOLD LARGEST MARKET SHARE IN 2029
- FIGURE 19 BELOW 30 MVA SEGMENT TO ACCOUNT FOR LARGEST MARKET SHARE IN 2029
- FIGURE 20 SHORE POWER MARKET: DRIVERS, RESTRAINTS, OPPORTUNITIES, AND CHALLENGES
- FIGURE 21 CARBON DIOXIDE EMISSION, BY VESSEL, 2012-2023
- FIGURE 22 GLOBAL INVESTMENT IN POWER SECTOR, 2019-2023
- FIGURE 23 GLOBAL INVESTMENT IN INFRASTRUCTURE DEVELOPMENT, 2019-2029
- FIGURE 24 GLOBAL CRUISE CAPACITY EXPANSION, 2016-2028
- FIGURE 25 ELECTRICITY CAPACITY EXPANSION, BY RENEWABLE SOURCE, 2019-2028
- FIGURE 26 CLEAN ENERGY SPENDING IN SELECTED REGIONS, 2023
- FIGURE 27 SHORE POWER MARKET: TRENDS/DISRUPTIONS INFLUENCING CUSTOMER BUSINESS
- FIGURE 28 SHORE POWER MARKET: ECOSYSTEM ANALYSIS
- FIGURE 29 FUNDING RAISED BY TOP PLAYERS IN SHORE POWER MARKET
- FIGURE 30 SHORE POWER MARKET: SUPPLY CHAIN ANALYSIS
- FIGURE 31 IMPORT DATA FOR HS CODE 8504-COMPLIANT PRODUCTS FOR TOP 5 COUNTRIES, 2019-2023
- FIGURE 32 EXPORT DATA FOR HS CODE 8504-COMPLIANT PRODUCTS FOR TOP 5 COUNTRIES, 2019-2023
- FIGURE 33 SHORE POWER MARKET: INNOVATIONS AND PATENT REGISTRATIONS, 2014-2023
- FIGURE 34 PORTER'S FIVE FORCES ANALYSIS FOR SHORE POWER MARKET
- FIGURE 35 INFLUENCE OF KEY STAKEHOLDERS ON BUYING PROCESS FOR TOP 3 COMPONENTS
- FIGURE 36 INFLUENCE OF KEY STAKEHOLDERS ON BUYING PROCESS FOR TOP 3 COMPONENTS
- FIGURE 37 IMPACT OF AI ON SHORE POWER SUPPLY CHAIN
- FIGURE 38 SHORESIDE SEGMENT CAPTURED LARGER SHARE OF SHORE POWER MARKET, BY INSTALLATION TYPE, IN 2023
- FIGURE 39 RETROFITS SEGMENT HELD MAJORITY OF MARKET SHARE, BY CONNECTION TYPE, IN 2023
- FIGURE 40 FREQUENCY CONVERTERS ACCOUNTED FOR LARGEST SHARE OF SHORE POWER MARKET, BY COMPONENT, IN 2023
- FIGURE 41 BELOW 30 MVA SEGMENT HELD LARGEST SHARE OF SHORE POWER MARKET, BY POWER OUTPUT, IN 2023
- FIGURE 42 ASIA PACIFIC TO REGISTER HIGHEST CAGR IN SHORE POWER MARKET FROM 2024 TO 2029
- FIGURE 43 ASIA PACIFIC LED SHORE POWER MARKET IN 2023
- FIGURE 44 SNAPSHOT OF SHORE POWER MARKET IN ASIA PACIFIC
- FIGURE 45 SNAPSHOT OF SHORE POWER MARKET IN NORTH AMERICA
- FIGURE 46 SHORE POWER MARKET: REVENUE ANALYSIS OF TOP 5 PLAYERS, 2019-2023
- FIGURE 47 SHARE ANALYSIS OF PLAYERS IN SHORE POWER MARKET, 2023
- FIGURE 48 COMPANY VALUATION
- FIGURE 49 FINANCIAL METRICS
- FIGURE 50 PRODUCT TYPE-/GEOGRAPHIC PRESENCE-WISE COMPARISON
- FIGURE 51 SHORE POWER MARKET: COMPANY EVALUATION MATRIX (KEY PLAYERS), 2023
- FIGURE 52 SHORE POWER MARKET: COMPANY FOOTPRINT
- FIGURE 53 SHORE POWER MARKET: COMPANY EVALUATION MATRIX (STARTUPS/SMES), 2023
- FIGURE 54 GENERAL ELECTRIC COMPANY: COMPANY SNAPSHOT
- FIGURE 55 SIEMENS: COMPANY SNAPSHOT
- FIGURE 56 SCHNEIDER ELECTRIC: COMPANY SNAPSHOT
- FIGURE 57 ABB: COMPANY SNAPSHOT
- FIGURE 58 CAVOTEC SA: COMPANY SNAPSHOT
- FIGURE 59 EATON: COMPANY SNAPSHOT
- FIGURE 60 VINCI ENERGIES: COMPANY SNAPSHOT
- FIGURE 61 WARTSILA: COMPANY SNAPSHOT
- FIGURE 62 HITACHI ENERGY LTD.: COMPANY SNAPSHOT
- FIGURE 63 DANFOSS: COMPANY SNAPSHOT
- FIGURE 64 WABTEC CORPORATION: COMPANY SNAPSHOT
The global shore power market is expected to grow significantly from an estimated USD 2.03 billion in 2024 to USD 3.58 billion by 2029, at a CAGR of 12.0% during the forecast period. There are multiple factors that propel the growth of the global shore power market. Since there is increasing environmental awareness and regulations that are limiting the emissions from shipping activities, there is a need for ports and shipping firms to embrace greener options such as shore power. Another significant factor is the increased emphasis on decarbonization and clean energy technologies especially given that this system helps in sourcing shore power making it possible to easily reduce greenhouse gas emissions and attain global sustainability targets. Furthermore, factors such as upgraded shore power systems and energy efficient equipment are making it feasible and cost-effective to adopt these systems. In addition, government policies and incentives help to promote the worldwide development of the shore power network.
| Scope of the Report | |
|---|---|
| Years Considered for the Study | 2020-2029 |
| Base Year | 2023 |
| Forecast Period | 2024-2029 |
| Units Considered | Value (USD Million/Billion) |
| Segments | by installation, connection, component, power output, and region |
| Regions covered | North America, Europe, Asia Pacific, Middle East & Africa and South America |
"Above 60 MVA segment, by power output, is expected to hold third largest market share during forecast period"
The global shore power market segment "Above 60 MVA" ranks the third position in terms of market share. The primary reason for this is the growing need of high capacity power solutions used in bigger vessels like the container ships and oil tankers. These types of vessels consume a great deal of electrical energy as a lot of their systems are run on board, hence high capacity deployable shore power connection is necessary for effective and clean operations. Furthermore, ports are developing better facilities to take care of the bigger operations, which include the significant reduction of emissions while the vessels are docked. This segment is also driven by the increasing implementation of regulations that require the use of shore power for large vessels to avoid emissions. Therefore, due to these reasons, there is an increasing requirement for shore power systems with more than 60 MVA system capability which in turn entrenches its position in the market.
"New installation segment, by installation type, is expected to capture second largest market share during forecast period"
The "New Installation" sub-segment within the scope of By Installation market in shore power market worldwide has second largest market share due to rising trends in the construction of new port facilities with shore power systems. Ports and shipping companies are more concerned about sustainability and reduction of carbon emissions; hence calls for new projects incorporating shore power facilities on new ports and new vessels are on the rise. High levels of investments for reconstruction of old facilities indicate the willingness to embrace cleaner and greener technologies that are in line with the government's infrastructural goals and are also efficient. Moreover, the integration of the advanced technologies in the shore power solutions accelerates the market for new installations, resulting into an important market strategy as more advanced and energy consuming ships are introduced in the ports.
"Europe is expected to be the third largest during forecast period."
Owing to the robust legal structure and the several sustainability plans in place, Europe comes in as the third largest market in the Global Shore Power Market. The environmental standards put forth by the European Union, among them, the European Green Deal and that of the Marine Environment Protection Committee, have accelerated the use of shore power technologies within ports and shipping lines considerably. In addition, Europe has ports such as Rotterdam and Hamburg which are some of the largest in the world, and which have incorporated shore power facilities to help curb the emission of pollutants into the port. In addition, the continuous influx of advanced technology and system modernization helps the region maintain its competitive edge in the shore power sector Further. The interlink between the policies, issues of climate change and the emergence of new technologies are some of the reasons why this region has a significant market in this sector that is still shaping up.
In-depth interviews have been conducted with chief executive officers (CEOs), Directors, and other executives from various key organizations operating in the biorefinery market.
By Company Type: Tier 1- 30%, Tier 2- 55%, and Tier 3- 15%
By Designation: C-level Executives - 30%, Director Level- 20%, and Others- 50%
By Region: North America - 18%, Europe - 8%, Asia Pacific - 60%, South America - 4%, Middle East & Africa - 10%
Note: Other designations include sales managers, marketing managers, product managers, and product engineers.
The tier of the companies is defined based on their total revenue as of 2023. Tier 1: USD 1 billion and above, Tier 2: From USD 500 million to USD 1 billion, and Tier 3: <USD 500 million.
The global shore power market is dominated by key players that hold a wide regional presence and offer a diverse range of products. Leading companies in the shore power market include ABB (Switzerland), Schneider Electric (France), General Electric Company (US), Eaton (Ireland), Siemens (Germany), and Cavotec SA (Switzerland), among others. These players focus on strategies such as product innovations, acquisitions, contracts, and expansions to strengthen their market position. New product launches, coupled with strategic investments in power infrastructure and energy-efficient technologies, are key approaches adopted by these companies to maintain competitive advantages in the evolving market landscape.
Research Coverage:
The report defines, describes, and forecasts the shore power market by installation type, component, connection, power output, and region. It also offers a detailed qualitative and quantitative analysis of the market. The report comprehensively reviews the major market drivers, restraints, opportunities, and challenges. It also covers various important aspects of the market. A detailed analysis of the key industry players has been done to provide insights into their business overview, solutions, and services; key strategies; Contracts, partnerships, agreements. new product launches, mergers and acquisitions, and recent developments associated with the biorefinery market. Competitive analysis of upcoming startups in the shore power market ecosystem is covered in this report.
Reasons to buy this report:
The report will help the market leaders/new entrants busbar market and the subsegments. This report will help stakeholders understand the competitive landscape and gain more insights to position their businesses better and to plan suitable go-to-market strategies. The report also helps stakeholders understand the pulse of the market and provides them with information on key market drivers, restraints, challenges, and opportunities.
The report provides insights on the following pointers:
- Analysis of key drivers (Rising focus on sustainability and decarbonization, Increasing maritime traffic and port expansion, Expansion of cruise ship industry), restraints (High initial investment costs, Lack of standardization across ports) opportunities (Advances in shore power technology, Growth in renewable energy integration), and challenges (Limited grid capacity and renewable energy availability, Slow adoption and low penetration rates, Operational and technical challenges) influencing the growth.
- Product Development/ Innovation: To develop products and innovate, is the key motivator for the growth of global shore power markets as entities seek to expand their offerings and fulfill the rising regulatory requirements for eco-friendly policies. The designers and engineers of shore power systems are now more focused on coming up with flexible and efficient power systems that will make it easier for sea ports to service all kinds of ships and fit into the existing port architecture. Technological progress, which includes the invention of powerful frequency transformers and smart grid technologies, is making energy management more efficient and cutting down on the use of oil products. In order to further cut emissions and facilitate the shift from high-carbon energy systems to low-carbon ones, companies are actively researching auxiliary energy components, such as hydrogen and battery storage systems. This is an interesting development as technology not only increases the production of goods but also enhances the market position of producers in relation to the existing challenges, the need for which has been growing in the maritime sector, thanks to the calls for reduction in carbon emissions.
- Market Development: The worldwide shore power market is on the rise, primarily due to heightened environmental awareness and the increasing number of regulations focused on minimizing greenhouse gases emissions from shipping activities. With the increasing number of ports that are implementing shore power solutions, which helps vessels connect to the electricity source at the dock rather than rely on onboard generators, there is likely to be more advancements in technologies and facilities incorporated into the system. Notably, players such as the likes of Siemens, ABB amongst others are taking the lead in coming of age technologies to shore power applications. As noted by several market research studies, the trend is expected to have a vigorous growth of the specific market and its constituent components over the forecast period, owing to focus on green shipping tendencies and fuel switching. This expansion creates avenues for investors to enhance existing clean technologies that are in demand as a result of rising shore power needs in ports around the world .
- Market Diversification: To meet the increasing market demand, companies are developing hybrid shore power systems incorporating already existing shore energy solutions to renewable energies ex. solar, wind power, etc. which is more environmentally friendly than fossil fuels. Facilitations of the global shore power market are also extending their geographical boundaries by making investments in Asia Pacific and Middle East regions which are in developing stages and improving their port infrastructures. Such strategic expansion makes it possible for the enterprises to avoid risks, find new profitable sources and comply with the worldwide environmental standards. These factors are driving the growth in the global shore power market.
- Competitive Assessment: In-depth analysis of market share, growth plans, and service offerings of top companies in the global shore power market, including ABB (Switzerland), Schneider Electric (France), General Electric Company (US), Cavotec SA (Switzerland), VINCI Energies (France), Eaton (Ireland), Siemens (Germany), and Wartsila (Finland) among others.
TABLE OF CONTENTS
1 INTRODUCTION
- 1.1 STUDY OBJECTIVES
- 1.2 MARKET DEFINITION
- 1.3 STUDY SCOPE
- 1.3.1 INCLUSIONS AND EXCLUSIONS
- 1.3.2 MARKETS COVERED AND REGIONAL SCOPE
- 1.3.3 YEARS CONSIDERED
- 1.4 CURRENCY CONSIDERED
- 1.5 LIMITATIONS
- 1.6 STAKEHOLDERS
- 1.7 SUMMARY OF CHANGES
2 RESEARCH METHODOLOGY
- 2.1 RESEARCH DATA
- 2.1.1 SECONDARY DATA
- 2.1.1.1 List of key secondary sources
- 2.1.1.2 Key data from secondary sources
- 2.1.2 PRIMARY DATA
- 2.1.2.1 List of primary interview participants
- 2.1.2.2 Key industry insights
- 2.1.2.3 Key data from primary sources
- 2.1.2.4 Breakdown of primaries
- 2.1.1 SECONDARY DATA
- 2.2 MARKET SIZE ESTIMATION METHODOLOGY
- 2.2.1 BOTTOM-UP APPROACH
- 2.2.1.1 Regional analysis
- 2.2.1.2 Country-level analysis
- 2.2.1.3 Demand-side assumptions
- 2.2.1.4 Demand-side calculations
- 2.2.2 TOP-DOWN APPROACH
- 2.2.2.1 Supply-side assumptions
- 2.2.2.2 Supply-side calculations
- 2.2.1 BOTTOM-UP APPROACH
- 2.3 MARKET BREAKDOWN AND DATA TRIANGULATION
- 2.4 FORECAST
- 2.5 RESEARCH ASSUMPTIONS
- 2.6 RISK ANALYSIS
- 2.7 RESEARCH LIMITATIONS
3 EXECUTIVE SUMMARY
4 PREMIUM INSIGHTS
- 4.1 ATTRACTIVE OPPORTUNITIES FOR PLAYERS IN SHORE POWER MARKET
- 4.2 SHORE POWER MARKET, BY REGION
- 4.3 SHORE POWER MARKET IN ASIA PACIFIC, BY INSTALLATION TYPE AND COUNTRY
- 4.4 SHORE POWER MARKET, BY INSTALLATION TYPE
- 4.5 SHORE POWER MARKET, BY CONNECTION TYPE
- 4.6 SHORE POWER MARKET, BY COMPONENT
- 4.7 SHORE POWER MARKET, BY POWER OUTPUT
5 MARKET OVERVIEW
- 5.1 INTRODUCTION
- 5.2 MARKET DYNAMICS
- 5.2.1 DRIVERS
- 5.2.1.1 Rising focus of government authorities on sustainability, carbon neutrality, and decarbonization initiatives
- 5.2.1.2 Increasing maritime traffic and expanding port networks
- 5.2.1.3 Thriving cruise ship industry
- 5.2.2 RESTRAINTS
- 5.2.2.1 High initial investment costs
- 5.2.2.2 Lack of uniform technical and regulatory frameworks across ports
- 5.2.3 OPPORTUNITIES
- 5.2.3.1 Advances in shore power technology
- 5.2.3.2 Integration of renewable energy into shore power systems
- 5.2.4 CHALLENGES
- 5.2.4.1 Limited grid capacity and renewable energy source availability
- 5.2.4.2 Operational and technical challenges of shore power systems
- 5.2.1 DRIVERS
- 5.3 TRENDS/DISRUPTIONS IMPACTING CUSTOMER BUSINESS
- 5.4 ECOSYSTEM ANALYSIS
- 5.5 PRICING ANALYSIS
- 5.5.1 INDICATIVE PRICING OF SHORE POWER SYSTEM COMPONENTS, 2023
- 5.5.2 INDICATIVE PRICING OF SHOWER POWER SYSTEMS, BY VESSEL, 2023
- 5.6 INVESTMENT AND FUNDING SCENARIO
- 5.7 SUPPLY CHAIN ANALYSIS
- 5.8 TECHNOLOGY ANALYSIS
- 5.8.1 KEY TECHNOLOGIES
- 5.8.1.1 High-voltage shore connection (HVSC) systems
- 5.8.2 ADJACENT TECHNOLOGIES
- 5.8.2.1 Smart grid technologies
- 5.8.2.2 Modular shore power solutions
- 5.8.1 KEY TECHNOLOGIES
- 5.9 KEY CONFERENCES AND EVENTS, 2024-2025
- 5.10 TRADE ANALYSIS
- 5.10.1 IMPORT SCENARIO (HS CODE 8504)
- 5.10.2 EXPORT SCENARIO (HS CODE 8504)
- 5.11 TARIFF AND REGULATORY LANDSCAPE
- 5.11.1 TARIFF ANALYSIS (HS CODE 8504)
- 5.11.2 REGULATORY BODIES, GOVERNMENT AGENCIES, AND OTHER ORGANIZATIONS
- 5.11.3 CODES AND REGULATIONS RELATED TO GLOBAL SHORE POWER MARKET
- 5.12 PATENT ANALYSIS
- 5.13 PORTER'S FIVE FORCES ANALYSIS
- 5.13.1 THREAT OF NEW ENTRANTS
- 5.13.2 THREAT OF SUBSTITUTES
- 5.13.3 BARGAINING POWER OF SUPPLIERS
- 5.13.4 BARGAINING POWER OF BUYERS
- 5.13.5 INTENSITY OF COMPETITIVE RIVALRY
- 5.14 KEY STAKEHOLDERS AND BUYING CRITERIA
- 5.14.1 KEY STAKEHOLDERS IN BUYING PROCESS
- 5.14.2 BUYING CRITERIA
- 5.15 CASE STUDY ANALYSIS
- 5.15.1 WASALINE IMPROVES ENERGY EFFICIENCY OF HYBRID ELECTRIC FERRY WITH DANFOSS DRIVES' VACON 100 DRIVES
- 5.15.2 SEAM AND DANFOSS DRIVES ASSIST NESODD FERRIES IN DELIVERING ZERO-EMISSION SERVICES TO COMMUTERS
- 5.15.3 DANFOSS DRIVES RETROFITS SKULEBAS TRAINING VESSEL FOR GREENER AND MORE EFFICIENT FISHING PRACTICES
- 5.16 IMPACT OF GENERATIVE AI/AI ON SHORE POWER MARKET
- 5.17 MACROECONOMIC OUTLOOK FOR SHORE POWER MARKET
- 5.17.1 IMPACT OF GDP ON SHORE POWER MARKET
- 5.17.2 RESEARCH AND DEVELOPMENT EXPENDITURE
- 5.17.3 INVESTMENTS IN SHORE POWER SYSTEMS
- 5.17.4 TRANSFORMATION OF POWER SECTOR THROUGH INVESTMENT IN SMART GRID TECHNOLOGY
6 SHORE POWER MARKET, BY INSTALLATION TYPE
- 6.1 INTRODUCTION
- 6.2 SHORESIDE
- 6.2.1 RISING ADOPTION OF RENEWABLE ENERGY TO ACHIEVE SUSTAINABILITY GOALS TO DRIVE SEGMENTAL GROWTH
- 6.3 SHIPSIDE
- 6.3.1 PRESSING NEED TO REDUCE EMISSIONS AND MINIMIZE NOISE POLLUTION IN PORT AREAS TO ACCELERATE SEGMENTAL GROWTH
- 6.3.2 BY VESSEL
- 6.3.2.1 Cruise
- 6.3.2.1.1 Rising investments by cruise industry in alternative fuels and advanced power technologies to augment market growth
- 6.3.2.2 Ferry
- 6.3.2.2.1 Increasing focus on sustainable public transportation to fuel segmental growth
- 6.3.2.3 Container vessel
- 6.3.2.3.1 Emphasis on sustainable logistics to increase adoption of shore power systems
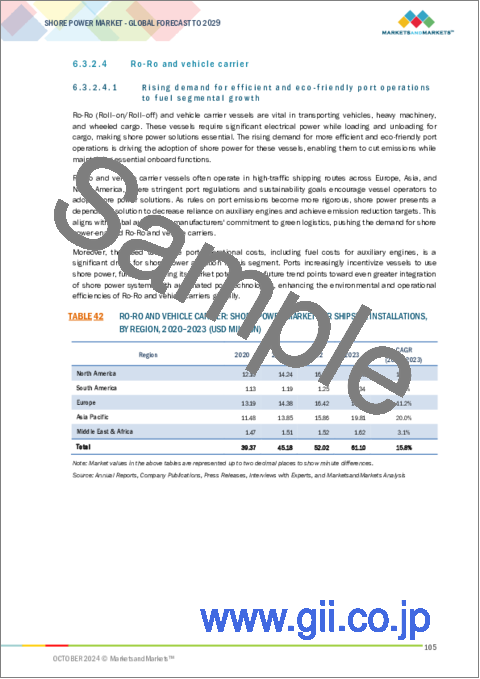
- 6.3.2.4 Ro-Ro and vehicle carrier
- 6.3.2.4.1 Rising demand for efficient and eco-friendly port operations to fuel segmental growth
- 6.3.2.5 Bulk carrier
- 6.3.2.5.1 Urgent need to reduce dependence on auxiliary engines to create potential for market growth
- 6.3.2.6 Tanker
- 6.3.2.6.1 Environmental regulations enabling greener and sustainable operations to contribute to market growth
- 6.3.2.7 General cargo
- 6.3.2.7.1 Rising fuel costs to encourage adoption of shore power systems
- 6.3.2.8 Other vessels
- 6.3.2.1 Cruise
7 SHORE POWER MARKET, BY CONNECTION TYPE
- 7.1 INTRODUCTION
- 7.2 NEW INSTALLATIONS
- 7.2.1 RAPID TRANSITION OF SHIPPING INDUSTRY TOWARD ALTERNATIVE FUELS TO CREATE LUCRATIVE OPPORTUNITIES
- 7.3 RETROFITS
- 7.3.1 PRESSING NEED TO MODERNIZE SHIPPING FLEET TO SUPPORT MARKET GROWTH
8 SHORE POWER MARKET, BY COMPONENT
- 8.1 INTRODUCTION
- 8.2 FREQUENCY CONVERTERS
- 8.2.1 ABILITY TO ENSURE SMOOTH OPERATION OF ONBOARD SYSTEMS BY OFFERING CORRECT FREQUENCY POWER TO ACCELERATE DEMAND
- 8.3 TRANSFORMERS
- 8.3.1 SIGNIFICANCE OF VOLTAGE REGULATION AND POWER DISTRIBUTION IN SHORE POWER SYSTEMS TO SPIKE DEMAND
- 8.4 SWITCHGEAR DEVICES
- 8.4.1 INCREASING FOCUS OF MARITIME INDUSTRY PLAYERS ON ELECTRIFICATION AND DECARBONIZATION TO BOOST DEMAND
- 8.5 CABLES & ACCESSORIES
- 8.5.1 RISING ADOPTION OF HIGHER VOLTAGE SHORE POWER SYSTEMS TO FUEL SEGMENTAL GROWTH
- 8.6 OTHER COMPONENTS
9 SHORE POWER MARKET, BY POWER OUTPUT
- 9.1 INTRODUCTION
- 9.2 BELOW 30 MVA
- 9.2.1 EMPHASIS OF CRUISE SHIPS AND FERRIES ON CURBING GHG EMISSIONS TO SPIKE DEMAND
- 9.3 30-60 MVA
- 9.3.1 NEED TO COMPLY WITH STRICT ENVIRONMENTAL REGULATIONS TO STIMULATE DEMAND
- 9.4 ABOVE 60 MVA
- 9.4.1 INCREASING INVESTMENT IN BUILDING HIGH-CAPACITY SHORE POWER FACILITIES TO FUEL SEGMENTAL GROWTH
10 SHORE POWER MARKET, BY REGION
- 10.1 INTRODUCTION
- 10.2 ASIA PACIFIC
- 10.2.1 CHINA
- 10.2.1.1 Investment in developing technologically advanced shore power system components to support market growth
- 10.2.2 INDIA
- 10.2.2.1 Adoption of cleaner fuels for port vehicles to create growth opportunities
- 10.2.3 SOUTH KOREA
- 10.2.3.1 Substantial investment in green port initiatives to drive market
- 10.2.4 AUSTRALIA
- 10.2.4.1 Initiatives to reduce greenhouse gas emissions from maritime activities to spur demand
- 10.2.5 SINGAPORE
- 10.2.5.1 Strategic investments in port infrastructure to fuel market growth
- 10.2.6 JAPAN
- 10.2.6.1 Significant focus on meeting international environmental standards to foster market growth
- 10.2.7 REST OF ASIA PACIFIC
- 10.2.1 CHINA
- 10.3 NORTH AMERICA
- 10.3.1 US
- 10.3.1.1 Clean energy transitions in transportation sector to accelerate demand
- 10.3.2 CANADA
- 10.3.2.1 Funding initiatives by federal and provincial governments to reduce GHG emissions in ports to boost demand
- 10.3.3 MEXICO
- 10.3.3.1 Significant focus on improving logistics infrastructure and reducing environmental impact to increase adoption
- 10.3.1 US
- 10.4 EUROPE
- 10.4.1 GERMANY
- 10.4.1.1 Emphasis on becoming leader in sustainable maritime practices to augment market growth
- 10.4.2 UK
- 10.4.2.1 Adoption of Clean Maritime Plan to achieve net-zero emission goals to support market growth
- 10.4.3 SWEDEN
- 10.4.3.1 Efforts to decarbonize maritime transport to propel market
- 10.4.4 NETHERLANDS
- 10.4.4.1 Initiative of transforming ports into carbon-neutral hubs to stimulate demand
- 10.4.5 NORWAY
- 10.4.5.1 Investments in green technologies to improve air quality in port areas to drive market
- 10.4.6 REST OF EUROPE
- 10.4.1 GERMANY
- 10.5 MIDDLE EAST & AFRICA
- 10.5.1 GCC
- 10.5.1.1 Saudi Arabia
- 10.5.1.1.1 Integration of renewable energy into maritime infrastructure to support market growth
- 10.5.1.2 UAE
- 10.5.1.2.1 Significant investments in solar and wind energy projects to provide clean electricity for ships to accelerate market growth
- 10.5.1.3 Rest of GCC
- 10.5.1.1 Saudi Arabia
- 10.5.2 EGYPT
- 10.5.2.1 Integration of renewable sources into shore power systems to drive market
- 10.5.3 SOUTH AFRICA
- 10.5.3.1 Government focus on reducing maritime pollution to boost demand
- 10.5.4 REST OF MIDDLE EAST & AFRICA
- 10.5.1 GCC
- 10.6 SOUTH AMERICA
- 10.6.1 BRAZIL
- 10.6.1.1 Extensive investments in renewable energy to create opportunities for shore power system providers
- 10.6.2 ARGENTINA
- 10.6.2.1 Commitment to sustainability and reducing emissions in key port areas to drive market
- 10.6.3 REST OF SOUTH AMERICA
- 10.6.1 BRAZIL
11 COMPETITIVE LANDSCAPE
- 11.1 INTRODUCTION
- 11.2 KEY PLAYER STRATEGIES/RIGHT TO WIN, 2021-2024
- 11.3 REVENUE ANALYSIS, 2019-2023
- 11.4 MARKET SHARE ANALYSIS, 2023
- 11.5 COMPANY VALUATION AND FINANCIAL METRICS
- 11.6 PRODUCT TYPE-/GEOGRAPHIC PRESENCE-WISE COMPARISON
- 11.7 COMPANY EVALUATION MATRIX: KEY PLAYERS, 2023
- 11.7.1 STARS
- 11.7.2 EMERGING LEADERS
- 11.7.3 PERVASIVE PLAYERS
- 11.7.4 PARTICIPANTS
- 11.7.5 COMPANY FOOTPRINT: KEY PLAYERS, 2023
- 11.7.5.1 Company footprint
- 11.7.5.2 Region footprint
- 11.7.5.3 Installation type footprint
- 11.7.5.4 Power output footprint
- 11.7.5.5 Connection type footprint
- 11.8 COMPANY EVALUATION MATRIX: STARTUPS/SMES, 2023
- 11.8.1 PROGRESSIVE COMPANIES
- 11.8.2 RESPONSIVE COMPANIES
- 11.8.3 DYNAMIC COMPANIES
- 11.8.4 STARTING BLOCKS
- 11.8.5 COMPETITIVE BENCHMARKING: STARTUPS/SMES, 2023
- 11.8.5.1 Detailed list of key startups/SMEs
- 11.8.5.2 Competitive benchmarking of key startups/SMEs
- 11.9 COMPETITIVE SCENARIO
- 11.9.1 PRODUCT LAUNCHES/DEVELOPMENTS
- 11.9.2 DEALS
- 11.9.3 EXPANSIONS
- 11.9.4 OTHER DEVELOPMENTS
12 COMPANY PROFILES
- 12.1 KEY PLAYERS
- 12.1.1 GENERAL ELECTRIC COMPANY
- 12.1.1.1 Business overview
- 12.1.1.2 Products offered
- 12.1.1.3 Recent developments
- 12.1.1.3.1 Deals
- 12.1.1.4 MnM view
- 12.1.1.4.1 Key strengths/Right to win
- 12.1.1.4.2 Strategic choices
- 12.1.1.4.3 Weaknesses/Competitive threats
- 12.1.2 SIEMENS
- 12.1.2.1 Business overview
- 12.1.2.2 Products offered
- 12.1.2.3 Recent developments
- 12.1.2.3.1 Product launches/Developments
- 12.1.2.3.2 Deals
- 12.1.2.3.3 Other developments
- 12.1.2.3.4 Expansions
- 12.1.2.4 MnM view
- 12.1.2.4.1 Key strengths/Right to win
- 12.1.2.4.2 Strategic choices
- 12.1.2.4.3 Weaknesses/Competitive threats
- 12.1.3 SCHNEIDER ELECTRIC
- 12.1.3.1 Business overview
- 12.1.3.2 Products offered
- 12.1.3.3 Recent developments
- 12.1.3.3.1 Deals
- 12.1.3.3.2 Expansions
- 12.1.3.4 MnM view
- 12.1.3.4.1 Key strengths/Right to win
- 12.1.3.4.2 Strategic choices
- 12.1.3.4.3 Weaknesses/Competitive threats
- 12.1.4 ABB
- 12.1.4.1 Business overview
- 12.1.4.2 Products offered
- 12.1.4.3 Recent developments
- 12.1.4.3.1 Product launches
- 12.1.4.3.2 Deals
- 12.1.4.3.3 Other developments
- 12.1.4.4 MnM view
- 12.1.4.4.1 Key strengths/Right to win
- 12.1.4.4.2 Strategic choices
- 12.1.4.4.3 Weaknesses/Competitive threats
- 12.1.5 CAVOTEC SA
- 12.1.5.1 Business overview
- 12.1.5.2 Products offered
- 12.1.5.3 Recent developments
- 12.1.5.3.1 Deals
- 12.1.5.3.2 Other developments
- 12.1.5.4 MnM view
- 12.1.5.4.1 Key strengths/Right to win
- 12.1.5.4.2 Strategic choices
- 12.1.5.4.3 Weaknesses/Competitive threats
- 12.1.6 EATON
- 12.1.6.1 Business overview
- 12.1.6.2 Products offered
- 12.1.6.3 Recent developments
- 12.1.6.3.1 Deals
- 12.1.6.3.2 Other developments
- 12.1.7 VINCI ENERGIES
- 12.1.7.1 Business overview
- 12.1.7.2 Products offered
- 12.1.7.3 Recent developments
- 12.1.7.3.1 Deals
- 12.1.8 WARTSILA
- 12.1.8.1 Business overview
- 12.1.8.2 Products offered
- 12.1.8.3 Recent developments
- 12.1.8.3.1 Deals
- 12.1.9 HITACHI ENERGY LTD.
- 12.1.9.1 Business overview
- 12.1.9.2 Products offered
- 12.1.9.3 Recent developments
- 12.1.9.3.1 Developments
- 12.1.10 DANFOSS
- 12.1.10.1 Business overview
- 12.1.10.2 Products offered
- 12.1.10.3 Recent developments
- 12.1.10.3.1 Deals
- 12.1.11 WABTEC CORPORATION
- 12.1.11.1 Business overview
- 12.1.11.2 Products offered
- 12.1.11.3 Recent developments
- 12.1.11.3.1 Deals
- 12.1.12 POWERCON A/S
- 12.1.12.1 Business overview
- 12.1.12.2 Products offered
- 12.1.12.3 Recent developments
- 12.1.12.3.1 Deals
- 12.1.13 ESL POWER SYSTEMS, INC.
- 12.1.13.1 Business overview
- 12.1.13.2 Products offered
- 12.1.14 IGUS
- 12.1.14.1 Business overview
- 12.1.14.2 Products offered
- 12.1.15 BLUE DAY TECHNOLOGY
- 12.1.15.1 Business overview
- 12.1.15.2 Products offered
- 12.1.15.3 Recent developments
- 12.1.15.3.1 Deals
- 12.1.15.3.2 Other developments
- 12.1.16 WATTS MARINE
- 12.1.16.1 Business overview
- 12.1.16.2 Products offered
- 12.1.16.3 Recent developments
- 12.1.16.3.1 Deals
- 12.1.17 AC POWER CORP.
- 12.1.17.1 Business overview
- 12.1.17.2 Products offered
- 12.1.18 SMARTPLUG
- 12.1.18.1 Business overview
- 12.1.18.2 Products offered
- 12.1.19 PILLER POWER SYSTEMS
- 12.1.19.1 Business overview
- 12.1.19.2 Products offered
- 12.1.20 POWER SYSTEMS INTERNATIONAL
- 12.1.20.1 Business overview
- 12.1.20.2 Products offered
- 12.1.1 GENERAL ELECTRIC COMPANY
- 12.2 OTHER PLAYERS
- 12.2.1 MANTA MARINE TECHNOLOGIES
- 12.2.2 CONNTEK INTEGRATED SOLUTIONS INC (U.S.A)
- 12.2.3 PATTON & COOKE CO.
- 12.2.4 RATIO ELECTRIC B.V.
- 12.2.5 SYDNEY MARINE ELECTRICALS
13 APPENDIX
- 13.1 INSIGHTS FROM INDUSTRY EXPERTS
- 13.2 DISCUSSION GUIDE
- 13.3 KNOWLEDGESTORE: MARKETSANDMARKETS' SUBSCRIPTION PORTAL
- 13.4 CUSTOMIZATION OPTIONS
- 13.5 RELATED REPORTS
- 13.6 AUTHOR DETAILS

