|
|
市場調査レポート
商品コード
1494759
陸上電力供給(陸電)市場の2030年までの予測:設置タイプ、接続、コンポーネント、エンドユーザー、地域別の世界分析Shore Power Market Forecasts to 2030 - Global Analysis By Installation Type (Shipside and Shoreside), Connection, Component, End User and By Geography |
||||||
|
|||||||
カスタマイズ可能
|
|||||||


| 陸上電力供給(陸電)市場の2030年までの予測:設置タイプ、接続、コンポーネント、エンドユーザー、地域別の世界分析 |
|
出版日: 2024年06月06日
発行: Stratistics Market Research Consulting
ページ情報: 英文 200+ Pages
納期: 2~3営業日
|

全表示
- 概要
- 図表
- 目次
ストラティスティックスMRCによると、世界の陸上電力供給(陸電)供給(陸電)市場は2024年に20億米ドルを占め、予測期間中のCAGRは13.2%で成長し、2030年には43億米ドルに達すると予想されています。
ショアパワーは、「コールドアイロニング」または「ショア・ツー・シップ・パワー」とも呼ばれ、停泊中の船舶に岸から電力を供給するプロセスです。これにより、船舶は、通常、照明、暖房、冷房、その他のオペレーションなど、必要不可欠なシステムの発電に使用される船上ディーゼル発電機の電源を切ることができます。岸壁発電は、ディーゼルエンジンの使用を最小限に抑えることで、港湾地域の大気汚染、騒音、振動の低減に役立っています。
国連貿易開発会議によると、海上輸送は国際貿易と世界経済の基盤であり、世界貿易量の80%以上が海上輸送によるものです。
港湾交通量の増加
海運セクターにおける環境規制や持続可能性への取り組みの高まりにより、港湾交通量が急増しています。世界中の港湾は、排出量を削減し、二酸化炭素削減目標を達成するために、陸上電力供給(陸電)ソリューションを採用しています。このような港湾交通量の増加は、港湾内での二酸化炭素排出量を最小限に抑えようとする船会社による陸上電力供給(陸電)技術の採用が拡大していることを裏付けています。この動向は、世界の海運業界において、よりクリーンで持続可能な慣行へと大きくシフトしていることを示しています。
標準化の問題
陸上電力供給(陸電)市場では標準化が大きな課題となっており、普及と相互運用性の妨げとなっています。港や地域によって技術仕様が異なるため、陸上電力供給(陸電)システムと船舶の間に互換性の問題が生じる。このような標準化の欠如は、港湾運営者と船会社の双方にとってコストを増加させ、陸上電力供給(陸電)インフラへの投資を抑制します。さらに、異なる規制や標準は、普遍的なソリューションの開発を複雑にし、より持続可能な海事産業への進展を妨げます。
再生可能エネルギーの統合
陸上電力供給(陸電)市場における再生可能エネルギーの統合は、持続可能な海運事業への極めて重要な一歩となります。風力、太陽光、潮力などの電源を利用することで、港湾は化石燃料への依存を減らし、環境への影響を緩和し、排出量を削減することができます。沿岸電力インフラは、船舶が停泊中に電力網に接続することを可能にし、再生可能エネルギーの海上活動へのシームレスな統合を促進します。この移行は、大気と水の浄化を促進するだけでなく、世界の海運業界におけるイノベーションと回復力を促進します。
高い初期費用
市場では、高い初期費用が参入の大きな障壁となっています。陸上電力供給(陸電)インフラを導入するには、陸上接続システム、電気インフラのアップグレード、船舶の改造など、特殊な設備への多額の投資が必要となります。これらのコストには、ハードウェアだけでなく、エンジニアリング、許認可、設置費用も含まれます。さらに、既存の港湾インフラと陸上電力供給(陸電)を統合することの複雑さが、初期財政負担をさらに増大させる。
COVID-19の影響:
COVID-19の大流行は、陸上電力供給(陸電)市場に大きな影響を与え、需要と供給の両方に混乱を引き起こしました。渡航制限や封鎖措置により海上活動が減少し、その結果、陸上電力供給(陸電)ソリューションに対する需要が減少しました。インフラ・プロジェクトの遅れや金融不安も、港湾電化への投資を妨げました。しかし、パンデミックは海事セクターにおける排出量削減の重要性を浮き彫りにし、業界における持続可能性への取り組みの一環として、陸上電力供給(陸電)技術の採用を長期的に成長させる可能性があります。
予測期間中、ケーブル・付属品セグメントが最大になる見込み
予測期間中は、ケーブルと付属品が最大となる見込みです。これらのコンポーネントには、高電圧送電に対応するよう設計されたさまざまな特殊ケーブル、コネクター、変圧器、配電盤が含まれます。耐久性、耐候性、さまざまな船舶タイプとの互換性に重点を置いたこれらの付属品は、シームレスな電力供給を促進し、陸上電力供給(陸電)接続に依存する船舶のダウンタイムを最小限に抑え、エネルギー効率を最適化します。
旅客港セグメントは予測期間中に最も高いCAGRが見込まれる
旅客港セグメントは、環境問題への関心と排出量削減のための規制により、予測期間中に最も高いCAGRが見込まれます。コールドアイロンや代替海上電力(AMP)としても知られるショアパワーは、船舶が停泊中に陸上の電力に接続することを可能にし、エンジンを稼働させる必要性をなくします。これにより、大気汚染が軽減されるだけでなく、港湾地域の騒音レベルも低下します。世界の主要な旅客港は、持続可能な海上オペレーションを支援し、環境面での信用を高めるため、陸上電力供給(陸電)インフラへの投資を増やしています。
最大のシェアを占める地域
予測期間中、北米が最大の市場シェアを占めると予測されます。コールドアイロンまたは代替海上電力(AMP)としても知られる陸上電力供給(陸電)は、船舶が停泊中に電力網に接続することを可能にし、船上発電機からの排出を削減します。港湾の持続可能性と大気汚染の軽減に重点を置く政府・港湾当局は、陸上電力供給(陸電)インフラの導入にインセンティブを与えており、同大陸全域での市場拡大を促進しています。
CAGRが最も高い地域:
アジア太平洋地域は、クリーンエネルギーソリューションの採用増加や厳しい環境規制を背景に、予測期間中に最も高いCAGRを維持すると予測されています。アジア太平洋の陸上電力供給(陸電)市場には、港湾当局、船主、技術プロバイダー、政府機関など様々な利害関係者が含まれます。この市場には、港湾における接続ポイント、変圧器、電気インフラなどの陸上電力供給(陸電)設備の設置や、陸上電力供給(陸電)への対応を可能にするための船舶の改造が含まれます。
無料カスタマイズサービス:
本レポートをご購読のお客様には、以下の無料カスタマイズオプションのいずれかをご利用いただけます:
- 企業プロファイル
- 追加市場プレーヤーの包括的プロファイリング(3社まで)
- 主要企業のSWOT分析(3社まで)
- 地域セグメンテーション
- 顧客の関心に応じた主要国の市場推計・予測・CAGR(注:フィージビリティチェックによる)
- 競合ベンチマーキング
- 製品ポートフォリオ、地理的プレゼンス、戦略的提携に基づく主要企業のベンチマーキング
目次
第1章 エグゼクティブサマリー
第2章 序文
- 概要
- ステークホルダー
- 調査範囲
- 調査手法
- データマイニング
- データ分析
- データ検証
- 調査アプローチ
- 調査情報源
- 1次調査情報源
- 2次調査情報源
- 前提条件
第3章 市場動向分析
- 促進要因
- 抑制要因
- 機会
- 脅威
- エンドユーザー分析
- 新興市場
- COVID-19の影響
第4章 ポーターのファイブフォース分析
- 供給企業の交渉力
- 買い手の交渉力
- 代替品の脅威
- 新規参入業者の脅威
- 競争企業間の敵対関係
第5章 世界の陸上電力供給(陸電)市場:設置タイプ別
- 船側
- 商船
- 特殊船
- オフショア支援船
- 旅客船
- 岸側
第6章 世界の陸上電力供給(陸電)市場:接続別
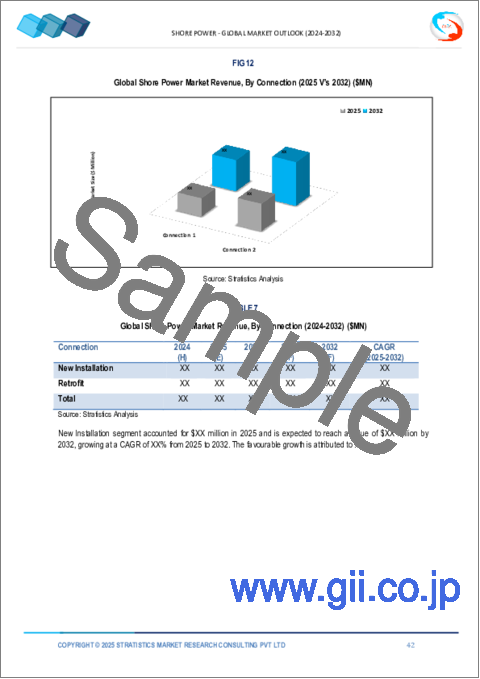
- 新規設置
- レトロフィット
第7章 世界の陸上電力供給(陸電)市場:コンポーネント別
- 周波数変換器
- ケーブルとアクセサリ
- トランスフォーマー
- スイッチギアデバイス
- その他のコンポーネント
第8章 世界の陸上電力供給(陸電)市場:エンドユーザー別
- 商業港
- 旅客港
- 軍港と政府港
- 工業港
- その他のエンドユーザー
第9章 世界の陸上電力供給(陸電)市場:地域別
- 北米
- 米国
- カナダ
- メキシコ
- 欧州
- ドイツ
- 英国
- イタリア
- フランス
- スペイン
- その他欧州
- アジア太平洋地域
- 日本
- 中国
- インド
- オーストラリア
- ニュージーランド
- 韓国
- その他アジア太平洋地域
- 南米
- アルゼンチン
- ブラジル
- チリ
- その他南米
- 中東・アフリカ
- サウジアラビア
- アラブ首長国連邦
- カタール
- 南アフリカ
- その他中東とアフリカ
第10章 主な発展
- 契約、パートナーシップ、コラボレーション、合弁事業
- 買収と合併
- 新製品発売
- 事業拡大
- その他の主要戦略
第11章 企業プロファイリング
- Siemens
- Schneider Electric SE
- ABB
- Wartsila
- Cavotec
- ESL Power Systems, Inc.
- VINCI Energies SA
- Cochran Marine LLC
- Blueday Technology
- SmartPlug System
- Power Systems International
- Igus Inc.
- Ensmart Power Ltd
- Nidec Industrial Solutions
- Hitachi Energy Ltd.
List of Tables
- Table 1 Global Shore Power Market Outlook, By Region (2021-2030) ($MN)
- Table 2 Global Shore Power Market Outlook, By Installation Type (2021-2030) ($MN)
- Table 3 Global Shore Power Market Outlook, By Shipside (2021-2030) ($MN)
- Table 4 Global Shore Power Market Outlook, By Merchant Vessel (2021-2030) ($MN)
- Table 5 Global Shore Power Market Outlook, By Specialized Vessel (2021-2030) ($MN)
- Table 6 Global Shore Power Market Outlook, By Offshore Support Vessel (2021-2030) ($MN)
- Table 7 Global Shore Power Market Outlook, By Passenger Vessel (2021-2030) ($MN)
- Table 8 Global Shore Power Market Outlook, By Shoreside (2021-2030) ($MN)
- Table 9 Global Shore Power Market Outlook, By Connection (2021-2030) ($MN)
- Table 10 Global Shore Power Market Outlook, By New Installation (2021-2030) ($MN)
- Table 11 Global Shore Power Market Outlook, By Retrofit (2021-2030) ($MN)
- Table 12 Global Shore Power Market Outlook, By Component (2021-2030) ($MN)
- Table 13 Global Shore Power Market Outlook, By Frequency Converter (2021-2030) ($MN)
- Table 14 Global Shore Power Market Outlook, By Cables and Accessories (2021-2030) ($MN)
- Table 15 Global Shore Power Market Outlook, By Transformers (2021-2030) ($MN)
- Table 16 Global Shore Power Market Outlook, By Switchgear Devices (2021-2030) ($MN)
- Table 17 Global Shore Power Market Outlook, By Other Components (2021-2030) ($MN)
- Table 18 Global Shore Power Market Outlook, By End User (2021-2030) ($MN)
- Table 19 Global Shore Power Market Outlook, By Commercial Ports (2021-2030) ($MN)
- Table 20 Global Shore Power Market Outlook, By Passenger Ports (2021-2030) ($MN)
- Table 21 Global Shore Power Market Outlook, By Military and Government Ports (2021-2030) ($MN)
- Table 22 Global Shore Power Market Outlook, By Industrial Ports (2021-2030) ($MN)
- Table 23 Global Shore Power Market Outlook, By Other End Users (2021-2030) ($MN)
- Table 24 North America Shore Power Market Outlook, By Country (2021-2030) ($MN)
- Table 25 North America Shore Power Market Outlook, By Installation Type (2021-2030) ($MN)
- Table 26 North America Shore Power Market Outlook, By Shipside (2021-2030) ($MN)
- Table 27 North America Shore Power Market Outlook, By Merchant Vessel (2021-2030) ($MN)
- Table 28 North America Shore Power Market Outlook, By Specialized Vessel (2021-2030) ($MN)
- Table 29 North America Shore Power Market Outlook, By Offshore Support Vessel (2021-2030) ($MN)
- Table 30 North America Shore Power Market Outlook, By Passenger Vessel (2021-2030) ($MN)
- Table 31 North America Shore Power Market Outlook, By Shoreside (2021-2030) ($MN)
- Table 32 North America Shore Power Market Outlook, By Connection (2021-2030) ($MN)
- Table 33 North America Shore Power Market Outlook, By New Installation (2021-2030) ($MN)
- Table 34 North America Shore Power Market Outlook, By Retrofit (2021-2030) ($MN)
- Table 35 North America Shore Power Market Outlook, By Component (2021-2030) ($MN)
- Table 36 North America Shore Power Market Outlook, By Frequency Converter (2021-2030) ($MN)
- Table 37 North America Shore Power Market Outlook, By Cables and Accessories (2021-2030) ($MN)
- Table 38 North America Shore Power Market Outlook, By Transformers (2021-2030) ($MN)
- Table 39 North America Shore Power Market Outlook, By Switchgear Devices (2021-2030) ($MN)
- Table 40 North America Shore Power Market Outlook, By Other Components (2021-2030) ($MN)
- Table 41 North America Shore Power Market Outlook, By End User (2021-2030) ($MN)
- Table 42 North America Shore Power Market Outlook, By Commercial Ports (2021-2030) ($MN)
- Table 43 North America Shore Power Market Outlook, By Passenger Ports (2021-2030) ($MN)
- Table 44 North America Shore Power Market Outlook, By Military and Government Ports (2021-2030) ($MN)
- Table 45 North America Shore Power Market Outlook, By Industrial Ports (2021-2030) ($MN)
- Table 46 North America Shore Power Market Outlook, By Other End Users (2021-2030) ($MN)
- Table 47 Europe Shore Power Market Outlook, By Country (2021-2030) ($MN)
- Table 48 Europe Shore Power Market Outlook, By Installation Type (2021-2030) ($MN)
- Table 49 Europe Shore Power Market Outlook, By Shipside (2021-2030) ($MN)
- Table 50 Europe Shore Power Market Outlook, By Merchant Vessel (2021-2030) ($MN)
- Table 51 Europe Shore Power Market Outlook, By Specialized Vessel (2021-2030) ($MN)
- Table 52 Europe Shore Power Market Outlook, By Offshore Support Vessel (2021-2030) ($MN)
- Table 53 Europe Shore Power Market Outlook, By Passenger Vessel (2021-2030) ($MN)
- Table 54 Europe Shore Power Market Outlook, By Shoreside (2021-2030) ($MN)
- Table 55 Europe Shore Power Market Outlook, By Connection (2021-2030) ($MN)
- Table 56 Europe Shore Power Market Outlook, By New Installation (2021-2030) ($MN)
- Table 57 Europe Shore Power Market Outlook, By Retrofit (2021-2030) ($MN)
- Table 58 Europe Shore Power Market Outlook, By Component (2021-2030) ($MN)
- Table 59 Europe Shore Power Market Outlook, By Frequency Converter (2021-2030) ($MN)
- Table 60 Europe Shore Power Market Outlook, By Cables and Accessories (2021-2030) ($MN)
- Table 61 Europe Shore Power Market Outlook, By Transformers (2021-2030) ($MN)
- Table 62 Europe Shore Power Market Outlook, By Switchgear Devices (2021-2030) ($MN)
- Table 63 Europe Shore Power Market Outlook, By Other Components (2021-2030) ($MN)
- Table 64 Europe Shore Power Market Outlook, By End User (2021-2030) ($MN)
- Table 65 Europe Shore Power Market Outlook, By Commercial Ports (2021-2030) ($MN)
- Table 66 Europe Shore Power Market Outlook, By Passenger Ports (2021-2030) ($MN)
- Table 67 Europe Shore Power Market Outlook, By Military and Government Ports (2021-2030) ($MN)
- Table 68 Europe Shore Power Market Outlook, By Industrial Ports (2021-2030) ($MN)
- Table 69 Europe Shore Power Market Outlook, By Other End Users (2021-2030) ($MN)
- Table 70 Asia Pacific Shore Power Market Outlook, By Country (2021-2030) ($MN)
- Table 71 Asia Pacific Shore Power Market Outlook, By Installation Type (2021-2030) ($MN)
- Table 72 Asia Pacific Shore Power Market Outlook, By Shipside (2021-2030) ($MN)
- Table 73 Asia Pacific Shore Power Market Outlook, By Merchant Vessel (2021-2030) ($MN)
- Table 74 Asia Pacific Shore Power Market Outlook, By Specialized Vessel (2021-2030) ($MN)
- Table 75 Asia Pacific Shore Power Market Outlook, By Offshore Support Vessel (2021-2030) ($MN)
- Table 76 Asia Pacific Shore Power Market Outlook, By Passenger Vessel (2021-2030) ($MN)
- Table 77 Asia Pacific Shore Power Market Outlook, By Shoreside (2021-2030) ($MN)
- Table 78 Asia Pacific Shore Power Market Outlook, By Connection (2021-2030) ($MN)
- Table 79 Asia Pacific Shore Power Market Outlook, By New Installation (2021-2030) ($MN)
- Table 80 Asia Pacific Shore Power Market Outlook, By Retrofit (2021-2030) ($MN)
- Table 81 Asia Pacific Shore Power Market Outlook, By Component (2021-2030) ($MN)
- Table 82 Asia Pacific Shore Power Market Outlook, By Frequency Converter (2021-2030) ($MN)
- Table 83 Asia Pacific Shore Power Market Outlook, By Cables and Accessories (2021-2030) ($MN)
- Table 84 Asia Pacific Shore Power Market Outlook, By Transformers (2021-2030) ($MN)
- Table 85 Asia Pacific Shore Power Market Outlook, By Switchgear Devices (2021-2030) ($MN)
- Table 86 Asia Pacific Shore Power Market Outlook, By Other Components (2021-2030) ($MN)
- Table 87 Asia Pacific Shore Power Market Outlook, By End User (2021-2030) ($MN)
- Table 88 Asia Pacific Shore Power Market Outlook, By Commercial Ports (2021-2030) ($MN)
- Table 89 Asia Pacific Shore Power Market Outlook, By Passenger Ports (2021-2030) ($MN)
- Table 90 Asia Pacific Shore Power Market Outlook, By Military and Government Ports (2021-2030) ($MN)
- Table 91 Asia Pacific Shore Power Market Outlook, By Industrial Ports (2021-2030) ($MN)
- Table 92 Asia Pacific Shore Power Market Outlook, By Other End Users (2021-2030) ($MN)
- Table 93 South America Shore Power Market Outlook, By Country (2021-2030) ($MN)
- Table 94 South America Shore Power Market Outlook, By Installation Type (2021-2030) ($MN)
- Table 95 South America Shore Power Market Outlook, By Shipside (2021-2030) ($MN)
- Table 96 South America Shore Power Market Outlook, By Merchant Vessel (2021-2030) ($MN)
- Table 97 South America Shore Power Market Outlook, By Specialized Vessel (2021-2030) ($MN)
- Table 98 South America Shore Power Market Outlook, By Offshore Support Vessel (2021-2030) ($MN)
- Table 99 South America Shore Power Market Outlook, By Passenger Vessel (2021-2030) ($MN)
- Table 100 South America Shore Power Market Outlook, By Shoreside (2021-2030) ($MN)
- Table 101 South America Shore Power Market Outlook, By Connection (2021-2030) ($MN)
- Table 102 South America Shore Power Market Outlook, By New Installation (2021-2030) ($MN)
- Table 103 South America Shore Power Market Outlook, By Retrofit (2021-2030) ($MN)
- Table 104 South America Shore Power Market Outlook, By Component (2021-2030) ($MN)
- Table 105 South America Shore Power Market Outlook, By Frequency Converter (2021-2030) ($MN)
- Table 106 South America Shore Power Market Outlook, By Cables and Accessories (2021-2030) ($MN)
- Table 107 South America Shore Power Market Outlook, By Transformers (2021-2030) ($MN)
- Table 108 South America Shore Power Market Outlook, By Switchgear Devices (2021-2030) ($MN)
- Table 109 South America Shore Power Market Outlook, By Other Components (2021-2030) ($MN)
- Table 110 South America Shore Power Market Outlook, By End User (2021-2030) ($MN)
- Table 111 South America Shore Power Market Outlook, By Commercial Ports (2021-2030) ($MN)
- Table 112 South America Shore Power Market Outlook, By Passenger Ports (2021-2030) ($MN)
- Table 113 South America Shore Power Market Outlook, By Military and Government Ports (2021-2030) ($MN)
- Table 114 South America Shore Power Market Outlook, By Industrial Ports (2021-2030) ($MN)
- Table 115 South America Shore Power Market Outlook, By Other End Users (2021-2030) ($MN)
- Table 116 Middle East & Africa Shore Power Market Outlook, By Country (2021-2030) ($MN)
- Table 117 Middle East & Africa Shore Power Market Outlook, By Installation Type (2021-2030) ($MN)
- Table 118 Middle East & Africa Shore Power Market Outlook, By Shipside (2021-2030) ($MN)
- Table 119 Middle East & Africa Shore Power Market Outlook, By Merchant Vessel (2021-2030) ($MN)
- Table 120 Middle East & Africa Shore Power Market Outlook, By Specialized Vessel (2021-2030) ($MN)
- Table 121 Middle East & Africa Shore Power Market Outlook, By Offshore Support Vessel (2021-2030) ($MN)
- Table 122 Middle East & Africa Shore Power Market Outlook, By Passenger Vessel (2021-2030) ($MN)
- Table 123 Middle East & Africa Shore Power Market Outlook, By Shoreside (2021-2030) ($MN)
- Table 124 Middle East & Africa Shore Power Market Outlook, By Connection (2021-2030) ($MN)
- Table 125 Middle East & Africa Shore Power Market Outlook, By New Installation (2021-2030) ($MN)
- Table 126 Middle East & Africa Shore Power Market Outlook, By Retrofit (2021-2030) ($MN)
- Table 127 Middle East & Africa Shore Power Market Outlook, By Component (2021-2030) ($MN)
- Table 128 Middle East & Africa Shore Power Market Outlook, By Frequency Converter (2021-2030) ($MN)
- Table 129 Middle East & Africa Shore Power Market Outlook, By Cables and Accessories (2021-2030) ($MN)
- Table 130 Middle East & Africa Shore Power Market Outlook, By Transformers (2021-2030) ($MN)
- Table 131 Middle East & Africa Shore Power Market Outlook, By Switchgear Devices (2021-2030) ($MN)
- Table 132 Middle East & Africa Shore Power Market Outlook, By Other Components (2021-2030) ($MN)
- Table 133 Middle East & Africa Shore Power Market Outlook, By End User (2021-2030) ($MN)
- Table 134 Middle East & Africa Shore Power Market Outlook, By Commercial Ports (2021-2030) ($MN)
- Table 135 Middle East & Africa Shore Power Market Outlook, By Passenger Ports (2021-2030) ($MN)
- Table 136 Middle East & Africa Shore Power Market Outlook, By Military and Government Ports (2021-2030) ($MN)
- Table 137 Middle East & Africa Shore Power Market Outlook, By Industrial Ports (2021-2030) ($MN)
- Table 138 Middle East & Africa Shore Power Market Outlook, By Other End Users (2021-2030) ($MN)
According to Stratistics MRC, the Global Shore Power Market is accounted for $2.0 billion in 2024 and is expected to reach $4.3 billion by 2030 growing at a CAGR of 13.2% during the forecast period. Shore power, also known as "cold ironing" or "shore-to-ship power," is the process of providing electrical power from the shore to a ship while it is docked. This allows the ship to turn off its onboard diesel generators, which are typically used to generate electricity for essential systems such as lighting, heating, cooling, and other operations. Shore power helps to reduce air pollution, noise, and vibrations in port areas by minimizing the use of diesel engines.
According to the United Nations Conference on Trade and Development, maritime transport is the foundation of international trade and the global economy with over 80% of the volume of global trade in goods is carried by sea, and the percentage is even higher for most developing countries
Market Dynamics:
Driver:
Increased port traffic
The market is witnessing a surge in port traffic, driven by increasing environmental regulations and sustainability initiatives in the maritime sector. Ports worldwide are embracing shore power solutions to reduce emissions and meet carbon reduction targets. This uptick in port traffic underscores the growing adoption of shore power technologies by shipping companies seeking to minimize their carbon footprint while in port. The trend signals a significant shift towards cleaner and more sustainable practices within the global maritime industry.
Restraint:
Standardization Issues
Standardization poses a significant challenge in the shore power market, hindering widespread adoption and interoperability. Varying technical specifications across ports and regions create compatibility issues between shore power systems and vessels. This lack of standardization increases costs for both port operators and shipping companies, discouraging investment in shore power infrastructure. Additionally, differing regulations and standards complicate the development of universal solutions, impeding progress toward a more sustainable maritime industry.
Opportunity:
Renewable energy integration
Renewable energy integration in the shore power market represents a pivotal step towards sustainable maritime operations. By harnessing sources like wind, solar, or tidal power, ports can reduce reliance on fossil fuels, mitigating environmental impact and cutting emissions. Shore power infrastructure enables vessels to connect to the electrical grid while docked, facilitating the seamless integration of renewable energy into maritime activities. This transition not only promotes cleaner air and water but also fosters innovation and resilience in the global shipping industry.
Threat:
High upfront costs
In the market, high upfront costs pose a significant barrier to entry. Implementing shore power infrastructure requires substantial investment in specialized equipment such as shore connection systems, electrical infrastructure upgrades, and vessel modifications. These costs encompass not only the hardware but also engineering, permitting, and installation expenses. Additionally, the complexity of integrating shore power with existing port infrastructure further adds to the initial financial burden.
Covid-19 Impact:
The COVID-19 pandemic significantly affected the shore power market, causing disruptions in both supply and demand. Travel restrictions and lockdown measures led to reduced maritime activities, resulting in decreased demand for shore power solutions. Delays in infrastructure projects and financial uncertainties also hampered investment in port electrification. However, the pandemic highlighted the importance of reducing emissions in the maritime sector, potentially driving long-term growth in the adoption of shore power technologies as part of sustainability efforts within the industry.
The cables and accessories segment is expected to be the largest during the forecast period
The cables and accessories is expected to be the largest during the forecast period. These components encompass a range of specialized cables, connectors, transformers, and distribution panels designed to handle high voltage power transfer. With a focus on durability, weather resistance, and compatibility with varying vessel types, these accessories facilitate seamless power delivery, minimizing downtime and optimizing energy efficiency for vessels relying on shore power connections.
The passenger ports segment is expected to have the highest CAGR during the forecast period
The passenger ports segment is expected to have the highest CAGR during the forecast period driven by environmental concerns and regulations to reduce emissions. Shore power, also known as cold ironing or Alternative Maritime Power (AMP), allows ships to connect to land-based electrical power while docked, eliminating the need to run their engines. This not only reduces air pollution but also noise levels in port areas. Major passenger ports worldwide are increasingly investing in shore power infrastructure to support sustainable maritime operations and enhance their environmental credentials.
Region with largest share:
North America is projected to hold the largest market share during the forecast period. Shore power, also known as cold ironing or alternative maritime power (AMP), enables vessels to connect to the electrical grid while docked, reducing emissions from onboard generators. With a focus on sustainability and reducing air pollution in ports, governments and port authorities are incentivizing the implementation of shore power infrastructure, fostering market expansion across the continent.
Region with highest CAGR:
Asia Pacific is projected to hold the highest CAGR over the forecast period driven by the increasing adoption of clean energy solutions and stringent environmental regulations. The Asia Pacific shore power market encompasses various stakeholders, including port authorities, shipowners, technology providers, and government agencies. It involves the installation of shore power equipment such as connection points, transformers, and electrical infrastructure in ports, as well as the modification of ships to enable shore power compatibility.
Key players in the market
Some of the key players in Shore Power market include Siemens , Schneider Electric SE, ABB, Wartsila, Cavotec, ESL Power Systems, Inc., VINCI Energies SA, Cochran Marine LLC, Blueday Technology, SmartPlug System, Power Systems International, Igus Inc., Ensmart Power Ltd, Nidec Industrial Solutions and Hitachi Energy Ltd.
Key Developments:
In May 2023, ABB signed an agreement with Finnish shipbuilder Meyer Turku to supply two new Finnish multipurpose patrol vessels with an integrated power and propulsion package, including two Azipod thrusters and an Onboard DC Grid(TM) electrical system.
In September 2022, Wartsila Corporation signed a contract to supply an integrated hybrid propulsion system for two new hybrid ro-ro vessels. The ships would be built at China Merchants Jinling Shipyard (Weihai) Co., Ltd. for the Swedish shipping company Stena RoRo.
In May 2022, Siemens announced the construction of two new SIHARBOR in Kiel, which will be Europe's largest shore-power connections and will be operating by the end of year 2023. These two shore power systems supply sustainable power through local power grid systems.
Installation Types Covered:
- Shipside
- Shoreside
Connections Covered:
- New Installation
- Retrofit
Components Covered:
- Frequency Converter
- Cables and Accessories
- Transformers
- Switchgear Devices
- Other Components
End Users Covered:
- Commercial Ports
- Passenger Ports
- Military and Government Ports
- Industrial Ports
- Other End Users
Regions Covered:
- North America
- US
- Canada
- Mexico
- Europe
- Germany
- UK
- Italy
- France
- Spain
- Rest of Europe
- Asia Pacific
- Japan
- China
- India
- Australia
- New Zealand
- South Korea
- Rest of Asia Pacific
- South America
- Argentina
- Brazil
- Chile
- Rest of South America
- Middle East & Africa
- Saudi Arabia
- UAE
- Qatar
- South Africa
- Rest of Middle East & Africa
What our report offers:
- Market share assessments for the regional and country-level segments
- Strategic recommendations for the new entrants
- Covers Market data for the years 2022, 2023, 2024, 2026, and 2030
- Market Trends (Drivers, Constraints, Opportunities, Threats, Challenges, Investment Opportunities, and recommendations)
- Strategic recommendations in key business segments based on the market estimations
- Competitive landscaping mapping the key common trends
- Company profiling with detailed strategies, financials, and recent developments
- Supply chain trends mapping the latest technological advancements
Free Customization Offerings:
All the customers of this report will be entitled to receive one of the following free customization options:
- Company Profiling
- Comprehensive profiling of additional market players (up to 3)
- SWOT Analysis of key players (up to 3)
- Regional Segmentation
- Market estimations, Forecasts and CAGR of any prominent country as per the client's interest (Note: Depends on feasibility check)
- Competitive Benchmarking
- Benchmarking of key players based on product portfolio, geographical presence, and strategic alliances
Table of Contents
1 Executive Summary
2 Preface
- 2.1 Abstract
- 2.2 Stake Holders
- 2.3 Research Scope
- 2.4 Research Methodology
- 2.4.1 Data Mining
- 2.4.2 Data Analysis
- 2.4.3 Data Validation
- 2.4.4 Research Approach
- 2.5 Research Sources
- 2.5.1 Primary Research Sources
- 2.5.2 Secondary Research Sources
- 2.5.3 Assumptions
3 Market Trend Analysis
- 3.1 Introduction
- 3.2 Drivers
- 3.3 Restraints
- 3.4 Opportunities
- 3.5 Threats
- 3.6 End User Analysis
- 3.7 Emerging Markets
- 3.8 Impact of Covid-19
4 Porters Five Force Analysis
- 4.1 Bargaining power of suppliers
- 4.2 Bargaining power of buyers
- 4.3 Threat of substitutes
- 4.4 Threat of new entrants
- 4.5 Competitive rivalry
5 Global Shore Power Market, By Installation Type
- 5.1 Introduction
- 5.2 Shipside
- 5.2.1 Merchant Vessel
- 5.2.2 Specialized Vessel
- 5.2.3 Offshore Support Vessel
- 5.2.4 Passenger Vessel
- 5.3 Shoreside
6 Global Shore Power Market, By Connection
- 6.1 Introduction
- 6.2 New Installation
- 6.3 Retrofit
7 Global Shore Power Market, By Component
- 7.1 Introduction
- 7.2 Frequency Converter
- 7.3 Cables and Accessories
- 7.4 Transformers
- 7.5 Switchgear Devices
- 7.6 Other Components
8 Global Shore Power Market, By End User
- 8.1 Introduction
- 8.2 Commercial Ports
- 8.3 Passenger Ports
- 8.4 Military and Government Ports
- 8.5 Industrial Ports
- 8.6 Other End Users
9 Global Shore Power Market, By Geography
- 9.1 Introduction
- 9.2 North America
- 9.2.1 US
- 9.2.2 Canada
- 9.2.3 Mexico
- 9.3 Europe
- 9.3.1 Germany
- 9.3.2 UK
- 9.3.3 Italy
- 9.3.4 France
- 9.3.5 Spain
- 9.3.6 Rest of Europe
- 9.4 Asia Pacific
- 9.4.1 Japan
- 9.4.2 China
- 9.4.3 India
- 9.4.4 Australia
- 9.4.5 New Zealand
- 9.4.6 South Korea
- 9.4.7 Rest of Asia Pacific
- 9.5 South America
- 9.5.1 Argentina
- 9.5.2 Brazil
- 9.5.3 Chile
- 9.5.4 Rest of South America
- 9.6 Middle East & Africa
- 9.6.1 Saudi Arabia
- 9.6.2 UAE
- 9.6.3 Qatar
- 9.6.4 South Africa
- 9.6.5 Rest of Middle East & Africa
10 Key Developments
- 10.1 Agreements, Partnerships, Collaborations and Joint Ventures
- 10.2 Acquisitions & Mergers
- 10.3 New Product Launch
- 10.4 Expansions
- 10.5 Other Key Strategies
11 Company Profiling
- 11.1 Siemens
- 11.2 Schneider Electric SE
- 11.3 ABB
- 11.4 Wartsila
- 11.5 Cavotec
- 11.6 ESL Power Systems, Inc.
- 11.7 VINCI Energies SA
- 11.8 Cochran Marine LLC
- 11.9 Blueday Technology
- 11.10 SmartPlug System
- 11.11 Power Systems International
- 11.12 Igus Inc.
- 11.13 Ensmart Power Ltd
- 11.14 Nidec Industrial Solutions
- 11.15 Hitachi Energy Ltd.
