|
|
市場調査レポート
商品コード
1420813
サーマルインターフェース材料(TIM)市場:世界の業界分析、規模、シェア、成長、動向、および2023年~2031年予測Thermal Interface Materials Market - Global Industry Analysis, Size, Share, Growth, Trends, and Forecast 2023-2031 |
||||||
|
|
|||||||
カスタマイズ可能
|
|||||||


| サーマルインターフェース材料(TIM)市場:世界の業界分析、規模、シェア、成長、動向、および2023年~2031年予測 |
|
出版日: 2023年12月05日
発行: Transparency Market Research
ページ情報: 英文 205 Pages
納期: 2~10営業日
|

全表示
- 概要
- 図表
- 目次
サーマルインターフェース材料市場- レポートの範囲
世界のサーマルインターフェース材料市場に関するTMRのレポートは、過去と現在の成長動向、および2023年から2031年の予測期間中に市場の指標の貴重な洞察を得る機会を研究しています。レポートは、世界のサーマルインターフェース材料の収益を提供します。 2023年を基準年、2031年を予測年とみなして、2017年から2031年の期間の市場を分析します。このレポートは、2023年から2031年までの世界のサーマルインターフェース材料市場の複合年間成長率(CAGR %)も提供します。
このレポートは広範な調査を経て作成されました。1次調査では、調査活動の大部分が行われ、アナリストが主要なオピニオンリーダー、業界リーダー、オピニオンメーカーにインタビューを実施しました。2次調査には、サーマルインターフェース材料市場を理解するために、主要企業の製品文献、年次報告書、プレスリリース、および関連文書の参照が含まれます。
| 市場スナップショット | |
|---|---|
| 2023年の市場価値 | 28億米ドル |
| 2031年の市場価値 | 60億米ドル |
| CAGR | 8.9% |
このレポートは、世界のサーマルインターフェース材料市場の競合情勢を詳しく掘り下げています。世界のサーマルインターフェース材料市場で活動する主要プレーヤーが特定され、これらのそれぞれがさまざまな属性の観点からプロファイルされています。会社概要、財務状況、最近の動向、 SWOTは、このレポートで紹介されている世界のサーマルインターフェース材料市場のプレーヤーの属性です。
目次
第1章 エグゼクティブサマリー
第2章 市場概要
- 市場セグメンテーション
- 主な発展
- 市場の定義
- 主要な市場動向
- 市場力学
- 世界市場の分析と予測、2023年~2031年
- ポーターのファイブフォース分析
- 規制状況
- バリューチェーン分析
- 製品仕様の分析
- 生産概要
- コスト構造分析
第3章 COVID-19感染症の影響分析
- サプライチェーンへの影響
- 危機前後の需要への影響
第4章 現在の地政学的シナリオが市場に与える影響
第5章 価格動向分析と予測、2023年~2031年
- 素材別価格動向分析
- 地域別の価格動向分析
第6章 世界市場分析と予測:材料別、2023年~2031年
- イントロダクションと定義
- 世界市場金額予測:素材別、2023年~2031年
- 接着剤とグリース
- サーマルテープおよびフィルム
- ギャップフィラー
- 熱相変化材料
- 金属系
- その他
- 世界市場の魅力:素材別
第7章 世界市場の分析と予測:用途別、2023年~2031年
- イントロダクションと定義
- 世界市場金額予測:用途別、2023年~2031年
- コンピュータ
- カーエレクトロニクス
- 産業機械
- 電気通信
- 耐久消費財
- 医療機器
- その他
- 世界市場の魅力:用途別
第8章 世界市場の分析と予測:地域別、2023年~2031年
- 主な調査結果
- 世界市場金額予測:地域別、2023年~2031年
- 北米
- 欧州
- アジア太平洋地域
- ラテンアメリカ
- 中東・アフリカ
- 世界市場の魅力:地域別
第9章 北米市場の分析と予測、2023年~2031年
第10章 欧州市場の分析と予測、2023年~2031年
第11章 アジア太平洋市場の分析と予測、2023年~2031年
第12章 ラテンアメリカ市場の分析と予測、2023年~2031年
第13章 中東およびアフリカ市場の分析と予測、2023年~2031年
第14章 競合情勢
- 世界市場の企業シェア分析、2022年
- 企業プロファイル(詳細- 概要、財務、最近の展開、戦略)
- Semikron Danfoss
- Wakefield Thermal, Inc.
- DK Thermal(HK)Limited
- Indium Corporation
- Momentive Performance Materials
- Parker Hannifin Corp.
- Honeywell International Inc.
- 3M
- Henkel AG &Company KGaA
- Dow
第15章 1次調査:重要な洞察
第16章 付録
List of Tables
- Table 1: Global Thermal Interface Materials Market Value (US$ Mn) Forecast, by Material, 2023-2031
- Table 2: Global Thermal Interface Materials Market Value (US$ Mn) Forecast, by Application, 2023-2031
- Table 3: Global Thermal Interface Materials Market Value (US$ Mn) Forecast, by Region, 2023-2031
- Table 4: North America Thermal Interface Materials Market Value (US$ Mn) Forecast, by Material, 2023-2031
- Table 5: North America Thermal Interface Materials Market Value (US$ Mn) Forecast, by Application, 2023-2031
- Table 6: North America Thermal Interface Materials Market Value (US$ Mn) Forecast, by Country, 2023-2031
- Table 7: U.S. Thermal Interface Materials Market Value (US$ Mn) Forecast, by Material, 2023-2031
- Table 8: U.S. Thermal Interface Materials Market Value (US$ Mn) Forecast, by Application, 2023-2031
- Table 9: Canada Thermal Interface Materials Market Value (US$ Mn) Forecast, by Material, 2023-2031
- Table 10: Canada Thermal Interface Materials Market Value (US$ Mn) Forecast, by Application, 2023-2031
- Table 11: Europe Thermal Interface Materials Market Value (US$ Mn) Forecast, by Material, 2023-2031
- Table 12: Europe Thermal Interface Materials Market Value (US$ Mn) Forecast, by Application, 2023-2031
- Table 13: Europe Thermal Interface Materials Market Value (US$ Mn) Forecast, by Country and Sub-region, 2023-2031
- Table 14: Germany Thermal Interface Materials Market Value (US$ Mn) Forecast, by Material, 2023-2031
- Table 15: Germany Thermal Interface Materials Market Value (US$ Mn) Forecast, by Application, 2023-2031
- Table 16: France Thermal Interface Materials Market Value (US$ Mn) Forecast, by Material, 2023-2031
- Table 17: France Thermal Interface Materials Market Value (US$ Mn) Forecast, by Application, 2023-2031
- Table 18: U.K. Thermal Interface Materials Market Value (US$ Mn) Forecast, by Material, 2023-2031
- Table 19: U.K. Thermal Interface Materials Market Value (US$ Mn) Forecast, by Application, 2023-2031
- Table 20: Italy Thermal Interface Materials Market Value (US$ Mn) Forecast, by Material, 2023-2031
- Table 21: Italy Thermal Interface Materials Market Value (US$ Mn) Forecast, by Application, 2023-2031
- Table 22: Spain Thermal Interface Materials Market Value (US$ Mn) Forecast, by Material, 2023-2031
- Table 23: Spain Thermal Interface Materials Market Value (US$ Mn) Forecast, by Application, 2023-2031
- Table 24: Russia & CIS Thermal Interface Materials Market Value (US$ Mn) Forecast, by Material, 2023-2031
- Table 25: Russia & CIS Thermal Interface Materials Market Value (US$ Mn) Forecast, by Application, 2023-2031
- Table 26: Rest of Europe Thermal Interface Materials Market Value (US$ Mn) Forecast, by Material, 2023-2031
- Table 27: Rest of Europe Thermal Interface Materials Market Value (US$ Mn) Forecast, by Application, 2023-2031
- Table 28: Asia Pacific Thermal Interface Materials Market Value (US$ Mn) Forecast, by Material, 2023-2031
- Table 29: Asia Pacific Thermal Interface Materials Market Value (US$ Mn) Forecast, by Application, 2023-2031
- Table 30: Asia Pacific Thermal Interface Materials Market Value (US$ Mn) Forecast, by Country and Sub-region, 2023-2031
- Table 31: China Thermal Interface Materials Market Value (US$ Mn) Forecast, by Material 2023-2031
- Table 32: China Thermal Interface Materials Market Value (US$ Mn) Forecast, by Application, 2023-2031
- Table 33: Japan Thermal Interface Materials Market Value (US$ Mn) Forecast, by Material, 2023-2031
- Table 34: Japan Thermal Interface Materials Market Value (US$ Mn) Forecast, by Application, 2023-2031
- Table 35: India Thermal Interface Materials Market Value (US$ Mn) Forecast, by Material, 2023-2031
- Table 36: India Thermal Interface Materials Market Value (US$ Mn) Forecast, by Application, 2023-2031
- Table 37: ASEAN Thermal Interface Materials Market Value (US$ Mn) Forecast, by Material, 2023-2031
- Table 38: ASEAN Thermal Interface Materials Market Value (US$ Mn) Forecast, by Application, 2023-2031
- Table 39: Rest of Asia Pacific Thermal Interface Materials Market Value (US$ Mn) Forecast, by Material, 2023-2031
- Table 40: Rest of Asia Pacific Thermal Interface Materials Market Value (US$ Mn) Forecast, by Application, 2023-2031
- Table 41: Latin America Thermal Interface Materials Market Value (US$ Mn) Forecast, by Material, 2023-2031
- Table 42: Latin America Thermal Interface Materials Market Value (US$ Mn) Forecast, by Application, 2023-2031
- Table 43: Latin America Thermal Interface Materials Market Value (US$ Mn) Forecast, by Country and Sub-region, 2023-2031
- Table 44: Brazil Thermal Interface Materials Market Value (US$ Mn) Forecast, by Material, 2023-2031
- Table 45: Brazil Thermal Interface Materials Market Value (US$ Mn) Forecast, by Application, 2023-2031
- Table 46: Mexico Thermal Interface Materials Market Value (US$ Mn) Forecast, by Material, 2023-2031
- Table 47: Mexico Thermal Interface Materials Market Value (US$ Mn) Forecast, by Application, 2023-2031
- Table 48: Rest of Latin America Thermal Interface Materials Market Value (US$ Mn) Forecast, by Material, 2023-2031
- Table 49: Rest of Latin America Thermal Interface Materials Market Value (US$ Mn) Forecast, by Application, 2023-2031
- Table 50: Middle East & Africa Thermal Interface Materials Market Value (US$ Mn) Forecast, by Material, 2023-2031
- Table 51: Middle East & Africa Thermal Interface Materials Market Value (US$ Mn) Forecast, by Application, 2023-2031
- Table 52: Middle East & Africa Thermal Interface Materials Market Value (US$ Mn) Forecast, by Country and Sub-region, 2023-2031
- Table 53: GCC Thermal Interface Materials Market Value (US$ Mn) Forecast, by Material, 2023-2031
- Table 54: GCC Thermal Interface Materials Market Value (US$ Mn) Forecast, by Application, 2023-2031
- Table 55: South Africa Thermal Interface Materials Market Value (US$ Mn) Forecast, by Material, 2023-2031
- Table 56: South Africa Thermal Interface Materials Market Value (US$ Mn) Forecast, by Application, 2023-2031
- Table 57: Rest of Middle East & Africa Thermal Interface Materials Market Value (US$ Mn) Forecast, by Material, 2023-2031
- Table 58: Rest of Middle East & Africa Thermal Interface Materials Market Value (US$ Mn) Forecast, by Application, 2023-2031
List of Figures
- Figure 1: Global Thermal Interface Materials Market Value Share Analysis, by Material, 2022, 2027, and 2031
- Figure 2: Global Thermal Interface Materials Market Attractiveness, by Material
- Figure 3: Global Thermal Interface Materials Market Value Share Analysis, by Application, 2022, 2027, and 2031
- Figure 4: Global Thermal Interface Materials Market Attractiveness, by Application
- Figure 5: Global Thermal Interface Materials Market Value Share Analysis, by Region, 2022, 2027, and 2031
- Figure 6: Global Thermal Interface Materials Market Attractiveness, by Region
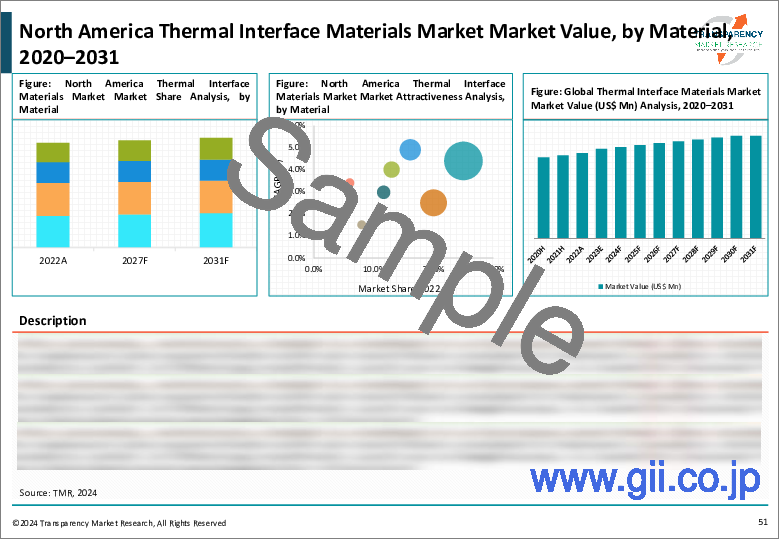
- Figure 7: North America Thermal Interface Materials Market Value Share Analysis, by Material, 2022, 2027, and 2031
- Figure 8: North America Thermal Interface Materials Market Attractiveness, by Material
- Figure 9: North America Thermal Interface Materials Market Value Share Analysis, by Application, 2022, 2027, and 2031
- Figure 10: North America Thermal Interface Materials Market Attractiveness, by Application
- Figure 11: North America Thermal Interface Materials Market Value Share Analysis, by Country, 2022, 2027, and 2031
- Figure 12: North America Thermal Interface Materials Market Attractiveness, by Country
- Figure 13: Europe Thermal Interface Materials Market Value Share Analysis, by Material, 2022, 2027, and 2031
- Figure 14: Europe Thermal Interface Materials Market Attractiveness, by Material
- Figure 15: Europe Thermal Interface Materials Market Value Share Analysis, by Application, 2022, 2027, and 2031
- Figure 16: Europe Thermal Interface Materials Market Attractiveness, by Application
- Figure 17: Europe Thermal Interface Materials Market Value Share Analysis, by Country and Sub-region, 2022, 2027, and 2031
- Figure 18: Europe Thermal Interface Materials Market Attractiveness, by Country and Sub-region
- Figure 19: Asia Pacific Thermal Interface Materials Market Value Share Analysis, by Material, 2022, 2027, and 2031
- Figure 20: Asia Pacific Thermal Interface Materials Market Attractiveness, by Material
- Figure 21: Asia Pacific Thermal Interface Materials Market Value Share Analysis, by Application, 2022, 2027, and 2031
- Figure 22: Asia Pacific Thermal Interface Materials Market Attractiveness, by Application
- Figure 23: Asia Pacific Thermal Interface Materials Market Value Share Analysis, by Country and Sub-region, 2022, 2027, and 2031
- Figure 24: Asia Pacific Thermal Interface Materials Market Attractiveness, by Country and Sub-region
- Figure 25: Latin America Thermal Interface Materials Market Value Share Analysis, by Material, 2022, 2027, and 2031
- Figure 26: Latin America Thermal Interface Materials Market Attractiveness, by Material
- Figure 27: Latin America Thermal Interface Materials Market Value Share Analysis, by Application, 2022, 2027, and 2031
- Figure 28: Latin America Thermal Interface Materials Market Attractiveness, by Application
- Figure 29: Latin America Thermal Interface Materials Market Value Share Analysis, by Country and Sub-region, 2022, 2027, and 2031
- Figure 30: Latin America Thermal Interface Materials Market Attractiveness, by Country and Sub-region
- Figure 31: Middle East & Africa Thermal Interface Materials Market Value Share Analysis, by Material, 2022, 2027, and 2031
- Figure 32: Middle East & Africa Thermal Interface Materials Market Attractiveness, by Material
- Figure 33: Middle East & Africa Thermal Interface Materials Market Value Share Analysis, by Application, 2022, 2027, and 2031
- Figure 34: Middle East & Africa Thermal Interface Materials Market Attractiveness, by Application
- Figure 35: Middle East & Africa Thermal Interface Materials Market Value Share Analysis, by Country and Sub-region, 2022, 2027, and 2031
- Figure 36: Middle East & Africa Thermal Interface Materials Market Attractiveness, by Country and Sub-region
Thermal Interface Materials Market - Scope of Report
TMR's report on the global thermal interface materials market studies the past as well as the current growth trends and opportunities to gain valuable insights of the indicators of the market during the forecast period from 2023 to 2031. The report provides revenue of the global thermal interface materials market for the period 2017-2031, considering 2023 as the base year and 2031 as the forecast year. The report also provides the compound annual growth rate (CAGR %) of the global thermal interface materials market from 2023 to 2031.
The report has been prepared after an extensive research. Primary research involved bulk of the research efforts, wherein analysts carried out interviews with key opinion leaders, industry leaders, and opinion makers. Secondary research involved referring to key players' product literature, annual reports, press releases, and relevant documents to understand the thermal interface materials market.
| Market Snapshot | |
|---|---|
| Market Value in 2023 | US$ 2.8 Bn |
| Market Value in 2031 | US$ 6 Bn |
| CAGR | 8.9% |
Secondary research also included Internet sources, statistical data from government agencies, websites, and trade associations. Analysts employed a combination of top-down and bottom-up approaches to study various attributes of the global thermal interface materials market.
The report includes an elaborate executive summary, along with a snapshot of the growth behavior of various segments included in the scope of the study. Moreover, the report throws light on the changing competitive dynamics in the global thermal interface materials market. These serve as valuable tools for existing market players as well as for entities interested in participating in the global thermal interface materials market.
The report delves into the competitive landscape of the global thermal interface materials market. Key players operating in the global thermal interface materials market have been identified and each one of these has been profiled in terms of various attributes. Company overview, financial standings, recent developments, and SWOT are the attributes of players in the global thermal interface materials market profiled in this report.
Key Questions Answered in Global thermal interface materials Market Report:
- What is the sales/revenue generated by thermal interface materials across all regions during the forecast period?
- What are the opportunities in the global thermal interface materials market?
- What are the major drivers, restraints, opportunities, and threats in the market?
- Which regional market is set to expand at the fastest CAGR during the forecast period?
- Which segment is expected to generate the highest revenue globally in 2031?
- Which segment is projected to expand at the highest CAGR during the forecast period?
- What are the market positions of different companies operating in the global market?
Thermal Interface Materials Market - Research Objectives and Research Approach
The comprehensive report on the global thermal interface materials market begins with an overview, followed by the scope and objectives of the study. The report provides detailed explanation of the objectives behind this study and key vendors and distributors operating in the market and regulatory scenario for approval of products.
For reading comprehensibility, the report has been compiled in a chapter-wise layout, with each section divided into smaller ones. The report comprises an exhaustive collection of graphs and tables that are appropriately interspersed. Pictorial representation of actual and projected values of key segments is visually appealing to readers. This also allows comparison of the market shares of key segments in the past and at the end of the forecast period.
The report analyzes the global thermal interface materials market in terms of product, end-user, and region. Key segments under each criterion have been studied at length, and the market share for each of these at the end of 2031 has been provided. Such valuable insights enable market stakeholders in making informed business decisions for investment in the global thermal interface materials market.
Table of Contents
1. Executive Summary
- 1.1. Global Market Outlook
- 1.2. Demand Side Trends
- 1.3. Key Facts and Figures
- 1.4. Trends Impacting Market
- 1.5. TMR's Growth Opportunity Wheel
2. Market Overview
- 2.1. Market Segmentation
- 2.2. Key Developments
- 2.3. Market Definitions
- 2.4. Key Market Trends
- 2.5. Market Dynamics
- 2.5.1. Drivers
- 2.5.2. Restraints
- 2.5.3. Opportunities
- 2.6. Global Thermal Interface Materials Market Analysis and Forecast, 2023-2031
- 2.6.1. Global Thermal Interface Materials Market Revenue (US$ Mn)
- 2.7. Porter's Five Forces Analysis
- 2.8. Regulatory Landscape
- 2.9. Value Chain Analysis
- 2.9.1. List of Raw Material Suppliers
- 2.9.2. List of Key Manufacturers
- 2.9.3. List of Key Suppliers
- 2.9.4. List of Potential Customers
- 2.10. Product Specification Analysis
- 2.11. Production Overview
- 2.12. Cost Structure Analysis
3. COVID-19 Impact Analysis
- 3.1. Impact on Supply Chain of Thermal Interface Materials
- 3.2. Impact on Demand for Thermal Interface Materials- Pre & Post Crisis
4. Impact of Current Geopolitical Scenario on Market
5. Price Trend Analysis and Forecast (US$), 2023-2031
- 5.1. Price Trend Analysis by Material
- 5.2. Price Trend Analysis by Region
6. Global Thermal Interface Materials Market Analysis and Forecast, by Material, 2023-2031
- 6.1. Introduction and Definitions
- 6.2. Global Thermal Interface Materials Market Value (US$ Mn) Forecast, by Material, 2023-2031
- 6.2.1. Adhesives & Greases
- 6.2.2. Thermal Tapes & Films
- 6.2.3. Gap Fillers
- 6.2.4. Thermal Phase Change Materials
- 6.2.5. Metal-based Thermal Interface Materials
- 6.2.6. Others
- 6.3. Global Thermal Interface Materials Market Attractiveness, by Material
7. Global Thermal Interface Materials Market Analysis and Forecast, by Application, 2023-2031
- 7.1. Introduction and Definitions
- 7.2. Global Thermal Interface Materials Market Value (US$ Mn) Forecast, by Application, 2023-2031
- 7.2.1. Computers
- 7.2.2. Automotive Electronics
- 7.2.3. Industrial Machinery
- 7.2.4. Telecommunications
- 7.2.5. Consumer Durables
- 7.2.6. Medical Devices
- 7.2.7. Others
- 7.3. Global Thermal Interface Materials Market Attractiveness, by Application
8. Global Thermal Interface Materials Market Analysis and Forecast, by Region, 2023-2031
- 8.1. Key Findings
- 8.2. Global Thermal Interface Materials Market Value (US$ Mn) Forecast, by Region, 2023-2031
- 8.2.1. North America
- 8.2.2. Europe
- 8.2.3. Asia Pacific
- 8.2.4. Latin America
- 8.2.5. Middle East & Africa
- 8.3. Global Thermal Interface Materials Market Attractiveness, by Region
9. North America Thermal Interface Materials Market Analysis and Forecast, 2023-2031
- 9.1. Key Findings
- 9.2. North America Thermal Interface Materials Market Value (US$ Mn) Forecast, by Material, 2023-2031
- 9.3. North America Thermal Interface Materials Market Value (US$ Mn) Forecast, by Application, 2023-2031
- 9.4. North America Thermal Interface Materials Market Value (US$ Mn) Forecast, by Country, 2023-2031
- 9.4.1. U.S. Thermal Interface Materials Market Value (US$ Mn) Forecast, by Material, 2023-2031
- 9.4.2. U.S. Thermal Interface Materials Market Value (US$ Mn) Forecast, by Application, 2023-2031
- 9.4.3. Canada Thermal Interface Materials Market Value (US$ Mn) Forecast, by Material, 2023-2031
- 9.4.4. Canada Thermal Interface Materials Market Value (US$ Mn) Forecast, by Application, 2023-2031
- 9.5. North America Thermal Interface Materials Market Attractiveness Analysis
10. Europe Thermal Interface Materials Market Analysis and Forecast, 2023-2031
- 10.1. Key Findings
- 10.2. Europe Thermal Interface Materials Market Value (US$ Mn) Forecast, by Material, 2023-2031
- 10.3. Europe Thermal Interface Materials Market Value (US$ Mn) Forecast, by Application, 2023-2031
- 10.4. Europe Thermal Interface Materials Market Value (US$ Mn) Forecast, by Country and Sub-region, 2022-2031
- 10.4.1. Germany Thermal Interface Materials Market Value (US$ Mn) Forecast, by Type, 2023-2031
- 10.4.2. Germany Thermal Interface Materials Market Value (US$ Mn) Forecast, by Application, 2023-2031
- 10.4.3. France Thermal Interface Materials Market Value (US$ Mn) Forecast, by Material, 2023-2031
- 10.4.4. France. Thermal Interface Materials Market Value (US$ Mn) Forecast, by Application, 2023-2031
- 10.4.5. U.K. Thermal Interface Materials Market Value (US$ Mn) Forecast, by Material, 2023-2031
- 10.4.6. U.K. Thermal Interface Materials Market Value (US$ Mn) Forecast, by Application, 2023-2031
- 10.4.7. Italy Thermal Interface Materials Market Value (US$ Mn) Forecast, by Material, 2023-2031
- 10.4.8. Italy Thermal Interface Materials Market Value (US$ Mn) Forecast, by Application, 2023-2031
- 10.4.9. Russia & CIS Thermal Interface Materials Market Value (US$ Mn) Forecast, by Material, 2023-2031
- 10.4.10. Russia & CIS Thermal Interface Materials Market Value (US$ Mn) Forecast, by Application, 2023-2031
- 10.4.11. Rest of Europe Thermal Interface Materials Market Value (US$ Mn) Forecast, by Material, 2023-2031
- 10.4.12. Rest of Europe Thermal Interface Materials Market Value (US$ Mn) Forecast, by Application, 2023-2031
- 10.5. Europe Thermal Interface Materials Market Attractiveness Analysis
11. Asia Pacific Thermal Interface Materials Market Analysis and Forecast, 2023-2031
- 11.1. Key Findings
- 11.2. Asia Pacific Thermal Interface Materials Market Value (US$ Mn) Forecast, by Material
- 11.3. Asia Pacific Thermal Interface Materials Market Value (US$ Mn) Forecast, by Application, 2023-2031
- 11.4. Asia Pacific Thermal Interface Materials Market Value (US$ Mn) Forecast, by Country and Sub-region, 2022-2031
- 11.4.1. China Thermal Interface Materials Market Value (US$ Mn) Forecast, by Material, 2023-2031
- 11.4.2. China Thermal Interface Materials Market Value (US$ Mn) Forecast, by Application, 2023-2031
- 11.4.3. Japan Thermal Interface Materials Market Value (US$ Mn) Forecast, by Material, 2023-2031
- 11.4.4. Japan Thermal Interface Materials Market Value (US$ Mn) Forecast, by Application, 2023-2031
- 11.4.5. India Thermal Interface Materials Market Value (US$ Mn) Forecast, by Material, 2023-2031
- 11.4.6. India Thermal Interface Materials Market Value (US$ Mn) Forecast, by Application, 2023-2031
- 11.4.7. ASEAN Thermal Interface Materials Market Value (US$ Mn) Forecast, by Material, 2023-2031
- 11.4.8. ASEAN Thermal Interface Materials Market Value (US$ Mn) Forecast, by Application, 2023-2031
- 11.4.9. Rest of Asia Pacific Thermal Interface Materials Market Value (US$ Mn) Forecast, by Material, 2023-2031
- 11.4.10. Rest of Asia Pacific Thermal Interface Materials Market Value (US$ Mn) Forecast, by Application, 2023-2031
- 11.5. Asia Pacific Thermal Interface Materials Market Attractiveness Analysis
12. Latin America Thermal Interface Materials Market Analysis and Forecast, 2023-2031
- 12.1. Key Findings
- 12.2. Latin America Thermal Interface Materials Market Value (US$ Mn) Forecast, by Material, 2023-2031
- 12.3. Latin America Thermal Interface Materials Market Value (US$ Mn) Forecast, by Application, 2023-2031
- 12.4. Latin America Thermal Interface Materials Market Value (US$ Mn) Forecast, by Country and Sub-region, 2022-2031
- 12.4.1. Brazil Thermal Interface Materials Market Value (US$ Mn) Forecast, by Material, 2023-2031
- 12.4.2. Brazil Thermal Interface Materials Market Value (US$ Mn) Forecast, by Application, 2023-2031
- 12.4.3. Mexico Thermal Interface Materials Market Value (US$ Mn) Forecast, by Material, 2023-2031
- 12.4.4. Mexico Thermal Interface Materials Market Value (US$ Mn) Forecast, by Application, 2023-2031
- 12.4.5. Rest of Latin America Thermal Interface Materials Market Value (US$ Mn) Forecast, by Material, 2023-2031
- 12.4.6. Rest of Latin America Thermal Interface Materials Market Value (US$ Mn) Forecast, by Application, 2023-2031
- 12.5. Latin America Thermal Interface Materials Market Attractiveness Analysis
13. Middle East & Africa Thermal Interface Materials Market Analysis and Forecast, 2023-2031
- 13.1. Key Findings
- 13.2. Middle East & Africa Thermal Interface Materials Market Value (US$ Mn) Forecast, by Material, 2023-2031
- 13.3. Middle East & Africa Thermal Interface Materials Market Value (US$ Mn) Forecast, by Application, 2023-2031
- 13.4. Middle East & Africa Thermal Interface Materials Market Value (US$ Mn) Forecast, by Country and Sub-region, 2022-2031
- 13.4.1. GCC Thermal Interface Materials Market Value (US$ Mn) Forecast, by Material, 2023-2031
- 13.4.2. GCC Thermal Interface Materials Market Value (US$ Mn) Forecast, by Application, 2023-2031
- 13.4.3. South Africa Thermal Interface Materials Market Value (US$ Mn) Forecast, by Material, 2023-2031
- 13.4.4. South Africa Thermal Interface Materials Market Value (US$ Mn) Forecast, by Application, 2023-2031
- 13.4.5. Rest of Middle East & Africa Thermal Interface Materials Market Value (US$ Mn) Forecast, by Material, 2023-2031
- 13.4.6. Rest of Middle East & Africa Thermal Interface Materials Market Value (US$ Mn) Forecast, by Application, 2023-2031
- 13.5. Middle East & Africa Thermal Interface Materials Market Attractiveness Analysis
14. Competition Landscape
- 14.1. Global Thermal Interface Materials Market Company Share Analysis, 2022
- 14.2. Company Profiles (Details - Overview, Financials, Recent Developments, and Strategy)
- 14.2.1. Semikron Danfoss
- 14.2.1.1. Company Revenue
- 14.2.1.2. Business Overview
- 14.2.1.3. Product Segments
- 14.2.1.4. Geographic Footprint
- 14.2.1.5. Production Capacity/Plant Details, etc. (*As Applicable)
- 14.2.1.6. Strategic Partnership, Capacity Expansion, New Product Innovation, etc.
- 14.2.2. Wakefield Thermal, Inc.
- 14.2.2.1. Company Revenue
- 14.2.2.2. Business Overview
- 14.2.2.3. Product Segments
- 14.2.2.4. Geographic Footprint
- 14.2.2.5. Production Capacity/Plant Details, etc. (*As Applicable)
- 14.2.2.6. Strategic Partnership, Capacity Expansion, New Product Innovation, etc.
- 14.2.3. DK Thermal (HK) Limited
- 14.2.3.1. Company Revenue
- 14.2.3.2. Business Overview
- 14.2.3.3. Product Segments
- 14.2.3.4. Geographic Footprint
- 14.2.3.5. Production Capacity/Plant Details, etc. (*As Applicable)
- 14.2.3.6. Strategic Partnership, Capacity Expansion, New Product Innovation, etc.
- 14.2.4. Indium Corporation
- 14.2.4.1. Company Revenue
- 14.2.4.2. Business Overview
- 14.2.4.3. Product Segments
- 14.2.4.4. Geographic Footprint
- 14.2.4.5. Production Capacity/Plant Details, etc. (*As Applicable)
- 14.2.4.6. Strategic Partnership, Capacity Expansion, New Product Innovation, etc.
- 14.2.5. Momentive Performance Materials
- 14.2.5.1. Company Revenue
- 14.2.5.2. Business Overview
- 14.2.5.3. Product Segments
- 14.2.5.4. Geographic Footprint
- 14.2.5.5. Production Capacity/Plant Details, etc. (*As Applicable)
- 14.2.5.6. Strategic Partnership, Capacity Expansion, New Product Innovation, etc.
- 14.2.6. Parker Hannifin Corp.
- 14.2.6.1. Company Revenue
- 14.2.6.2. Business Overview
- 14.2.6.3. Product Segments
- 14.2.6.4. Geographic Footprint
- 14.2.6.5. Production Capacity/Plant Details, etc. (*As Applicable)
- 14.2.6.6. Strategic Partnership, Capacity Expansion, New Product Innovation, etc.
- 14.2.7. Honeywell International Inc.
- 14.2.7.1. Company Revenue
- 14.2.7.2. Business Overview
- 14.2.7.3. Product Segments
- 14.2.7.4. Geographic Footprint
- 14.2.7.5. Production Capacity/Plant Details, etc. (*As Applicable)
- 14.2.7.6. Strategic Partnership, Capacity Expansion, New Product Innovation, etc.
- 14.2.8. 3M
- 14.2.8.1. Company Revenue
- 14.2.8.2. Business Overview
- 14.2.8.3. Product Segments
- 14.2.8.4. Geographic Footprint
- 14.2.8.5. Production Capacity/Plant Details, etc. (*As Applicable)
- 14.2.8.6. Strategic Partnership, Capacity Expansion, New Product Innovation, etc.
- 14.2.9. Henkel AG & Company KGaA
- 14.2.9.1. Company Revenue
- 14.2.9.2. Business Overview
- 14.2.9.3. Product Segments
- 14.2.9.4. Geographic Footprint
- 14.2.9.5. Production Capacity/Plant Details, etc. (*As Applicable)
- 14.2.9.6. Strategic Partnership, Capacity Expansion, New Product Innovation, etc.
- 14.2.10. Dow
- 14.2.10.1. Company Revenue
- 14.2.10.2. Business Overview
- 14.2.10.3. Product Segments
- 14.2.10.4. Geographic Footprint
- 14.2.10.5. Production Capacity/Plant Details, etc. (*As Applicable)
- 14.2.10.6. Strategic Partnership, Capacity Expansion, New Product Innovation, etc.
- 14.2.1. Semikron Danfoss

