|
|
市場調査レポート
商品コード
1597178
欧州の返品管理ソフトウェア市場:2031年までの予測 - 地域別分析 - コンポーネント別、展開別、企業規模別Europe Returns Management Software Market Forecast to 2031 - Regional Analysis - by Component (Software and Services), Deployment (Cloud and On Premises), and Enterprise Size (Large Enterprises and SMEs) |
||||||

|
|||||||
|
|||||||

| 欧州の返品管理ソフトウェア市場:2031年までの予測 - 地域別分析 - コンポーネント別、展開別、企業規模別 |
|
出版日: 2024年10月17日
発行: The Insight Partners
ページ情報: 英文 87 Pages
納期: 即納可能
|

全表示
- 概要
- 図表
- 目次
欧州の返品管理ソフトウェア市場は、2023年に3億6,516万米ドルと評価され、2031年には6億8,305万米ドルに達すると予測され、2023年から2031年までのCAGRは8.1%と推定されます。
eコマース分野の成長が欧州返品管理ソフトウェア市場を牽引
eコマースの世界の急増は、COVID-19の大流行時に、当初は状況の必要性への対応として出現しました。実店舗の閉鎖に伴い、人々は屋内待機を余儀なくされたため、オンラインショッピングが現実的な選択肢となった。モルガン・スタンレーによると、世界の小売売上高に占めるeコマースの割合は、2019年の15%から2021年には21%に増加しました。現在、モルガン・スタンレーによれば、eコマースが総売上高の約22%を占めると推定されています。eコマース売上高の増加は、消費者が特定のカテゴリーで最大30%の製品を返品するため、業界のサービスに対する需要を急増させています。このことは、効果的な返品管理プロセスの重要性と、企業が顧客の返品に効率的に対応する必要性を浮き彫りにしています。
返品管理ソフトウェアは、拡大するeコマース部門をサポートする上で重要な役割を果たしています。オンライン販売量の増加は、最終的に返品件数を増加させます。こうした返品を効率的に管理することは、企業がコストを削減し、業務効率を高め、顧客満足度を維持する上で極めて重要です。
返品管理ソフトウェアを導入することで、返品をリアルタイムで追跡・監視できるようになり、企業は返品プロセスを完全に把握できるようになります。さらに、返品管理ソフトウェアは、製品の品質、返品パターン、顧客フィードバックに関する洞察を提供することで、在庫管理を最適化します。このような情報により、企業は製品の改善、サプライヤーとの関係、顧客サービスの強化に関して、十分な情報に基づいた意思決定を行うことができます。このように、eコマース分野の成長が返品管理ソフトウェア市場を牽引しています。
欧州の返品管理ソフトウェア市場概要
欧州の返品管理ソフトウェア市場は、ビジネスシーンにおける重要性の高まりを裏付けるいくつかの重要な要因に後押しされ、力強い成長を遂げています。主な要因の1つは、欧州全域でeコマース活動が活発化していることです。オンライン小売業が急成長する中、企業は顧客満足度を高め、ブランドロイヤルティを維持するために、効率的な返品処理の必要性を認識しています。さらに、欧州のeコマース部門は、COVID-19のパンデミック予防措置の縮小によりeコマース売上が減少している国がいくつか報告されているにもかかわらず、近年B2C売上で著しい伸びを示しています。さらに、東欧のB2C eコマース売上は、西欧の多くの国々よりも速い成長率を示しています。European E-commerce Report 2022によると、西欧が総売上高の63%を占めているのに対し、東欧は2%である(2021年時点)。環境維持に対する意識の高まりも市場拡大に寄与しています。英国では、オンラインショッピング利用者の中に頻繁に返品する人がかなり多く、その71%がさまざまな頻度で返品を行っています。このような返品率の高い動向は、eコマース・ビジネスにとって、従来の実店舗とは異なる課題となっています。欧州の企業は、廃棄物を最小限に抑え、リバース・ロジスティクスを最適化する返品管理ソリューションを導入しており、環境に優しいビジネス慣行を重視する傾向が強まっています。さらに、業務効率と費用対効果の絶え間ない追求により、企業は洗練された返品管理ツールへの投資を促しています。これらのソリューションは、業務上のオーバーヘッドを削減するだけでなく、サプライチェーン全体の回復力を高め、リバース・ロジスティクスがもたらす課題に対処します。
欧州返品管理ソフトウェア市場の収益と2031年までの予測(金額)
欧州返品管理ソフトウェア市場セグメンテーション
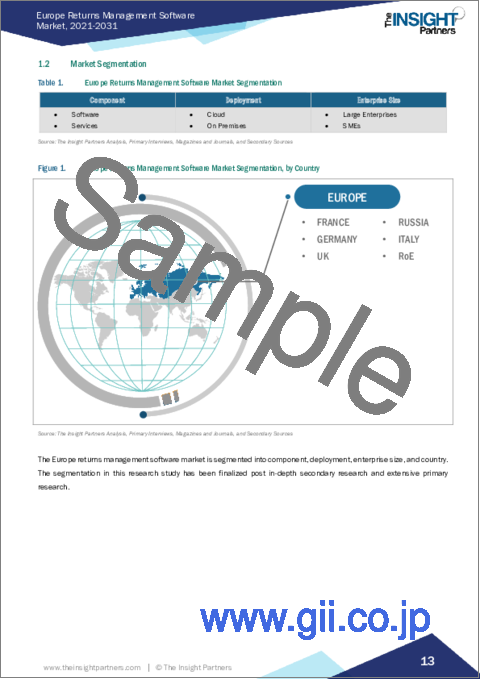
欧州の返品管理ソフトウェア市場は、コンポーネント、展開、企業規模、国に分類されます。
コンポーネントに基づいて、欧州返品管理ソフトウェア市場はソフトウェアとサービスに二分されます。2023年の市場シェアは、ソフトウェア分野が大きいです。
展開に関しては、欧州の返品管理ソフトウェア市場はクラウドとオンプレミスに区分されます。2023年の市場シェアはクラウドセグメントが大きいです。
企業規模に基づくと、欧州返品管理ソフトウェア市場は大企業と中小企業に二分されます。2023年の市場シェアは大企業の方が大きいです。
国別では、欧州返品管理ソフトウェア市場は、英国、ドイツ、フランス、イタリア、ロシア、その他欧州に区分されます。2023年の欧州返品管理ソフトウェア市場シェアは、英国が独占しました。
ParcelLab;ReverseLogix;nShift;United Parcel Service of America, Inc;SAP SE;AfterShip;Shipcloud GmbHなどは、欧州返品管理ソフトウェア市場で事業を展開している主要企業です。
目次
第1章 イントロダクション
第2章 エグゼクティブサマリー
- 主要洞察
- 市場の魅力
第3章 調査手法
- 調査範囲
- 調査範囲
- 2次調査
- 1次調査
- 仮説の策定
- 基礎数値の作成
- データの三角測量
- 国レベルのデータ
- 市場分析で考慮した主な情報源と要因
- 主な二次情報源
- 考慮した主な要因
- 市場分析で考慮した主要企業
第4章 欧州返品管理ソフトウェア市場情勢
- エコシステム分析
- ソリューションプロバイダー
- エンドユーザー
- バリューチェーンのベンダー一覧
- 重要考察
- フロントエンドとバックエンドの比較
- ユーザー要件分析- フロントエンドの現在の機能と必要な機能の比較
- ユーザー要件分析- バックエンドの現在の機能と必要な機能の比較
- フロントエンドとバックエンドの比較
第5章 欧州返品管理ソフトウェア市場:主要市場力学
- 市場促進要因
- 返品率の増加
- eコマース分野の成長
- 顧客満足に対するニーズの高まり
- 市場抑制要因
- 高い導入コスト
- データ・セキュリティへの懸念
- 市場機会
- 持続可能性への取り組みの高まり
- 技術の進歩
- 今後の動向
- ブロックチェーン技術の統合
- 促進要因と抑制要因の影響
第6章 返品管理ソフトウェア市場:欧州分析
- 返品管理ソフトウェア市場収益、2021-2031年
- 返品管理ソフトウェア市場予測分析
第7章 欧州返品管理ソフトウェア市場分析:コンポーネント別
- ソフトウェア
- サービス
第8章 欧州返品管理ソフトウェア市場分析:展開別
- クラウド
- オンプレミス
第9章 欧州返品管理ソフトウェア市場分析-企業規模別
- 大企業
- 中小企業
第10章 欧州返品管理ソフトウェア市場:国別分析
- 欧州市場
- 欧州
- 英国
- ドイツ
- フランス
- イタリア
- ロシア
- その他欧州
- 欧州
第11章 競合情勢
- 各社のポジショニングと集中度
- 主要企業によるヒートマップ分析
- 企業シェア分析
- 製品ベンチマーク
第12章 業界情勢
- 市場イニシアティブ
- 新製品開発
- 合併と買収
第13章 企業プロファイル
- parcelLab
- ReverseLogix
- nShift
- United Parcel Service of America, Inc.
- SAP SE
- Shipcloud GmbH
- AfterShip
第14章 付録
List Of Tables
- Table 1. Europe Returns Management Software Market Segmentation
- Table 2. List of Vendors
- Table 3. Returns Management Software Market - Revenue and Forecast to 2031 (US$ Million)
- Table 4. Returns Management Software Market - Revenue and Forecast to 2031 (US$ Million) - by Component
- Table 5. Returns Management Software Market - Revenue and Forecast to 2031 (US$ Million) - by Deployment
- Table 6. Returns Management Software Market - Revenue and Forecast to 2031 (US$ Million) - by Enterprise Size
- Table 7. Europe: Returns Management Software Market - Revenue and Forecast to 2031(US$ Million) - by Country
- Table 8. United Kingdom: Returns Management Software Market - Revenue and Forecast to 2031(US$ Million) - by Component
- Table 9. United Kingdom: Returns Management Software Market - Revenue and Forecast to 2031(US$ Million) - by Deployment
- Table 10. United Kingdom: Returns Management Software Market - Revenue and Forecast to 2031(US$ Million) - by Enterprise Size
- Table 11. Germany: Returns Management Software Market - Revenue and Forecast to 2031(US$ Million) - by Component
- Table 12. Germany: Returns Management Software Market - Revenue and Forecast to 2031(US$ Million) - by Deployment
- Table 13. Germany: Returns Management Software Market - Revenue and Forecast to 2031(US$ Million) - by Enterprise Size
- Table 14. France: Returns Management Software Market - Revenue and Forecast to 2031(US$ Million) - by Component
- Table 15. France: Returns Management Software Market - Revenue and Forecast to 2031(US$ Million) - by Deployment
- Table 16. France: Returns Management Software Market - Revenue and Forecast to 2031(US$ Million) - by Enterprise Size
- Table 17. Italy: Returns Management Software Market - Revenue and Forecast to 2031(US$ Million) - by Component
- Table 18. Italy: Returns Management Software Market - Revenue and Forecast to 2031(US$ Million) - by Deployment
- Table 19. Italy: Returns Management Software Market - Revenue and Forecast to 2031(US$ Million) - by Enterprise Size
- Table 20. Russia: Returns Management Software Market - Revenue and Forecast to 2031(US$ Million) - by Component
- Table 21. Russia: Returns Management Software Market - Revenue and Forecast to 2031(US$ Million) - by Deployment
- Table 22. Russia: Returns Management Software Market - Revenue and Forecast to 2031(US$ Million) - by Enterprise Size
- Table 23. Rest of Europe: Returns Management Software Market - Revenue and Forecast to 2031(US$ Million) - by Component
- Table 24. Rest of Europe: Returns Management Software Market - Revenue and Forecast to 2031(US$ Million) - by Deployment
- Table 25. Rest of Europe: Returns Management Software Market - Revenue and Forecast to 2031(US$ Million) - by Enterprise Size
- Table 26. Heat Map Analysis by Key Players
- Table 27. List of Abbreviation
List Of Figures
- Figure 1. Europe Returns Management Software Market Segmentation, by Country
- Figure 2. Returns Management Software Market - Key Market Dynamics
- Figure 3. Impact Analysis of Drivers and Restraints
- Figure 4. Returns Management Software Market Revenue (US$ Million), 2021-2031
- Figure 5. Returns Management Software Market Share (%) - by Component (2023 and 2031)
- Figure 6. Software: Returns Management Software Market - Revenue and Forecast to 2031 (US$ Million)
- Figure 7. Services: Returns Management Software Market - Revenue and Forecast to 2031 (US$ Million)
- Figure 8. Returns Management Software Market Share (%) - by Deployment (2023 and 2031)
- Figure 9. Cloud: Returns Management Software Market - Revenue and Forecast to 2031 (US$ Million)
- Figure 10. On Premises: Returns Management Software Market - Revenue and Forecast to 2031 (US$ Million)
- Figure 11. Returns Management Software Market Share (%) - by Enterprise Size (2023 and 2031)
- Figure 12. Large Enterprises: Returns Management Software Market - Revenue and Forecast to 2031 (US$ Million)
- Figure 13. SMEs: Returns Management Software Market - Revenue and Forecast to 2031 (US$ Million)
- Figure 14. Europe Returns Management Software Market, by Key Countries - Revenue (2023) (US$ Million)
- Figure 15. Europe: Returns Management Software Market Breakdown, by Key Countries, 2023 and 2031 (%)
- Figure 16. United Kingdom: Returns Management Software Market - Revenue and Forecast to 2031(US$ Million)
- Figure 17. Germany: Returns Management Software Market - Revenue and Forecast to 2031(US$ Million)
- Figure 18. France: Returns Management Software Market - Revenue and Forecast to 2031(US$ Million)
- Figure 19. Italy: Returns Management Software Market - Revenue and Forecast to 2031(US$ Million)
- Figure 20. Russia: Returns Management Software Market - Revenue and Forecast to 2031(US$ Million)
- Figure 21. Rest of Europe: Returns Management Software Market - Revenue and Forecast to 2031(US$ Million)
- Figure 22. Company Positioning & Concentration
The Europe returns management software market was valued at US$ 365.16 million in 2023 and is projected to reach US$ 683.05 million by 2031; it is estimated to register a CAGR of 8.1% from 2023 to 2031.
Growth of E-commerce Sector Drives Europe Returns Management Software Market
The surge in global e-commerce during the COVID-19 pandemic initially emerged as a response to the necessity of the situation. With the closure of physical retail stores, online shopping became a practical alternative as people were forced to stay indoors. According to Morgan Stanley, the share of global retail sales attributed to e-commerce increased from 15% in 2019 to 21% in 2021. Presently, it is estimated that e-commerce accounts for approximately 22% of total sales as per Morgan Stanley. The rise in e-commerce sales has surged the demand for industry services as consumers return upto 30% of the products in certain categories. This highlights the importance of effective return management processes and the need for businesses to address customer returns efficiently.
Returns management software plays a crucial role in supporting the expanding e-commerce sector. The increasing online sales volumes eventually increase the number of product returns. Efficiently managing these returns is crucial for businesses to reduce costs, enhance operational efficiency, and maintain customer satisfaction.
Implementation of returns management software enables real-time tracking and monitoring of returns, allowing businesses to have complete visibility into the process. Additionally, returns management software optimizes inventory management by providing insights into product quality, return patterns, and customer feedback. This information aids businesses to make informed decisions regarding product improvements, supplier relationships, and customer service enhancements. Thus, the growing e-commerce sector drives the returns management software market.
Europe Returns Management Software Market Overview
The returns management software market in Europe is experiencing robust growth, propelled by several key factors that underscore its increasing significance in the business landscape. One of the primary drivers is the escalating e-commerce activity across the continent. With a burgeoning online retail sector, businesses are recognizing the critical need for efficient returns processes to enhance customer satisfaction and maintain brand loyalty. Furthermore, the e-commerce sector in Europe has shown significant growth in B2C turnover in recent years despite a few nations reporting fewer e-commerce sales due to reduced COVID-19 pandemic precautions. Furthermore, Eastern Europe has had faster growth rates in B2C e-commerce sales than many countries in Western Europe. According to the European E-commerce Report 2022, Western Europe accounted for 63% of total revenue, while Eastern Europe accounted for 2% (as of 2021). The rising awareness of environmental sustainability also contributes to the market's expansion. In the UK, there is a significant number of frequent returners among online shoppers, with 71% of them engaging in the practice at varying frequencies. This trend of high return rates poses distinctive challenges for e-commerce businesses compared to traditional brick-and-mortar stores. Companies in Europe are adopting returns management solutions to minimize waste and optimize reverse logistics, aligning with the growing emphasis on eco-friendly business practices. Furthermore, the relentless pursuit of operational efficiency and cost-effectiveness is prompting businesses to invest in sophisticated returns management tools. These solutions not only reduce operational overheads but also enhance overall supply chain resilience, addressing the challenges posed by reverse logistics.
Europe Returns Management Software Market Revenue and Forecast to 2031 (US$ Million)
Europe Returns Management Software Market Segmentation
The Europe returns management software market is categorized into component, deployment, enterprise size, and country.
Based on component, the Europe returns management software market is bifurcated into software and services. The software segment held a larger market share in 2023.
In terms of deployment, the Europe returns management software market is segmented into cloud and on premises. The cloud segment held a larger market share in 2023.
Based on enterprise size, the Europe returns management software market is bifurcated into large enterprises and SMEs. The large enterprise segment held a larger market share in 2023.
By country, the Europe returns management software market is segmented into the UK, Germany, France, Italy, Russia, and the Rest of Europe. The UK dominated the Europe returns management software market share in 2023.
ParcelLab; ReverseLogix; nShift; United Parcel Service of America, Inc; SAP SE; AfterShip; and Shipcloud GmbH are some of the leading companies operating in the Europe returns management software market.
Table Of Contents
1. Introduction
- 1.1 The Insight Partners Research Report Guidance
- 1.2 Market Segmentation
2. Executive Summary
- 2.1 Key Insights
- 2.2 Market Attractiveness
3. Research Methodology
- 3.1 Scope
- 3.2 Coverage
- 3.3 Secondary Research
- 3.4 Primary Research
- 3.4.1 Hypothesis Formulation:
- 3.4.2 Developing Base Number:
- 3.4.3 Data Triangulation:
- 3.4.4 Country Level Data:
- 3.5 Key Sources and Factors Considered During the Market Analysis
- 3.5.1 Key Secondary Sources:
- 3.5.2 Key Factors Considered:
- 3.6 Key Companies Considered During Market Analysis
4. Europe Returns Management Software Market Landscape
- 4.1 Overview
- 4.2 Ecosystem Analysis
- 4.2.1 Solution Providers:
- 4.2.2 End-Users:
- 4.2.3 List of Vendors in the Value Chain
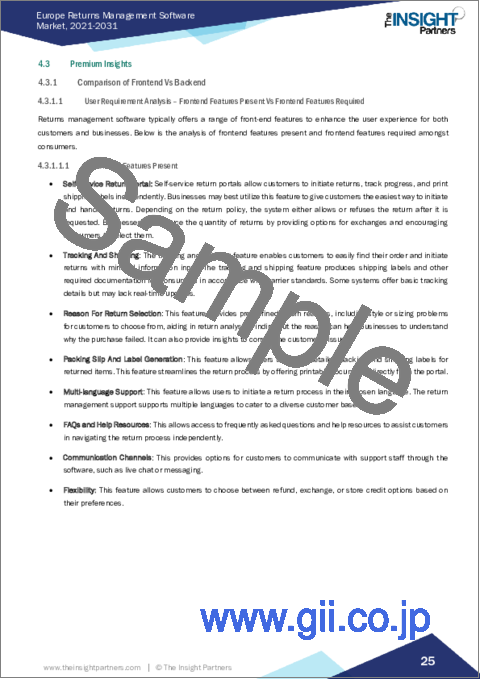
- 4.3 Premium Insights
- 4.3.1 Comparison of Frontend Vs Backend
- 4.3.1.1 User Requirement Analysis - Frontend Features Present Vs Frontend Features Required
- 4.3.1.1.1 Frontend Features Present
- 4.3.1.1.2 Frontend Features Required
- 4.3.1.2 User Requirement Analysis - Backend Features Present Vs Backend Features Required
- 4.3.1.2.1 Backend Features Present
- 4.3.1.2.2 Backend Features Required
- 4.3.1.1 User Requirement Analysis - Frontend Features Present Vs Frontend Features Required
- 4.3.1 Comparison of Frontend Vs Backend
5. Europe Returns Management Software Market - Key Market Dynamics
- 5.1 Market Drivers
- 5.1.1 Increase in Return Rates
- 5.1.2 Growth of E-commerce Sector
- 5.1.3 Rising Need for Customer Satisfaction
- 5.2 Market Restraints
- 5.2.1 High Implementation Costs
- 5.2.2 Data Security Concerns
- 5.3 Market Opportunities
- 5.3.1 Rising Sustainability Initiatives
- 5.3.2 Technological Advancements
- 5.4 Future Trends
- 5.4.1 Integration of Blockchain Technology
- 5.5 Impact of Drivers and Restraints:
6. Returns Management Software Market - Europe Analysis
- 6.1 Returns Management Software Market Revenue (US$ Million), 2021-2031
- 6.2 Returns Management Software Market Forecast Analysis
7. Europe Returns Management Software Market Analysis - by Component
- 7.1 Software
- 7.1.1 Overview
- 7.1.2 Software: Returns Management Software Market - Revenue and Forecast to 2031 (US$ Million)
- 7.2 Services
- 7.2.1 Overview
- 7.2.2 Services: Returns Management Software Market - Revenue and Forecast to 2031 (US$ Million)
8. Europe Returns Management Software Market Analysis - by Deployment
- 8.1 Cloud
- 8.1.1 Overview
- 8.1.2 Cloud: Returns Management Software Market - Revenue and Forecast to 2031 (US$ Million)
- 8.2 On Premises
- 8.2.1 Overview
- 8.2.2 On Premises: Returns Management Software Market - Revenue and Forecast to 2031 (US$ Million)
9. Europe Returns Management Software Market Analysis - by Enterprise Size
- 9.1 Large Enterprises
- 9.1.1 Overview
- 9.1.2 Large Enterprises: Returns Management Software Market - Revenue and Forecast to 2031 (US$ Million)
- 9.2 SMEs
- 9.2.1 Overview
- 9.2.2 SMEs: Returns Management Software Market - Revenue and Forecast to 2031 (US$ Million)
10. Europe Returns Management Software Market - Country Analysis
- 10.1 Europe Market
- 10.1.1 Europe: Returns Management Software Market - Revenue and Forecast Analysis - by Country
- 10.1.1.1 Europe: Returns Management Software Market - Revenue and Forecast Analysis - by Country
- 10.1.1.2 United Kingdom: Returns Management Software Market - Revenue and Forecast to 2031 (US$ Million)
- 10.1.1.2.1 United Kingdom: Returns Management Software Market Breakdown, by Component
- 10.1.1.2.2 United Kingdom: Returns Management Software Market Breakdown, by Deployment
- 10.1.1.2.3 United Kingdom: Returns Management Software Market Breakdown, by Enterprise Size
- 10.1.1.3 Germany: Returns Management Software Market - Revenue and Forecast to 2031 (US$ Million)
- 10.1.1.3.1 Germany: Returns Management Software Market Breakdown, by Component
- 10.1.1.3.2 Germany: Returns Management Software Market Breakdown, by Deployment
- 10.1.1.3.3 Germany: Returns Management Software Market Breakdown, by Enterprise Size
- 10.1.1.4 France: Returns Management Software Market - Revenue and Forecast to 2031 (US$ Million)
- 10.1.1.4.1 France: Returns Management Software Market Breakdown, by Component
- 10.1.1.4.2 France: Returns Management Software Market Breakdown, by Deployment
- 10.1.1.4.3 France: Returns Management Software Market Breakdown, by Enterprise Size
- 10.1.1.5 Italy: Returns Management Software Market - Revenue and Forecast to 2031 (US$ Million)
- 10.1.1.5.1 Italy: Returns Management Software Market Breakdown, by Component
- 10.1.1.5.2 Italy: Returns Management Software Market Breakdown, by Deployment
- 10.1.1.5.3 Italy: Returns Management Software Market Breakdown, by Enterprise Size
- 10.1.1.6 Russia: Returns Management Software Market - Revenue and Forecast to 2031 (US$ Million)
- 10.1.1.6.1 Russia: Returns Management Software Market Breakdown, by Component
- 10.1.1.6.2 Russia: Returns Management Software Market Breakdown, by Deployment
- 10.1.1.6.3 Russia: Returns Management Software Market Breakdown, by Enterprise Size
- 10.1.1.7 Rest of Europe: Returns Management Software Market - Revenue and Forecast to 2031 (US$ Million)
- 10.1.1.7.1 Rest of Europe: Returns Management Software Market Breakdown, by Component
- 10.1.1.7.2 Rest of Europe: Returns Management Software Market Breakdown, by Deployment
- 10.1.1.7.3 Rest of Europe: Returns Management Software Market Breakdown, by Enterprise Size
- 10.1.1 Europe: Returns Management Software Market - Revenue and Forecast Analysis - by Country
11. Competitive Landscape
- 11.1 Company Positioning & Concentration
- 11.2 Heat Map Analysis by Key Players
- 11.3 Company Market Global Share Analysis
- 11.4 Product Benchmarking
12. Industry Landscape
- 12.1 Overview
- 12.2 Market Initiative
- 12.3 New Product Development
- 12.4 Merger and Acquisition
13. Company Profiles
- 13.1 parcelLab
- 13.1.1 Key Facts
- 13.1.2 Business Description
- 13.1.3 Products and Services
- 13.1.4 Financial Overview
- 13.1.5 SWOT Analysis
- 13.1.6 Key Developments
- 13.2 ReverseLogix
- 13.2.1 Key Facts
- 13.2.2 Business Description
- 13.2.3 Products and Services
- 13.2.4 Financial Overview
- 13.2.5 SWOT Analysis
- 13.2.6 Key Developments
- 13.3 nShift
- 13.3.1 Key Facts
- 13.3.2 Business Description
- 13.3.3 Products and Services
- 13.3.4 Financial Overview
- 13.3.5 SWOT Analysis
- 13.3.6 Key Developments
- 13.4 United Parcel Service of America, Inc.
- 13.4.1 Key Facts
- 13.4.2 Business Description
- 13.4.3 Products and Services
- 13.4.4 Financial Overview
- 13.4.5 SWOT Analysis
- 13.4.6 Key Developments
- 13.5 SAP SE
- 13.5.1 Key Facts
- 13.5.2 Business Description
- 13.5.3 Products and Services
- 13.5.4 Financial Overview
- 13.5.5 SWOT Analysis
- 13.5.6 Key Developments
- 13.6 Shipcloud GmbH
- 13.6.1 Key Facts
- 13.6.2 Business Description
- 13.6.3 Products and Services
- 13.6.4 Financial Overview
- 13.6.5 SWOT Analysis
- 13.6.6 Key Developments
- 13.7 AfterShip
- 13.7.1 Key Facts
- 13.7.2 Business Description
- 13.7.3 Products and Services
- 13.7.4 Financial Overview
- 13.7.5 SWOT Analysis
- 13.7.6 Key Developments
14. Appendix
- 14.1 Word Index
- 14.2 About The Insight Partners

