|
|
市場調査レポート
商品コード
1494329
アジア太平洋の食用油脂市場予測(~2030年):地域別分析 - タイプ、用途別Asia Pacific Edible Oils and Fats Market Forecast to 2030 - Regional Analysis - By Type, and Application |
||||||
|
|||||||
|
|||||||


| アジア太平洋の食用油脂市場予測(~2030年):地域別分析 - タイプ、用途別 |
|
出版日: 2024年03月14日
発行: The Insight Partners
ページ情報: 英文 103 Pages
納期: 即納可能
|

全表示
- 概要
- 図表
- 目次
アジア太平洋の食用油脂の市場規模は、2023年に186億3,832万米ドルに達し、2022年~2030年にCAGR5.4%で成長し、2030年には269億7,516万米ドルに達すると予測されています。
メーカーによる戦略的開発がアジア太平洋の食用油脂市場を牽引
経済協力開発機構(OECD)によると、2022年の植物油の消費量は2億4,900万トンに達し、食品部門が大きなシェアを占めています。さらに、COVID-19パンデミックは油糧種子および油糧種子製品市場に短期的な混乱を引き起こし、2020年後半には急激な価格上昇を招きました。この価格上昇は、特にパーム油の供給増が制限されたことと、特に中国による輸入大豆の旺盛な需要の結果です。2021~2030年にかけて、大豆生産量は年間1.1%増加すると予想されます。2030年までに、大豆の生産量は411トンに達し、全油糧種子(落花生、ヒマワリの種、菜種)の総生産量179トンの2倍以上になると予測されます。さらに、菓子類産業ではバターが主原料として多く利用されており、次いでマーガリンです。高品質の食用油脂は、ベーカリーや菓子類、乳製品や冷菓、スナック菓子、RTE(調理済み)・RTC(ミールキット)食品、その他の食品・飲料に使用されています。精製油脂は脂質の豊富な供給源です。そのため、用途の拡大や世界人口の増加により、その使用量は増加しています。北米やアジア太平洋などの様々な地域における飲食品産業は、持続可能性への傾斜の高まり、利便性とすぐに食べられる製品への嗜好、オーガニック製品や植物由来製品の採用の高まりにより、継続的に成長しています。業界は、急速に変化する消費者の嗜好に対応するため、プロセス、製品、サービスの革新で大きな動きを目の当たりにしています。このように、世界中で成長している飲食品産業は、食用油脂の需要を促進しています。
アジア太平洋の食用油脂市場概要
アジア太平洋の食用油脂市場は、オーストラリア、中国、インド、日本、韓国、その他アジア太平洋に区分されます。市場成長は、パン、ケーキ、ペストリー、マフィンを中心とするベーカリー製品に対する需要の増加と、この地域のミレニアル世代やZ世代における西洋文化の影響の拡大に起因しています。米国農務省(USDA)によると、中国のベーカリー部門は驚異的な成長を遂げ、ベーカリー製品の小売売上高は2020年に340億米ドルを占めました。さらに、食用油脂メーカーがこの地域で積極的に事業を展開し、上質な油やその一部を使った食用油脂を提供しています。バターやマーガリンの特徴的な溶融プロファイル、包装タイプ、食用油脂の消泡剤や酸化防止剤の拡大は、この地域全体で利用可能であり、菓子類、ベーカリー、乳製品、乳児栄養など多くの最終用途産業で広く利用されています。
Cargill Incorporated、Novozymes、ADM、Kerry Group Plcなどの企業が、この地域で積極的に事業を展開しています。これらの国内外の企業は、しばしば戦略的イニシアチブを用いて事業を拡大しています。2021年11月、カーギル・インコーポレイテッドは、特殊油脂の需要拡大に対応するため、マレーシアに特殊油脂の生産施設を設立するために3,500万米ドルを投資しました。このカーギルの乾燥パーム分別施設は現在、チョコレート、菓子類、コーティング、フィリング、コンパウンド、スプレッド、ベーカリー、その他の最終用途産業向けに、食用油脂部門のさまざまな製品を提供しています。さらに2023年7月、ノボザイムズはアジア太平洋でクアラルンプールのパーム油施設(2,000平方フィート)を800平方フィート拡張すると発表しました。
食用油脂は、動物栄養、医薬品、栄養補助食品などの非食品分野でも重要な用途があります。動物栄養学では、これらの製品は動物飼料の配合に使用され、市場の成長に寄与しています。また、効率的な抽出方法や精製プロセスなどの技術進歩により、食用油脂の品質と収量が向上しています。その結果、生産能力が向上し、医薬品や栄養補助食品産業からの需要の高まりに対応できるようになり、市場拡大の原動力となっています。
アジア太平洋の食用油脂市場の収益と2030年までの予測(金額)
アジア太平洋の食用油脂市場のセグメンテーション
アジア太平洋の食用油脂市場は、タイプ、用途、国によって区分されます。
タイプ別では、アジア太平洋の食用油脂市場は油脂と脂肪に二分されます。2023年には油脂セグメントがより大きなシェアを占めています。油脂セグメントはさらにバター、マーガリン、パーム油ベースのショートニング、植物油ベースのショートニング、その他に細分化されます。油脂分野はさらに大豆油、ひまわり油、パーム油、キャノーラ油/菜種油、その他に細分されます。
用途別では、アジア太平洋の食用油脂市場は飲食品、動物栄養、医薬品、栄養補助食品に区分されます。2023年には飲食品セグメントが最大のシェアを占めています。飲食品セグメントはさらに、ベーカリー・菓子類、乳製品・冷菓、RTE・RTC食品、スナック、その他に細分化されます。
国別に見ると、アジア太平洋の食用油脂市場は中国、日本、インド、オーストラリア、韓国、その他アジア太平洋に区分されます。その他アジア太平洋は、2023年のアジア太平洋の食用油脂市場を独占しました。
AAK AB、Archer-Daniels-Midland Co、Bunge Ltd、Cargill Inc、ConnOils LLC、Fuji Oil Co Ltd、J-Oil Mills Inc、Kao Corp、Louis Dreyfus Co BV、Olam Group Ltdは、アジア太平洋の食用油脂市場で事業を展開している大手企業です。
目次
第1章 イントロダクション
第2章 エグゼクティブサマリー
- 主要洞察
- 市場の魅力
第3章 調査手法
- 調査範囲
- 2次調査
- 1次調査
- 制限と前提条件
第4章 アジア太平洋の食用油脂市場情勢
- ポーターのファイブフォース分析
- 供給企業の交渉力
- 買い手の交渉力
- 新規参入業者の脅威
- 競争企業間の敵対関係
- 代替品の脅威
- エコシステム分析
- 原材料サプライヤー
- 製造プロセス
- 流通業者または供給業者
- エンドユーザー
第5章 アジア太平洋の食用油脂市場:主要市場力学
- 市場促進要因
- 飲食品加工業界における食用油脂の需要増加
- メーカーによる戦略的開発への取り組み
- 市場抑制要因
- 食用油の価格上昇
- 市場機会
- 植物由来のショートニングと低脂肪油への需要の高まり
- 今後の動向
- マイクロカプセル化技術の採用
- 影響分析
第6章 食用油脂市場-アジア太平洋市場分析
- アジア太平洋の食用油脂市場の収益
- アジア太平洋の食用油脂市場の予測と分析
第7章 アジア太平洋の食用油脂市場分析:タイプ
- 油
- 油市場の収益と2030年までの予測
- 大豆油
- ひまわり油
- パーム油
- キャノーラ油/菜種油
- その他
- 脂
- 脂市場の収益と2030年までの予測
- バター
- マーガリン
- パーム油ベースのショートニング
- 植物油ベースのショートニング
- その他
第8章 アジア太平洋の食用油脂市場の分析:用途
- 飲食品
- 飲食品市場の収益と2030年までの予測
- ベーカリー・菓子類
- 乳製品と冷凍デザート
- RTE・RTC食品
- スナック
- その他
- 動物栄養
- 動物栄養市場の収益と2030年までの予測
- 医薬品と栄養補助食品
- 医薬品と栄養補助食品市場の収益と2030年までの予測
第9章 アジア太平洋の食用油脂市場:国別分析
- 中国
- 日本
- インド
- オーストラリア
- 韓国
- その他アジア太平洋
第10章 競合情勢
- 各社のポジショニングと集中度
- 主要企業によるヒートマップ分析
第11章 企業プロファイル
- Bunge Ltd
- Archer-Daniels-Midland Co
- Fuji Oil Co Ltd
- Kao Corp
- AAK AB
- J-Oil Mills Inc
- Cargill Inc
- Olam Group Ltd
- ConnOils LLC
- Louis Dreyfus Co BV
第12章 企業プロファイル付録
List Of Tables
- Table 1. Asia Pacific Edible Oils and Fats Market Segmentation
- Table 2. Asia Pacific Edible Oils and Fats Market Revenue and Forecasts to 2030 (US$ Million)
- Table 3. Asia Pacific Edible Oils and Fats Market Revenue and Forecasts to 2030 (US$ Million) - Type
- Table 4. Asia Pacific Edible Oils and Fats Market Revenue and Forecasts to 2030 (US$ Million) - Application
- Table 5. China: Asia Pacific Edible Oils and Fats Market Revenue and Forecasts to 2030 (US$ Million) - Type
- Table 6. China: Asia Pacific Edible Oils and Fats Market Revenue and Forecasts to 2030 (US$ Million) - Application
- Table 7. Japan: Asia Pacific Edible Oils and Fats Market Revenue and Forecasts to 2030 (US$ Million) - Type
- Table 8. Japan: Asia Pacific Edible Oils and Fats Market Revenue and Forecasts to 2030 (US$ Million) - Application
- Table 9. India: Asia Pacific Edible Oils and Fats Market Revenue and Forecasts to 2030 (US$ Million) - Type
- Table 10. India: Asia Pacific Edible Oils and Fats Market Revenue and Forecasts to 2030 (US$ Million) - Application
- Table 11. Australia: Asia Pacific Edible Oils and Fats Market Revenue and Forecasts to 2030 (US$ Million) - Type
- Table 12. Australia: Asia Pacific Edible Oils and Fats Market Revenue and Forecasts to 2030 (US$ Million) - Application
- Table 13. South Korea: Asia Pacific Edible Oils and Fats Market Revenue and Forecasts to 2030 (US$ Million) - Type
- Table 14. South Korea: Asia Pacific Edible Oils and Fats Market Revenue and Forecasts to 2030 (US$ Million) - Application
- Table 15. Rest of Asia Pacific: Asia Pacific Edible Oils and Fats Market Revenue and Forecasts to 2030 (US$ Million) - Type
- Table 16. Rest of Asia Pacific: Asia Pacific Edible Oils and Fats Market Revenue and Forecasts to 2030 (US$ Million) - Application
- Table 17. Company Positioning & Concentration
List Of Figures
- Figure 1. Asia Pacific Edible Oils and Fats Market Segmentation, By Country
- Figure 2. Asia Pacific Edible Oils and Fats Market - Porter's Analysis
- Figure 3. Ecosystem: Asia Pacific Edible Oils and Fats Market
- Figure 4. Market Dynamics: Asia Pacific Edible Oils and Fats Market
- Figure 5. Asia Pacific Edible Oils and Fats Market Impact Analysis of Drivers and Restraints
- Figure 6. Asia Pacific Edible Oils and Fats Market Revenue (US$ Million), 2020 - 2030
- Figure 7. Asia Pacific Edible Oils and Fats Market Share (%) - Type, 2022 and 2030
- Figure 8. Oils Market Revenue and Forecasts to 2030 (US$ Million)
- Figure 9. Soybean Oil Market Revenue and Forecasts to 2030 (US$ Million)
- Figure 10. Sunflower Oil Market Revenue and Forecasts to 2030 (US$ Million)
- Figure 11. Palm Oil Market Revenue and Forecasts to 2030 (US$ Million)
- Figure 12. Canola Oil/Rapeseed Oil Market Revenue and Forecasts to 2030 (US$ Million)
- Figure 13. Others Market Revenue and Forecasts to 2030 (US$ Million)
- Figure 14. Fats Market Revenue and Forecasts to 2030 (US$ Million)
- Figure 15. Butter Market Revenue and Forecasts to 2030 (US$ Million)
- Figure 16. Margarine Market Revenue and Forecasts to 2030 (US$ Million)
- Figure 17. Palm Oil Based Shortening Market Revenue and Forecasts to 2030 (US$ Million)
- Figure 18. Vegetable Oil Based Shortening Market Revenue and Forecasts to 2030 (US$ Million)
- Figure 19. Others Market Revenue and Forecasts to 2030 (US$ Million)
- Figure 20. Asia Pacific Edible Oils and Fats Market Share (%) -Application, 2022 and 2030
- Figure 21. Food and Beverages Market Revenue and Forecasts to 2030 (US$ Million)
- Figure 22. Bakery and Confectionery Market Revenue and Forecasts to 2030 (US$ Million)
- Figure 23. Dairy and Frozen Desserts Market Revenue and Forecasts to 2030 (US$ Million)
- Figure 24. RTE and RTC Meals Market Revenue and Forecasts to 2030 (US$ Million)
- Figure 25. Snacks Market Revenue and Forecasts to 2030 (US$ Million)
- Figure 26. Others Market Revenue and Forecasts to 2030 (US$ Million)
- Figure 27. Animal Nutrition Market Revenue and Forecasts to 2030 (US$ Million)
- Figure 28. Pharmaceuticals and Nutraceuticals Market Revenue and Forecasts to 2030 (US$ Million)
- Figure 29. Asia Pacific Edible Oils and Fats Market Breakdown By Key Countries - Revenue (2022) (US$ Million)
- Figure 30. Asia Pacific Edible Oils and Fats Market Breakdown by Key Countries, 2022 And 2030 (%)
- Figure 31. China: Asia Pacific Edible Oils and Fats Market Revenue and Forecasts to 2030 (US$ Million)
- Figure 32. Japan: Asia Pacific Edible Oils and Fats Market Revenue and Forecasts to 2030 (US$ Million)
- Figure 33. India: Asia Pacific Edible Oils and Fats Market Revenue and Forecasts to 2030 (US$ Million)
- Figure 34. Australia: Asia Pacific Edible Oils and Fats Market Revenue and Forecasts to 2030 (US$ Million)
- Figure 35. South Korea: Asia Pacific Edible Oils and Fats Market Revenue and Forecasts to 2030 (US$ Million)
- Figure 36. Rest of Asia Pacific: Asia Pacific Edible Oils and Fats Market Revenue and Forecasts to 2030 (US$ Million)
- Figure 37. Heat Map Analysis by Key Players
The Asia Pacific edible oils and fats market was valued at US$ 18,638.32 million in 2023 and is expected to reach US$ 26,975.16 million by 2030; it is estimated to grow at a CAGR of 5.4% from 2023 to 2030.
Strategic Development Initiatives by Manufacturers Drive Asia Pacific Edible Oils and Fats Market
According to the Organization for Economic Co-operation and Development (OECD), in 2022, the consumption of vegetable oil reached 249 million metric tons, with the food sector accounting for the major share. Furthermore, the COVID-19 pandemic caused short-term disruptions in the oilseed and oilseed product markets, which led to sharp price hikes in the second half of 2020. This price increase is the result of restricted supply growth, particularly for palm oil, and strong demand, particularly for imported soybeans by China. Over the period of 2021-30, soybean production is expected to rise by 1.1% per year. By 2030, soybean production is predicted to reach 411 Mt, more than twice the total production of all oilseeds (groundnuts, sunflower seeds, and rapeseed), which is projected to be 179 Mt. 90% of soybeans and 87% of other oilseeds are processed into protein meal, which is nearly exclusively used for feed, and vegetable oil, which is used for food, oleochemicals, and biodiesel. Moreover, the confectionery industry significantly utilizes butter as a primary ingredient, followed by margarine. The high-quality edible oils and fats are used in bakery and confectionery, dairy and frozen desserts, snacks, Ready-to-Eat (RTE) and Ready-to-Cook (RTC) meals, and other food and beverage items. Refined oils and fats are a rich source of lipids. Thus, their use is increasing due to rising application and growing global population. The food & beverages industry in various regions such as North America and Asia Pacific is continuously growing owing to an upsurging inclination toward sustainability, preference for convenience and ready-to-eat products, and rising adoption of organic and plant-based products. The industry is witnessing substantial motion with innovation in processes, products, and services to cater to rapidly changing consumer preferences. Thus, the growing food & beverages industry across the globe propels the demand for edible oils and fats.
Asia Pacific Edible Oils and Fats Market Overview
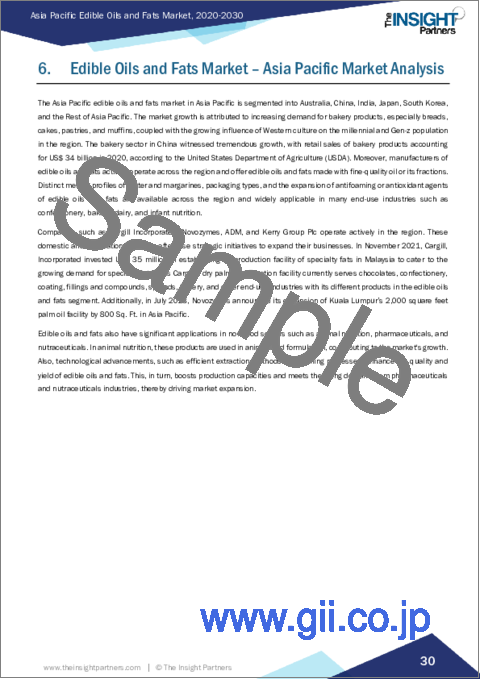
The Asia Pacific edible oils and fats market is segmented into Australia, China, India, Japan, South Korea, and the Rest of Asia Pacific. The market growth is attributed to increasing demand for bakery products, especially breads, cakes, pastries, and muffins, coupled with the growing influence of Western culture on the millennial and Gen-z population in the region. The bakery sector in China witnessed tremendous growth, with retail sales of bakery products accounting for US$ 34 billion in 2020, according to the United States Department of Agriculture (USDA). Moreover, manufacturers of edible oils and fats actively operate across the region and offer edible oils and fats made with fine-quality oil or its fractions. Distinct melting profiles of butter and margarines, packaging types, and the expansion of antifoaming or antioxidant agents of edible oils and fats are available across the region and widely applicable in many end-use industries such as confectionery, bakery, dairy, and infant nutrition.
Companies such as Cargill Incorporated, Novozymes, ADM, and Kerry Group Plc operate actively in the region. These domestic and international players often use strategic initiatives to expand their businesses. In November 2021, Cargill, Incorporated invested US$ 35 million in establishing its production facility of specialty fats in Malaysia to cater to the growing demand for specialty fats. This Cargill's dry palm fractionation facility currently serves chocolates, confectionery, coating, fillings and compounds, spreads, bakery, and other end-use industries with its different products in the edible oils and fats segment. Additionally, in July 2023, Novozymes announced its expansion of Kuala Lumpur's 2,000 square feet palm oil facility by 800 Sq. Ft. in Asia Pacific.
Edible oils and fats also have significant applications in non-food sectors such as animal nutrition, pharmaceuticals, and nutraceuticals. In animal nutrition, these products are used in animal feed formulation, contributing to the market's growth. Also, technological advancements, such as efficient extraction methods and refining processes, enhance the quality and yield of edible oils and fats. This, in turn, boosts production capacities and meets the rising demand from pharmaceuticals and nutraceuticals industries, thereby driving market expansion.
Asia Pacific Edible Oils and Fats Market Revenue and Forecast to 2030 (US$ Million)
Asia Pacific Edible Oils and Fats Market Segmentation
The Asia Pacific edible oils and fats market is segmented based on type, application, and country.
Based on type, the Asia Pacific edible oils and fats market is bifurcated into oils and fats. The oils segment held a larger share in 2023 . The fats segment is further subsegmented into butter, margarine, palm oil based shortening, vegetable oil based shortening, and others. The oils segment is further subsegmented into soybean oil, sunflower oil, palm oil, canola oil/rapeseed oil, and others.
By application, the Asia Pacific edible oils and fats market is segmented into food and beverages, animal nutrition, pharmaceuticals and nutraceuticals . The food and beverages segment held the largest share in 2023. The food and beverages segment is further subsegmented into bakery and confectionery, Dairy and frozen desserts, RTE and RTC meals, snacks, and others.
Based on country, the Asia Pacific edible oils and fats market is segmented into China, Japan, India, Australia, South Korea, and the Rest of Asia Pacific. The Rest of Asia Pacific dominated the Asia Pacific edible oils and fats market in 2023.
AAK AB, Archer-Daniels-Midland Co, Bunge Ltd, Cargill Inc, ConnOils LLC, Fuji Oil Co Ltd, J-Oil Mills Inc, Kao Corp, Louis Dreyfus Co BV, and Olam Group Ltd are some of the leading companies operating in the Asia Pacific edible oils and fats market.
Table Of Contents
1. Introduction
- 1.1 The Insight Partners Research Report Guidance
- 1.2 Market Segmentation
2. Executive Summary
- 2.1 Key Insights
- 2.2 Market Attractiveness
3. Research Methodology
- 3.1 Coverage
- 3.2 Secondary Research
- 3.3 Primary Research
- 3.4 Limitations and Assumptions
4. Asia Pacific Edible Oils and Fats Market Landscape
- 4.1 Overview
- 4.2 Porter's Five Forces Analysis
- 4.2.1 Bargaining Power of Suppliers
- 4.2.2 Bargaining Power of Buyers
- 4.2.3 Threat of New Entrants
- 4.2.4 Competitive Rivalry
- 4.2.5 Threat of Substitutes
- 4.3 Ecosystem Analysis
- 4.3.1 Raw Material Suppliers
- 4.3.2 Manufacturing Process
- 4.3.3 Distributors or Suppliers
- 4.3.4 End Users
5. Asia Pacific Edible Oils and Fats Market - Key Market Dynamics
- 5.1 Market Drivers
- 5.1.1 Rising Demand for Edible Oils and Fats from Food & Beverage Processing Industry
- 5.1.2 Strategic Development Initiatives by Manufacturers
- 5.2 Market Restraints
- 5.2.1 Increasing Prices of Edible Oils
- 5.3 Market Opportunity
- 5.3.1 Growing Demand for Plant-based Shortenings and Low-fat Oils
- 5.4 Future Trend
- 5.4.1 Adoption of Microencapsulation Technology
- 5.5 Impact Analysis
6. Edible Oils and Fats Market - Asia Pacific Market Analysis
- 6.1 Asia Pacific Edible Oils and Fats Market Revenue (US$ Million)
- 6.2 Asia Pacific Edible Oils and Fats Market Forecast and Analysis
7. Asia Pacific Edible Oils and Fats Market Analysis - Type
- 7.1 Oils
- 7.1.1 Overview
- 7.1.2 Oils Market Revenue and Forecast to 2030 (US$ Million)
- 7.1.3 Soybean Oil
- 7.1.3.1 Overview
- 7.1.3.2 Soybean Oil Market Revenue and Forecast to 2030 (US$ Million)
- 7.1.4 Sunflower Oil
- 7.1.4.1 Overview
- 7.1.4.2 Sunflower Oil Market Revenue and Forecast to 2030 (US$ Million)
- 7.1.5 Palm Oil
- 7.1.5.1 Overview
- 7.1.5.2 Palm Oil Market Revenue and Forecast to 2030 (US$ Million)
- 7.1.6 Canola Oil/Rapeseed Oil
- 7.1.6.1 Overview
- 7.1.6.2 Canola Oil/Rapeseed Oil Market Revenue and Forecast to 2030 (US$ Million)
- 7.1.7 Others
- 7.1.7.1 Overview
- 7.1.7.2 Others Market Revenue and Forecast to 2030 (US$ Million)
- 7.2 Fats
- 7.2.1 Overview
- 7.2.2 Fats Market Revenue and Forecast to 2030 (US$ Million)
- 7.2.3 Butter
- 7.2.3.1 Overview
- 7.2.3.2 Butter Market Revenue and Forecast to 2030 (US$ Million)
- 7.2.4 Margarine
- 7.2.4.1 Overview
- 7.2.4.2 Margarine Market Revenue and Forecast to 2030 (US$ Million)
- 7.2.5 Palm Oil Based Shortening
- 7.2.5.1 Overview
- 7.2.5.2 Palm Oil Based Shortening Market Revenue and Forecast to 2030 (US$ Million)
- 7.2.6 Vegetable Oil Based Shortening
- 7.2.6.1 Overview
- 7.2.6.2 Vegetable Oil Based Shortening Market Revenue and Forecast to 2030 (US$ Million)
- 7.2.7 Others
- 7.2.7.1 Overview
- 7.2.7.2 Others Market Revenue and Forecast to 2030 (US$ Million)
8. Asia Pacific Edible Oils and Fats Market Analysis - Application
- 8.1 Food and Beverages
- 8.1.1 Overview
- 8.1.2 Food and Beverages Market Revenue, and Forecast to 2030 (US$ Million)
- 8.1.3 Bakery and Confectionery
- 8.1.3.1 Overview
- 8.1.3.2 Bakery and Confectionery Market Revenue, and Forecast to 2030 (US$ Million)
- 8.1.4 Dairy and Frozen Desserts
- 8.1.4.1 Overview
- 8.1.4.2 Dairy and Frozen Desserts Market Revenue, and Forecast to 2030 (US$ Million)
- 8.1.5 RTE and RTC Meals
- 8.1.5.1 Overview
- 8.1.5.2 RTE and RTC Meals Market Revenue, and Forecast to 2030 (US$ Million)
- 8.1.6 Snacks
- 8.1.6.1 Overview
- 8.1.6.2 Snacks Market Revenue, and Forecast to 2030 (US$ Million)
- 8.1.7 Others
- 8.1.7.1 Overview
- 8.1.7.2 Others Market Revenue, and Forecast to 2030 (US$ Million)
- 8.2 Animal Nutrition
- 8.2.1 Overview
- 8.2.2 Animal Nutrition Market Revenue, and Forecast to 2030 (US$ Million)
- 8.3 Pharmaceuticals and Nutraceuticals
- 8.3.1 Overview
- 8.3.2 Pharmaceuticals and Nutraceuticals Market Revenue and Forecast to 2030 (US$ Million)
9. Asia Pacific Edible Oils and Fats Market - Country Analysis
- 9.1 Asia Pacific Edible Oils and Fats Market - Country Analysis
- 9.1.1 Asia Pacific Edible Oils and Fats Market Breakdown by Country
- 9.1.1.1 Asia Pacific Edible Oils and Fats Market Breakdown by Country
- 9.1.1.2 China: Asia Pacific Edible Oils and Fats Market Revenue and Forecasts to 2030 (US$ Million)
- 9.1.1.2.1 China: Asia Pacific Edible Oils and Fats Market Breakdown by Type
- 9.1.1.2.2 China: Asia Pacific Edible Oils and Fats Market Breakdown by Application
- 9.1.1.3 Japan: Asia Pacific Edible Oils and Fats Market Revenue and Forecasts to 2030 (US$ Million)
- 9.1.1.3.1 Japan: Asia Pacific Edible Oils and Fats Market Breakdown by Type
- 9.1.1.3.2 Japan: Asia Pacific Edible Oils and Fats Market Breakdown by Application
- 9.1.1.4 India: Asia Pacific Edible Oils and Fats Market Revenue and Forecasts to 2030 (US$ Million)
- 9.1.1.4.1 India: Asia Pacific Edible Oils and Fats Market Breakdown by Type
- 9.1.1.4.2 India: Asia Pacific Edible Oils and Fats Market Breakdown by Application
- 9.1.1.5 Australia: Asia Pacific Edible Oils and Fats Market Revenue and Forecasts to 2030 (US$ Million)
- 9.1.1.5.1 Australia: Asia Pacific Edible Oils and Fats Market Breakdown by Type
- 9.1.1.5.2 Australia: Asia Pacific Edible Oils and Fats Market Breakdown by Application
- 9.1.1.6 South Korea: Asia Pacific Edible Oils and Fats Market Revenue and Forecasts to 2030 (US$ Million)
- 9.1.1.6.1 South Korea: Asia Pacific Edible Oils and Fats Market Breakdown by Type
- 9.1.1.6.2 South Korea: Asia Pacific Edible Oils and Fats Market Breakdown by Application
- 9.1.1.7 Rest of Asia Pacific: Asia Pacific Edible Oils and Fats Market Revenue and Forecasts to 2030 (US$ Million)
- 9.1.1.7.1 Rest of Asia Pacific: Asia Pacific Edible Oils and Fats Market Breakdown by Type
- 9.1.1.7.2 Rest of Asia Pacific: Asia Pacific Edible Oils and Fats Market Breakdown by Application
- 9.1.1 Asia Pacific Edible Oils and Fats Market Breakdown by Country
10. Competitive Landscape
- 10.1 Company Positioning & Concentration
- 10.2 Heat Map Analysis by Key Players
11. Company Profiles
- 11.1 Bunge Ltd
- 11.1.1 Key Facts
- 11.1.2 Business Description
- 11.1.3 Products and Services
- 11.1.4 Financial Overview
- 11.1.5 SWOT Analysis
- 11.1.6 Key Developments
- 11.2 Archer-Daniels-Midland Co
- 11.2.1 Key Facts
- 11.2.2 Business Description
- 11.2.3 Products and Services
- 11.2.4 Financial Overview
- 11.2.5 SWOT Analysis
- 11.2.6 Key Developments
- 11.3 Fuji Oil Co Ltd
- 11.3.1 Key Facts
- 11.3.2 Business Description
- 11.3.3 Products and Services
- 11.3.4 Financial Overview
- 11.3.5 SWOT Analysis
- 11.3.6 Key Developments
- 11.4 Kao Corp
- 11.4.1 Key Facts
- 11.4.2 Business Description
- 11.4.3 Products and Services
- 11.4.4 Financial Overview
- 11.4.5 SWOT Analysis
- 11.4.6 Key Developments
- 11.5 AAK AB
- 11.5.1 Key Facts
- 11.5.2 Business Description
- 11.5.3 Products and Services
- 11.5.4 Financial Overview
- 11.5.5 SWOT Analysis
- 11.5.6 Key Developments
- 11.6 J-Oil Mills Inc
- 11.6.1 Key Facts
- 11.6.2 Business Description
- 11.6.3 Products and Services
- 11.6.4 Financial Overview
- 11.6.5 SWOT Analysis
- 11.6.6 Key Developments
- 11.7 Cargill Inc
- 11.7.1 Key Facts
- 11.7.2 Business Description
- 11.7.3 Products and Services
- 11.7.4 Financial Overview
- 11.7.5 SWOT Analysis
- 11.7.6 Key Developments
- 11.8 Olam Group Ltd
- 11.8.1 Key Facts
- 11.8.2 Business Description
- 11.8.3 Products and Services
- 11.8.4 Financial Overview
- 11.8.5 SWOT Analysis
- 11.8.6 Key Developments
- 11.9 ConnOils LLC
- 11.9.1 Key Facts
- 11.9.2 Business Description
- 11.9.3 Products and Services
- 11.9.4 Financial Overview
- 11.9.5 SWOT Analysis
- 11.9.6 Key Developments
- 11.10 Louis Dreyfus Co BV
- 11.10.1 Key Facts
- 11.10.2 Business Description
- 11.10.3 Products and Services
- 11.10.4 Financial Overview
- 11.10.5 SWOT Analysis
- 11.10.6 Key Developments

