|
|
市場調査レポート
商品コード
1362456
米国の食用油脂市場規模・予測、地域シェア、動向、成長機会分析レポート対象範囲:タイプ別、用途別、地域別US Edible Oils and Fats Market Size and Forecasts (2022 - 2030), Regional Share, Trends, and Growth Opportunity Analysis Report Coverage: By Type, Application, and Geography |
||||||
|
|
|||||||
|
|||||||


| 米国の食用油脂市場規模・予測、地域シェア、動向、成長機会分析レポート対象範囲:タイプ別、用途別、地域別 |
|
出版日: 2023年09月13日
発行: The Insight Partners
ページ情報: 英文 114 Pages
納期: 即納可能
|

- 全表示
- 概要
- 図表
- 目次
米国の食用油脂市場規模は2022年に95億2,000万米ドルと評価され、2030年には131億1,000万米ドルに達すると予測され、2023年から2030年までのCAGRは4.1%と予測されています。
食用油は、大豆油、ひまわり油などの一般的な植物油です。常温で油は液体であるが、脂肪は部分的に固体です。食用油は主に、大豆、ココナッツ、菜種、パーム、ヒマワリ、綿実油を原料としています。油脂は食品の味を良くし、最終製品に良い食感を与えます。食用油は、世界中で一般的に工業用食品製造や家庭料理に使用されており、人間の食生活における不飽和脂肪とビタミンEの一次情報源となっています。飲食品業界において、ビタミンE、セレン、植物ステロール、マグネシウムを含むいくつかの栄養素の主要な供給源として食用油脂の重要性が高まっていることは、今後数年間も有利な要因であり続けると予想されます。これらの要因は、予測期間中、米国市場を牽引すると予想されます。
消費者の健康意識の高まりに伴い、植物性で低脂肪の製品に対する需要が増加しています。そのため、メーカーは需要の増加に対応するため、植物由来のショートニングや低脂肪油を開発しています。植物由来のショートニングは水素添加されておらず、コレステロールやトランス脂肪酸を含まないです。そのため、より健康的な代替品と考えられています。さらに、長年にわたる心血管疾患、肥満、糖尿病の問題の増加が、低脂肪製品に対する需要の引き金となっており、ベーカリー&菓子類、乳製品&冷菓、間食など様々な業界における低脂肪油の需要を押し上げると予想されています。
消費者は、従来の製品よりも健康的であると考え、植物由来の製品に傾倒しています。加えて、動物保護と環境の持続可能性に関する意識の高まりが、こうした植物性製品の人気を生み出している主な要因です。ヴィーガニュアリー」(1月いっぱいヴィーガンになることを奨励する非営利団体)が2021年に発表したデータによると、「ヴィーガニュアリーキャンペーン」には580万人が登録しました。このように、菜食主義の動向の高まりと、消費者の需要増に対応するための様々な最終用途産業における植物由来のショートニングや低脂肪油の需要の増加は、食用油脂市場に有利な成長機会を生み出しています。
Bunge Ltd、Archer-Daniels-Midland Co、不二製油株式会社、花王株式会社、AAK AB、J-Oil Mills Inc、Cargill Inc、Olam Group Ltd、ConnOils LLC、Louis Dreyfus Co BVは、米国の食用油脂市場で事業を展開している主要企業です。これらの市場プレーヤーは、顧客の需要を満たすために高品質で革新的な製品を提供し、米国の食用油脂市場シェアを拡大することに注力しています。
米国食用油脂市場全体の規模は、一次情報と二次情報の両方を用いて算出しました。調査プロセスを開始するにあたり、市場に関する質的・量的情報を入手するため、社内外の情報源を用いて徹底的な二次調査を実施しました。また、データを検証し、トピックに関する分析的洞察を得るために、業界関係者に複数の一次インタビューを実施しました。このプロセスの参入企業には、副社長、事業開発マネージャー、マーケットインテリジェンスマネージャー、国内営業マネージャーなどの業界専門家と、米国食用油脂市場を専門とする評価専門家、研究アナリスト、キーオピニオンリーダーなどの外部コンサルタントが含まれます。
目次
第1章 イントロダクション
第2章 エグゼクティブサマリー
- 主要洞察
- 市場の魅力
第3章 調査手法
- 調査範囲
- 2次調査
- 1次調査
- 限界と前提条件
第4章 米国食用油脂市場情勢
- ポーターのファイブフォース分析
- 供給企業の交渉力
- 買い手の交渉力
- 新規参入業者の脅威
- 競争企業間の敵対関係
- 代替品の脅威
- エコシステム分析
- ベンダー一覧
第5章 米国食用油脂市場:主要市場力学
- 市場促進要因
- 飲食品加工業界における食用油脂需要の増加
- メーカーによる戦略的開発イニシアティブ
- 市場抑制要因
- 食用油の価格上昇
- 市場機会
- 植物由来のショートニングと低脂肪油への需要の高まり
- 今後の動向
- マイクロカプセル化技術の採用
- 影響分析
第6章 食用油脂市場:米国市場分析
- 米国の食用油脂市場の売上高
- 米国の食用油脂市場規模(キロトン)
- 米国の食用油脂市場の予測と分析
第7章 食用油脂の米国市場分析:タイプ
- 油脂
- 油脂市場の2030年までの数量と予測(キロトン)
- 大豆油
- 大豆油の概要
- 大豆油の市場量と2030年までの予測(キロトン)
- ひまわり油
- ひまわり油の概要
- ひまわり油の市場量と2030年までの予測(キロトン)
- パーム油
- パーム油の概要
- パーム油の市場量と2030年までの予測(キロトン)
- キャノーラ油/菜種油
- キャノーラ油/菜種油の市場規模推移と2030年までの予測(キロトン)
- その他
- その他の概要
- その他の市場規模推移と2030年までの予測(キロトン)
- 油脂
- 油脂の市場数量と2030年までの予測(キロトン)
- バター
- バターの市場数量と2030年までの予測(キロトン)
- マーガリン
- マーガリンの概要
- マーガリンの市場規模推移と2030年までの予測(キロトン)
- パーム油ベースのショートニング
- ショートニングの概要
- パーム油ベースのショートニングの市場規模推移と2030年までの予測(キロトン)
- 植物油ベースショートニング
- 植物油ベースのショートニングの概要
- 植物油ベースショートニングの市場規模推移と2030年までの予測(キロトン)
- その他
- その他の概要
- その他の市場規模推移と2030年までの予測(キロトン)
第8章 米国の食用油脂市場分析-用途
- 飲食品
- 飲食品市場の収益と2030年までの予測
- ベーカリー・菓子類
- ベーカリー・菓子類市場の収益と2030年までの予測
- 乳製品と冷凍デザート
- 乳製品と冷凍デザート市場の収益と2030年までの予測
- RTEおよびRTCミール
- RTEおよびRTCミール市場の収益と2030年までの予測
- スナック
- スナック菓子市場の収益と2030年までの予測
- その他
- その他市場の収益と2030年までの予測
- 動物栄養
- 動物栄養市場の収益と2030年までの予測
- 医薬品と栄養補助食品
第9章 米国の食用油脂市場-地域分析
- 米国の食用油脂市場
- 米国の食用油脂市場の地域別内訳
- 食用油脂市場の地域別内訳
- 北東部の食用油脂市場の2030年までの数量と予測(キロトン)
- 南西部の食用油脂市場規模推移と2030年までの予測(キロトン)
- 食用油脂の西市場規模推移と2030年までの予測(キロトン)
- 南東部の食用油脂市場の2030年までの数量と予測(キロトン)
- 中西部の食用油脂市場の2030年までの数量と予測(キロトン)
- 米国の食用油脂市場の地域別内訳
第10章 COVID-19パンデミックの米国食用油脂市場への影響
- COVID-19前後の米国食用油脂市場への影響
第11章 競合情勢
- 主要企業によるヒートマップ分析
- 企業のポジショニングと集中度
第12章 企業プロファイル
- Bunge Ltd
- Archer-Daniels-Midland Co
- Fuji Oil Co Ltd
- Kao Corp
- AAK AB
- J-Oil Mills Inc
- Cargill Inc
- Olam Group Ltd
- ConnOils LLC
- Louis Dreyfus Co BV
第13章 付録
List Of Tables
- Table 1. US Edible Oils and Fats Market Segmentation
- Table 2. US Edible Oils and Fats Market Revenue and Forecasts To 2030 (US$ Million)
- Table 3. US Edible Oils and Fats Market Volume and Forecasts To 2030 (Kilo Tons)
- Table 4. US Edible Oils and Fats Market Revenue and Forecasts To 2030 (US$ Million) - Type
- Table 5. US Edible Oils and Fats Market Volume and Forecasts To 2030 (Kilo Tons) - Type
- Table 6. US Edible Oils and Fats Market Revenue and Forecasts To 2030 (US$ Million) - Application
- Table 7. Northeast Edible Oils and Fats Market Revenue and Forecasts To 2030 (US$ Million) - Type
- Table 8. Northeast Edible Oils and Fats Market Volume and Forecasts To 2030 (Kilo Tons) - Type
- Table 9. Northeast Edible Oils and Fats Market Revenue and Forecasts To 2030 (US$ Million) - Application
- Table 10. Southwest Edible Oils and Fats Market Revenue and Forecasts To 2030 (US$ Million) - Type
- Table 11. Southwest Edible Oils and Fats Market Volume and Forecasts To 2030 (Kilo Tons) - Type
- Table 12. Southwest Edible Oils and Fats Market Revenue and Forecasts To 2030 (US$ Million) - Application
- Table 13. West Edible Oils and Fats Market Revenue and Forecasts To 2030 (US$ Million) - Type
- Table 14. West Edible Oils and Fats Market Volume and Forecasts To 2030 (Kilo Tons) - Type
- Table 15. West Edible Oils and Fats Market Revenue and Forecasts To 2030 (US$ Million) - Application
- Table 16. Southeast Edible Oils and Fats Market Revenue and Forecasts To 2030 (US$ Million) - Type
- Table 17. Southeast Edible Oils and Fats Market Volume and Forecasts To 2030 (Kilo Tons) - Type
- Table 18. Southeast Edible Oils and Fats Market Revenue and Forecasts To 2030 (US$ Million) - Application
- Table 19. Midwest Edible Oils and Fats Market Revenue and Forecasts To 2030 (US$ Million) - Type
- Table 20. Midwest Edible Oils and Fats Market Volume and Forecasts To 2030 (Kilo Tons) - Type
- Table 21. Midwest Edible Oils and Fats Market Revenue and Forecasts To 2030 (US$ Million) - Application
- Table 22. Heat Map Analysis by Key Players
List Of Figures
- Figure 1. US Edible Oils and Fats Market Segmentation, By Region
- Figure 2. US Edible Oils and Fats Market - Porter's Analysis
- Figure 3. Ecosystem: US Edible Oils and Fats Market
- Figure 4. Market Dynamics: US Edible Oils and Fats Market
- Figure 5. US Edible Oils and Fats Market Impact Analysis of Drivers and Restraints
- Figure 6. US Edible Oils and Fats Market Revenue (US$ Million), 2020 - 2030
- Figure 7. US Edible Oils and Fats Market Volume (Kilo Tons), 2020 - 2030
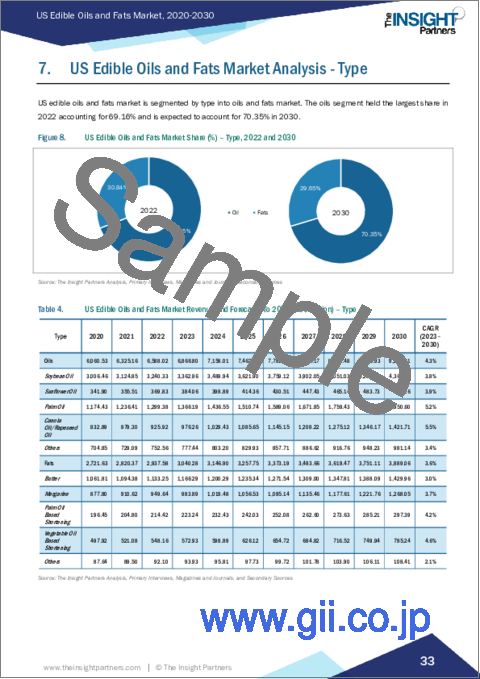
- Figure 8. US Edible Oils and Fats Market Share (%) - Type, 2022 and 2030
- Figure 9. Oils Market Revenue and Forecasts To 2030 (US$ Million)
- Figure 10. Oils Market Volume and Forecasts To 2030 (Kilo Tons)
- Figure 11. Soybean Oil Market Revenue and Forecasts To 2030 (US$ Million)
- Figure 12. Soybean Oil Market Volume and Forecasts To 2030 (Kilo Tons)
- Figure 13. Sunflower Oil Market Revenue and Forecasts To 2030 (US$ Million)
- Figure 14. Sunflower Oil Market Volume and Forecasts To 2030 (Kilo Tons)
- Figure 15. Palm Oil Market Revenue and Forecasts To 2030 (US$ Million)
- Figure 16. Palm Oil Market Volume and Forecasts To 2030 (Kilo Tons)
- Figure 17. Canola Oil/Rapeseed Oil Market Revenue and Forecasts To 2030 (US$ Million)
- Figure 18. Canola Oil/Rapeseed Oil Market Volume and Forecasts To 2030 (Kilo Tons)
- Figure 19. Others Market Revenue and Forecasts To 2030 (US$ Million)
- Figure 20. Others Market Volume and Forecasts To 2030 (Kilo Tons)
- Figure 21. Fats Market Revenue and Forecasts To 2030 (US$ Million)
- Figure 22. Fats Market Volume and Forecasts To 2030 (Kilo Tons)
- Figure 23. Butter Market Revenue and Forecasts To 2030 (US$ Million)
- Figure 24. Butter Market Volume and Forecasts To 2030 (Kilo Tons)
- Figure 25. Margarine Market Revenue and Forecasts To 2030 (US$ Million)
- Figure 26. Margarine Market Volume and Forecasts To 2030 (Kilo Tons)
- Figure 27. Palm Oil Based Shortening Market Revenue and Forecasts To 2030 (US$ Million)
- Figure 28. Palm Oil Based Shortening Market Volume and Forecasts To 2030 (Kilo Tons)
- Figure 29. Vegetable Oil Based Shortening Market Revenue and Forecasts To 2030 (US$ Million)
- Figure 30. Vegetable Oil Based Shortening Market Volume and Forecasts To 2030 (Kilo Tons)
- Figure 31. Others Market Revenue and Forecasts To 2030 (US$ Million)
- Figure 32. Others Market Volume and Forecasts To 2030 (Kilo Tons)
- Figure 33. US Edible Oils and Fats Market Share (%) -Application, 2022 and 2030
- Figure 34. Food and Beverages Market Revenue and Forecasts To 2030 (US$ Million)
- Figure 35. Bakery and Confectionery Market Revenue and Forecasts To 2030 (US$ Million)
- Figure 36. Dairy and Frozen Desserts Market Revenue and Forecasts To 2030 (US$ Million)
- Figure 37. RTE and RTC Meals Market Revenue and Forecasts To 2030 (US$ Million)
- Figure 38. Snacks Market Revenue and Forecasts To 2030 (US$ Million)
- Figure 39. Others Market Revenue and Forecasts To 2030 (US$ Million)
- Figure 40. Animal Nutrition Market Revenue and Forecasts To 2030 (US$ Million)
- Figure 41. Pharmaceuticals and Nutraceuticals Market Revenue and Forecasts To 2030 (US$ Million)
- Figure 42. US Edible Oils and Fats Market Breakdown by Regions, 2022 And 2030 (%)
- Figure 43. Northeast Edible Oils and Fats Market Revenue and Forecasts To 2030 (US$ Million)
- Figure 44. Northeast Edible Oils and Fats Market Volume and Forecasts To 2030 (Kilo Tons)
- Figure 45. Southwest Edible Oils and Fats Market Revenue and Forecasts To 2030 (US$ Million)
- Figure 46. Southwest Edible Oils and Fats Market Volume and Forecasts To 2030 (Kilo Tons)
- Figure 47. West Edible Oils and Fats Market Revenue and Forecasts To 2030 (US$ Million)
- Figure 48. West Edible Oils and Fats Market Volume and Forecasts To 2030 (Kilo Tons)
- Figure 49. Southeast Edible Oils and Fats Market Revenue and Forecasts To 2030 (US$ Million)
- Figure 50. Southeast Edible Oils and Fats Market Volume and Forecasts To 2030 (Kilo Tons)
- Figure 51. Midwest Edible Oils and Fats Market Revenue and Forecasts To 2030 (US$ Million)
- Figure 52. Midwest Edible Oils and Fats Market Volume and Forecasts To 2030 (Kilo Tons)
- Figure 53. Company Positioning & Concentration
The US edible oils and fats market size was valued at US$ 9.52 billion in 2022 and is projected to reach US$ 13.11 billion by 2030; it is expected to register a CAGR of 4.1% from 2023 to 2030.
Edible oils are common vegetable oils including soybean oil, sunflower oil, and others. At room temperature, oils are liquid, while fats are partially solid. Edible oils are mainly sourced from soybean, coconut, rapeseed, palm, sunflower, and cottonseed. Oils and fats improve taste of the food and provide good texture to the final product. Edible oils are commonly used in industrial food manufacturing and home cooking worldwide and are the primary source of unsaturated fats and vitamin E in human diets. The growing importance of edible oils and fats as a key source of several nutrients, including vitamin E, selenium, phytosterols, and magnesium, in the food & beverages industry is expected to remain a favorable factor in the coming years. These factors are expected to drive the market in the US during the forecast period.
The demand for plant-based and low-fat products is increasing with rising health consciousness among consumers. Thus, manufacturers are developing plant-based shortenings and low-fat oils to cater to the rising demand. Plant-based shortenings are non-hydrogenated and contain no cholesterol and trans-fat. Thus, it is considered a healthier alternative. Moreover, the increasing problems of cardiovascular diseases, obesity, and diabetes over the years have triggered the demand for low-fat products and are expected to boost the demand for low-fat oils among various industries such bakery & confectioneries, dairy & frozen desserts, snacking, etc.
Consumers have been inclined toward plant-based products as they consider them healthier than conventional products. In addition, rising awareness regarding animal protection and environmental sustainability are the major factors creating the popularity of these plant-based products. As per the data published by "Veganuary"-a nonprofit organization encouraging people to go vegan for the whole month of January-in 2021, ~5.8 million people registered for the "Veganuary Campaign." Thus, the rising veganism trend and increasing demand for plant-based shortening and low-fat oils among various end-use industries to cater to the rising demand from consumers is creating lucrative growth opportunities in the edible oils and fats market.
Bunge Ltd, Archer-Daniels-Midland Co, Fuji Oil Co Ltd, Kao Corp, AAK AB, J-Oil Mills Inc, Cargill Inc, Olam Group Ltd, ConnOils LLC, and Louis Dreyfus Co BV are the key players operating in the US edible oils and fats market. These market players are focusing on providing high-quality, innovative products to fulfill customers' demands and increase their US edible oils and fats market share.
The overall US edible oils and fats market size has been derived using both primary and secondary sources. To begin the research process, exhaustive secondary research has been conducted using internal and external sources to obtain qualitative and quantitative information about the market. Also, multiple primary interviews have been conducted with industry participants to validate the data and gain analytical insights into the topic. Participants in this process include industry experts, such as VPs, business development managers, market intelligence managers, and national sales managers, along with external consultants, such as valuation experts, research analysts, and key opinion leaders, specializing in the US edible oils and fats market.
Reasons to Buy:
- Highlights key business priorities in order to assist companies to realign their business strategies.
- The key findings and recommendations highlight crucial progressive industry trends in the US edible oils and fats market, thereby allowing players to develop effective long-term strategies.
- Develop/modify business expansion plans by using substantial growth offering developed and emerging markets.
- Scrutinize in-depth the market trends and outlook coupled with the factors driving the market, as well as those hindering it.
- Enhance the decision-making process by understanding the strategies that underpin commercial interest with respect to products, segmentation, and industry verticals.
Table Of Contents
1. Introduction
- 1.1 The Insight Partners Research Report Guidance
- 1.2 Market Segmentation
2. Executive Summary
- 2.1 Key Insights
- 2.2 Market Attractiveness
3. Research Methodology
- 3.1 Coverage
- 3.2 Secondary Research
- 3.3 Primary Research
- 3.4 Limitations and Assumptions
4. US Edible Oils and Fats Market Landscape
- 4.1 Overview
- 4.2 Porter's Five Forces Analysis
- 4.2.1 Bargaining Power of Suppliers
- 4.2.2 Bargaining Power of Buyers
- 4.2.3 Threat of New Entrants
- 4.2.4 Competitive Rivalry
- 4.2.1 Threat of Substitutes
- 4.3 Ecosystem Analysis
- 4.3.1 List of Vendors
5. US Edible Oils and Fats Market - Key Market Dynamics
- 5.1 Market Drivers
- 5.1.1 Rising Demand for Edible Oils and Fats from Food & Beverage Processing Industry
- 5.1.2 Strategic Development Initiatives by Manufacturers
- 5.2 Market Restraints
- 5.2.1 Increasing Prices of Edible Oils
- 5.3 Market Opportunity
- 5.3.1 Growing Demand for Plant-based Shortenings and Low-fat Oils
- 5.4 Future Trend
- 5.4.1 Adoption of Microencapsulation Technology
- 5.5 Impact Analysis
6. Edible Oils and Fats Market - The US Market Analysis
- 6.1 US Edible Oils and Fats Market Revenue (US$ Million)
- 6.2 US Edible Oils and Fats Market Volume (Kilo Tons)
- 6.3 US Edible Oils and Fats Market Forecast and Analysis
7. US Edible Oils and Fats Market Analysis - Type
- 7.1 Oils
- 7.1.1 Overview
- 7.1.2 Oils Market Revenue and Forecast to 2030 (US$ Million)
- 7.1.3 Oils Market Volume and Forecast to 2030 (Kilo Tons)
- 7.1.4 Soybean Oil
- 7.1.4.1 Overview
- 7.1.4.2 Soybean Oil Market Revenue and Forecast to 2030 (US$ Million)
- 7.1.4.3 Soybean Oil Market Volume and Forecast to 2030 (Kilo Tons)
- 7.1.5 Sunflower Oil
- 7.1.5.1 Overview
- 7.1.5.2 Sunflower Oil Market Revenue and Forecast to 2030 (US$ Million)
- 7.1.5.3 Sunflower Oil Market Volume and Forecast to 2030 (Kilo Tons)
- 7.1.6 Palm Oil
- 7.1.6.1 Overview
- 7.1.6.2 Palm Oil Market Revenue and Forecast to 2030 (US$ Million)
- 7.1.6.3 Palm Oil Market Volume and Forecast to 2030 (Kilo Tons)
- 7.1.7 Canola Oil/Rapeseed Oil
- 7.1.7.1 Overview
- 7.1.7.2 Canola Oil/Rapeseed Oil Market Revenue and Forecast to 2030 (US$ Million)
- 7.1.7.3 Canola Oil/Rapeseed Oil Market Volume and Forecast to 2030 (Kilo Tons)
- 7.1.8 Others
- 7.1.8.1 Overview
- 7.1.8.2 Others Market Revenue and Forecast to 2030 (US$ Million)
- 7.1.8.3 Others Market Volume and Forecast to 2030 (Kilo Tons)
- 7.2 Fats
- 7.2.1 Overview
- 7.2.2 Fats Market Revenue and Forecast to 2030 (US$ Million)
- 7.2.3 Fats Market Volume and Forecast to 2030 (Kilo Tons)
- 7.2.4 Butter
- 7.2.4.1 Overview
- 7.2.4.2 Butter Market Revenue and Forecast to 2030 (US$ Million)
- 7.2.4.3 Butter Market Volume and Forecast to 2030 (Kilo Tons)
- 7.2.5 Margarine
- 7.2.5.1 Overview
- 7.2.5.2 Margarine Market Revenue and Forecast to 2030 (US$ Million)
- 7.2.5.3 Margarine Market Volume and Forecast to 2030 (Kilo Tons)
- 7.2.6 Palm Oil Based Shortening
- 7.2.6.1 Overview
- 7.2.6.2 Palm Oil Based Shortening Market Revenue and Forecast to 2030 (US$ Million)
- 7.2.6.3 Palm Oil Based Shortening Market Volume and Forecast to 2030 (Kilo Tons)
- 7.2.7 Vegetable Oil Based Shortening
- 7.2.7.1 Overview
- 7.2.7.2 Vegetable Oil Based Shortening Market Revenue and Forecast to 2030 (US$ Million)
- 7.2.7.3 Vegetable Oil Based Shortening Market Volume and Forecast to 2030 (Kilo Tons)
- 7.2.8 Others
- 7.2.8.1 Overview
- 7.2.8.2 Others Market Revenue and Forecast to 2030 (US$ Million)
- 7.2.8.3 Others Market Volume and Forecast to 2030 (Kilo Tons)
8. US Edible Oils and Fats Market Analysis - Application
- 8.1 Food and Beverages
- 8.1.1 Overview
- 8.1.2 Food and Beverages Market Revenue, and Forecast to 2030 (US$ Million)
- 8.1.3 Bakery and Confectionery
- 8.1.3.1 Overview
- 8.1.3.2 Bakery and Confectionery Market Revenue, and Forecast to 2030 (US$ Million)
- 8.1.4 Dairy and Frozen Desserts
- 8.1.4.1 Overview
- 8.1.4.2 Dairy and Frozen Desserts Market Revenue, and Forecast to 2030 (US$ Million)
- 8.1.5 RTE and RTC Meals
- 8.1.5.1 Overview
- 8.1.5.2 RTE and RTC Meals Market Revenue, and Forecast to 2030 (US$ Million)
- 8.1.6 Snacks
- 8.1.6.1 Overview
- 8.1.6.2 Snacks Market Revenue, and Forecast to 2030 (US$ Million)
- 8.1.7 Others
- 8.1.7.1 Overview
- 8.1.7.2 Others Market Revenue, and Forecast to 2030 (US$ Million)
- 8.2 Animal Nutrition
- 8.2.1 Overview
- 8.2.2 Animal Nutrition Market Revenue, and Forecast to 2030 (US$ Million)
- 8.3 Pharmaceuticals and Nutraceuticals
- 8.3.1 Overview
- 8.3.2 Pharmaceuticals and Nutraceuticals Market Revenue and Forecast to 2030 (US$ Million)
9. US Edible Oils and Fats Market - Regional Analysis
- 9.1 US Edible Oils and Fats Market
- 9.1.1 Overview
- 9.1.2 US Edible Oils and Fats Market Breakdown by Region
- 9.1.2.1 Edible Oils and Fats Market Breakdown by Region
- 9.1.2.2 Northeast Edible Oils and Fats Market Revenue and Forecasts To 2030 (US$ Million)
- 9.1.2.3 Northeast Edible Oils and Fats Market Volume and Forecasts To 2030 (Kilo Tons)
- 9.1.2.3.1 Northeast Edible Oils and Fats Market Breakdown by Type
- 9.1.2.3.2 Northeast Edible Oils and Fats Market Breakdown by Application
- 9.1.2.4 Southwest Edible Oils and Fats Market Revenue and Forecasts To 2030 (US$ Million)
- 9.1.2.5 Southwest Edible Oils and Fats Market Volume and Forecasts To 2030 (Kilo Tons)
- 9.1.2.5.1 Southwest Edible Oils and Fats Market Breakdown by Type
- 9.1.2.5.2 Southwest Edible Oils and Fats Market Breakdown by Application
- 9.1.2.6 West Edible Oils and Fats Market Revenue and Forecasts To 2030 (US$ Million)
- 9.1.2.7 West Edible Oils and Fats Market Volume and Forecasts To 2030 (Kilo Tons)
- 9.1.2.7.1 West Edible Oils and Fats Market Breakdown by Type
- 9.1.2.7.2 West Edible Oils and Fats Market Breakdown by Application
- 9.1.2.8 Southeast Edible Oils and Fats Market Revenue and Forecasts To 2030 (US$ Million)
- 9.1.2.9 Southeast Edible Oils and Fats Market Volume and Forecasts To 2030 (Kilo Tons)
- 9.1.2.9.1 Southeast Edible Oils and Fats Market Breakdown by Type
- 9.1.2.9.2 Southeast Edible Oils and Fats Market Breakdown by Application
- 9.1.2.10 Midwest Edible Oils and Fats Market Revenue and Forecasts To 2030 (US$ Million)
- 9.1.2.11 Midwest Edible Oils and Fats Market Volume and Forecasts To 2030 (Kilo Tons)
- 9.1.2.11.1 Midwest Edible Oils and Fats Market Breakdown by Type
- 9.1.2.11.2 Midwest Edible Oils and Fats Market Breakdown by Application
10. Impact of COVID-19 Pandemic on US Edible Oils and Fats Market
- 10.1 Pre & Post COVID-19 Impact on US Edible Oil and Fats Market
11. Competitive Landscape
- 11.1 Heat Map Analysis by Key Players
- 11.2 Company Positioning & Concentration
12. Company Profiles
- 12.1 Bunge Ltd
- 12.1.1 Key Facts
- 12.1.2 Business Description
- 12.1.3 Products and Services
- 12.1.4 Financial Overview
- 12.1.5 SWOT Analysis
- 12.1.6 Key Developments
- 12.2 Archer-Daniels-Midland Co
- 12.2.1 Key Facts
- 12.2.2 Business Description
- 12.2.3 Products and Services
- 12.2.4 Financial Overview
- 12.2.5 SWOT Analysis
- 12.2.6 Key Developments
- 12.3 Fuji Oil Co Ltd
- 12.3.1 Key Facts
- 12.3.2 Business Description
- 12.3.3 Products and Services
- 12.3.4 Financial Overview
- 12.3.5 SWOT Analysis
- 12.3.6 Key Developments
- 12.4 Kao Corp
- 12.4.1 Key Facts
- 12.4.2 Business Description
- 12.4.3 Products and Services
- 12.4.4 Financial Overview
- 12.4.5 SWOT Analysis
- 12.4.6 Key Developments
- 12.5 AAK AB
- 12.5.1 Key Facts
- 12.5.2 Business Description
- 12.5.3 Products and Services
- 12.5.4 Financial Overview
- 12.5.5 SWOT Analysis
- 12.5.6 Key Developments
- 12.6 J-Oil Mills Inc
- 12.6.1 Key Facts
- 12.6.2 Business Description
- 12.6.3 Products and Services
- 12.6.4 Financial Overview
- 12.6.5 SWOT Analysis
- 12.6.6 Key Developments
- 12.7 Cargill Inc
- 12.7.1 Key Facts
- 12.7.2 Business Description
- 12.7.3 Products and Services
- 12.7.4 Financial Overview
- 12.7.5 SWOT Analysis
- 12.7.6 Key Developments
- 12.8 Olam Group Ltd
- 12.8.1 Key Facts
- 12.8.2 Business Description
- 12.8.3 Products and Services
- 12.8.4 Financial Overview
- 12.8.5 SWOT Analysis
- 12.8.6 Key Developments
- 12.9 ConnOils LLC
- 12.9.1 Key Facts
- 12.9.2 Business Description
- 12.9.3 Products and Services
- 12.9.4 Financial Overview
- 12.9.5 SWOT Analysis
- 12.9.6 Key Developments
- 12.10 Louis Dreyfus Co BV
- 12.10.1 Key Facts
- 12.10.2 Business Description
- 12.10.3 Products and Services
- 12.10.4 Financial Overview
- 12.10.5 SWOT Analysis
- 12.10.6 Key Developments
