|
|
市場調査レポート
商品コード
1172005
ノンアルコール飲料市場の2028年までの予測-タイプ、パッケージタイプ、カテゴリー、流通チャネル別の世界分析Non-Alcoholic Beverages Market Forecast to 2028 - COVID-19 Impact and Global Analysis By Type, Packaging Type, Category, and Distribution Channel |
||||||
|
|
|||||||


| ノンアルコール飲料市場の2028年までの予測-タイプ、パッケージタイプ、カテゴリー、流通チャネル別の世界分析 |
|
出版日: 2022年11月23日
発行: The Insight Partners
ページ情報: 英文 254 Pages
納期: 即納可能
|
- 全表示
- 概要
- 図表
- 目次
ノンアルコール飲料の市場規模は、2022年の1兆3,271億1,000万米ドルから2028年には1兆9,028億5,000万米ドルに拡大すると予測されます。2022年から2028年までのCAGRは6.2%と推定されます。
ノンアルコール飲料には、炭酸飲料、ジュース・ネクター、ボトルウォーター、乳製品系飲料、代替乳製品飲料、RTDティー・コーヒー、スムージー、ノンアルコールビール、RTDモルト飲料・プレミックス、エネルギー・スポーツドリンクなどが含まれます。過去数年の間に、健康や栄養に関する意識は著しく高まりました。多忙な業務スケジュールや多忙なライフスタイルにより、人々は健康やフィットネスに集中できず、糖尿病、肥満、皮膚病、眼病、心臓病、がんなど、さまざまな健康問題を引き起こしています。人々は、健康を増進し、慢性疾患のリスクを軽減するために、栄養強化食品や飲食品にますますお金をかけるようになっています。このような要因が、機能性食品・飲料に対する大きな需要を生み出しました。機能性飲料は通常、タンパク質、ビタミン・ミネラル、良質な炭水化物、プロバイオティクスなど、消費者の特定の健康問題に対処するための栄養素を1種類以上含んでいます。機能性飲料は、身体の全体的な状態を向上させ、病気の進行リスクを低減させる。さらに、機能性飲料は体の水分補給を十分に行い、免疫力を高める。さらに、機能性飲料は、体重管理、腸と免疫の健康増進、皮膚と髪の健康増進など、目標とする個別の健康目標をサポートします。このような要因から、さまざまな年齢層の消費者の間で人気が高まっています。このように、機能性飲料に対する需要の高まりは、ノンアルコール飲料市場を牽引しています。
非アルコール飲料の世界市場は、流通チャネルに基づいて、スーパーマーケットおよびハイパーマーケット、コンビニエンスストア、オンライン小売、その他に区分されます。スーパーマーケット&ハイパーマーケット部門は、2021年の世界のノンアルコール飲料市場で最大のシェアを占めていますが、オンライン小売部門は2022年から2028年にかけて最も速いCAGRを記録すると予想されます。スーパーマーケットやハイパーマーケットは、パーソナルケア、食料品、家庭用品など幅広い製品を提供する巨大な小売施設です。これらの店舗では、さまざまなブランドの製品をリーズナブルな価格で提供しています。これらの店舗では、買い物客は適切な商品を見つけやすくなっています。さらに、これらの店舗では、魅力的な割引、複数の支払い方法、快適な顧客体験が提供されています。ノンアルコール飲料メーカーは通常、顧客の来店数が多いスーパーマーケットやハイパーマーケットでの販売を希望しています。また、多くの大手ノンアルコール飲料メーカーは、顧客との接触や幅広い流通網を理由に、Walmart、Aldi、Tescoなどの有名スーパーマーケットを通じて製品を販売しています。これらの要因が、同セグメントを牽引しています。
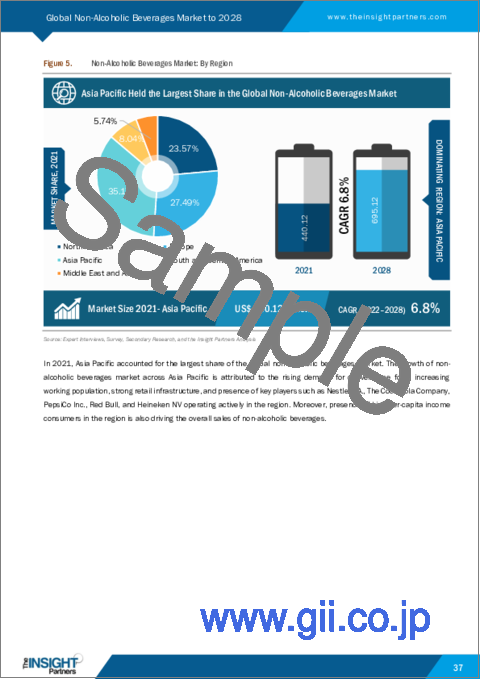
2021年、アジア太平洋地域は世界のノンアルコール飲料市場で最大の収益シェアを占めました。アジア太平洋地域の新興国では、健康志向の消費者が急増し、エナジードリンクや強化ジュースなどの非アルコール飲料の強い需要が生まれています。さらに、健康志向の高まり、アクティブなライフスタイルの必要性に対する意識の高まり、生活習慣病の蔓延が、健康志向の消費者に無糖の健康飲料を選択させる要因となっています。このような要因も、アジア太平洋地域のノンアルコール飲料市場の成長に寄与しています。さらに、日本や韓国などアジア太平洋地域の国々では乳糖不耐症の割合が高く、乳製品代替飲料の需要を牽引しています。また、インドネシア、日本、中国、マレーシアなどのアジア太平洋諸国では、お酒を飲まない傾向が強まっているため、ノー/ローアルコール・ビールやワインが高い需要を示しています。このような要因も、アジア太平洋地域のノンアルコール飲料市場の成長に好影響を与えています。
世界のノンアルコール飲料市場で事業を展開している主な企業は、The Coca-Cola Company、PepsiCo、Nestle、Red Bull、Suntory Holdings Limited、Danone S.A.、Califia Farms LLC、Keurig Dr. Pepper Inc、 Asahi Group Holdings Limited、 Bolthouse Farms Inc.などです。ノンアルコール飲料のメーカーは、消費者の要求の変化に対応した革新的な製品を発売するために、大きな投資を行っています。例えば、2019年3月、ザ・コカ・コーラ・カンパニーは、ミニッツメイドブランドでカシミール産リンゴ果汁を25%使用したスパークリングジュースを発売すると発表しました。このような革新的な製品は、予測期間においてノンアルコール飲料市場を牽引することが期待されます。
世界のノンアルコール飲料市場の全体規模は、一次情報および二次情報の両方を用いて導き出しました。調査プロセスを開始するにあたり、市場に関連する質的・量的情報を入手するため、社内外の情報源を用いて徹底的な二次調査を実施しました。また、データを検証し、テーマについてより分析的な洞察を得るために、業界関係者に複数の一次インタビューを実施しました。このプロセスの参加者には、副社長、事業開発マネージャー、市場情報マネージャー、国内販売マネージャーなどの業界専門家、およびノンアルコール飲料市場を専門とする評価専門家、調査アナリスト、キーオピニオンリーダーなどの外部コンサルタントが含まれています。
目次
第1章 イントロダクション
- 調査範囲
- インサイトパートナーズの調査報告書ガイダンス
- 市場セグメンテーション
第2章 重要なポイント
第3章 調査手法
- 調査範囲
- 調査手法
- データ収集
- 一次インタビュー
- 仮説の形成
- マクロ経済要因分析
- ベースナンバーの作成
- データの三角測量
- 国別データ
第4章 ノンアルコール飲料市場の情勢
- 市場概要
- ポーターのファイブフォース分析
- 供給企業の交渉力
- 買い手の交渉力
- 新規参入業者の脅威
- 競争企業間の競合関係
- 代替品の脅威
- 専門家の見解
- エコシステム分析
- ノンアルコール飲料市場の価格分析
第5章 ノンアルコール飲料市場:主要な市場力学
- 市場促進要因
- 機能性ノンアルコール飲料の需要増加
- ボトルウォーターの消費量増加
- スポーツドリンクの急速な普及
- 市場抑制要因
- 飲料の高糖度に関する懸念
- 市場機会
- クリーンラベルやオーガニック製品、リラックス飲料、向精神薬飲料などの革新的な製品の開発
- 消費者に訴求するための持続可能で革新的なパッケージング
- 今後の動向
- 植物性飲料の人気の高まり
- 促進要因と抑制要因のインパクト分析
第6章 ノンアルコール飲料の世界市場分析
- ノンアルコール飲料市場の概要
- 競合のポジショニング-主要な市場プレイヤー
第7章 ノンアルコール飲料の市場分析:タイプ別
- 市場概要
- ノンアルコール飲料のタイプ別市場(2021年、2028年)
- 炭酸飲料
- ジュース・ネクター
- ボトル入りの水
- 乳製品を使用した飲料
- 乳製品代替飲料
- RTD紅茶・コーヒー
- ノンアルコールビール
- モルト飲料
- その他
第8章 ノンアルコール飲料の市場分析:包装タイプ別
- ノンアルコール飲料市場:包装タイプ別(2021年、2028年)
- ボトル
- カートン
- 缶
- パウチ
第9章 ノンアルコール飲料市場分析:カテゴリ別
- ノンアルコール飲料市場:カテゴリー別(2021年、2028年)
- シュガーフリー
- コンベンショナル
第10章 ノンアルコール飲料市場分析:流通チャネル別
- ノンアルコール飲料市場:流通チャネル別(2021年、2028年)
- スーパーマーケット、ハイパーマーケット
- コンビニエンスストア
- オンラインショップ
- その他
第11章 ノンアルコール飲料市場:地域別分析
- 北米:ノンアルコール飲料市場
- 北米のノンアルコール飲料市場:タイプ別
- 北米のノンアルコール飲料市場:包装タイプ別
- 北米のノンアルコール飲料市場:カテゴリー別
- 北米のノンアルコール飲料市場:流通経路別
- 北米のノンアルコール飲料市場:主要国別
- 欧州ノンアルコール飲料市場
- 欧州のノンアルコール飲料市場:タイプ別
- 欧州のノンアルコール飲料市場:包装タイプ別
- 欧州のノンアルコール飲料市場:カテゴリー別
- 欧州のノンアルコール飲料市場:流通チャネル別
- 欧州のノンアルコール飲料市場:主要国別
- アジア太平洋地域のノンアルコール飲料市場
- アジア太平洋地域のノンアルコール飲料市場:タイプ別
- アジア太平洋地域のノンアルコール飲料市場:包装タイプ別
- アジア太平洋地域のノンアルコール飲料市場:カテゴリー別
- アジア太平洋地域のノンアルコール飲料市場:流通チャネル別
- アジア太平洋地域のノンアルコール飲料市場:主要国別
- 中東・アフリカ地域のノンアルコール飲料市場
- 中東・アフリカ地域のノンアルコール飲料市場:タイプ別
- 中東・アフリカ地域のノンアルコール飲料市場:包装タイプ別
- 中東・アフリカ地域のノンアルコール飲料市場:カテゴリー別
- 中東・アフリカ地域のノンアルコール飲料市場:流通経路別
- 中東・アフリカ地域のノンアルコール飲料市場:主要国別
- 中南米の各国市場中南米のノンアルコール飲料市場
- 中南米のノンアルコール飲料市場:タイプ別
- 中南米のノンアルコール飲料市場:包装タイプ別
- 中南米のノンアルコール飲料市場:カテゴリー別
- 中南米のノンアルコール飲料市場:流通経路別
- 中南米のノンアルコール飲料市場:主要国別
第12章 COVID-19のパンデミックによるノンアルコール飲料世界市場への影響
- COVID-19のノンアルコール飲料市場への影響
- 北米
- 欧州
- アジア太平洋地域
- 中東・アフリカ
- 中南米
第13章 業界の情勢
- パートナーシップ
- 新製品開発
- 事業拡大
第14章 企業プロファイル
- The Coca-Cola Company
- Nestle S.A.
- Red Bull
- Califia Farms, LLC
- Keurig Dr Pepper, Inc.
- Asahi Group Holdings, Ltd.
- Danone S.A.
- SUNTORY HOLDINGS LIMITED
- Bolthouse Farms, Inc.
- PepsiCo Inc.
- Heineken NV
- Coolberg Beverages Pvt Ltd
- Goya Foods Inc
- Anheuser-Busch InBev NV
- Carlsberg AS
第15章 付録
- The Insight Partners について
- 用語解説
List Of Tables
- Table 1. Global Average Price Range, by Type, 2020
- Table 2. Non-Alcoholic Beverages Market -Revenue and Forecast to 2028 (US$ Billion)
- Table 3. Global Non-Alcoholic Beverages Market, by Type - Revenue and Forecast to 2028 (US$ Billion)
- Table 4. Global Non-Alcoholic Beverages Market, by Packaging Type - Revenue and Forecast to 2028 (US$ Billion)
- Table 5. Global Non-Alcoholic Beverages Market, by Category - Revenue and Forecast to 2028 (US$ Billion)
- Table 6. Global Non-Alcoholic Beverages Market, by Distribution Channel - Revenue and Forecast to 2028 (US$ Billion)
- Table 7. North America Non-Alcoholic Beverages Market, By Type - Revenue and Forecast to 2028 (US$ Billion)
- Table 8. North America Non-Alcoholic Beverages Market, by Packaging Type- Revenue and Forecast to 2028 (US$ Billion)
- Table 9. North America Non-Alcoholic Beverages Market, by Category- Revenue and Forecast to 2028 (US$ Billion)
- Table 10. North America Non-Alcoholic Beverages Market, by Distribution Channel- Revenue and Forecast to 2028 (US$ Billion)
- Table 11. US Non-Alcoholic Beverages Market, by Type - Revenue and Forecast to 2028 (US$ Billion)
- Table 12. US Non-Alcoholic Beverages Market, by Packaging Type- Revenue and Forecast to 2028 (US$ Billion)
- Table 13. US Non-Alcoholic Beverages Market, by Category- Revenue and Forecast to 2028 (US$ Billion)
- Table 14. US Non-Alcoholic Beverages Market, by Distribution Channel- Revenue and Forecast to 2028 (US$ Billion)
- Table 15. Canada Non-Alcoholic Beverages Market, By Type - Revenue and Forecast to 2028 (US$ Billion)
- Table 16. Canada Non-Alcoholic Beverages Market, by Packaging Type- Revenue and Forecast to 2028 (US$ Billion)
- Table 17. Canada Non-Alcoholic Beverages Market, by Category- Revenue and Forecast to 2028 (US$ Billion)
- Table 18. Canada Non-Alcoholic Beverages Market, by Distribution Channel- Revenue and Forecast to 2028 (US$ Billion)
- Table 19. Mexico Non-Alcoholic Beverages Market, By Type - Revenue and Forecast to 2028 (US$ Billion)
- Table 20. Mexico Non-Alcoholic Beverages Market, by Packaging Type- Revenue and Forecast to 2028 (US$ Billion)
- Table 21. Mexico Non-Alcoholic Beverages Market, by Category- Revenue and Forecast to 2028 (US$ Billion)
- Table 22. Mexico Non-Alcoholic Beverages Market, by Distribution Channel- Revenue and Forecast to 2028 (US$ Billion)
- Table 23. Europe: Non-Alcoholic Beverages Market, By Type - Revenue and Forecast to 2028 (US$ Billion)
- Table 24. Europe Non-Alcoholic Beverages Market, by Packaging Type- Revenue and Forecast to 2028 (US$ Billion)
- Table 25. Europe Non-Alcoholic Beverages Market, by Category- Revenue and Forecast to 2028 (US$ Billion)
- Table 26. Europe Non-Alcoholic Beverages Market, by Distribution Channel - Revenue and Forecast to 2028 (US$ Billion)
- Table 27. Germany Non-Alcoholic Beverages Market, By Type - Revenue and Forecast to 2028 (US$ Billion)
- Table 28. Germany Non-Alcoholic Beverages Market, by Packaging Type- Revenue and Forecast to 2028 (US$ Billion)
- Table 29. Germany Non-Alcoholic Beverages Market, by Category - Revenue and Forecast to 2028 (US$ Billion)
- Table 30. Germany Non-Alcoholic Beverages Market, by Distribution Channel- Revenue and Forecast to 2028 (US$ Billion)
- Table 31. France Non-Alcoholic Beverages Market, By Type - Revenue and Forecast to 2028 (US$ Billion)
- Table 32. France Non-Alcoholic Beverages Market, by Packaging Type- Revenue and Forecast to 2028 (US$ Billion)
- Table 33. France Non-Alcoholic Beverages Market, by Category- Revenue and Forecast to 2028 (US$ Billion)
- Table 34. France Non-Alcoholic Beverages Market, by Distribution Channel- Revenue and Forecast to 2028 (US$ Billion)
- Table 35. UK Non-Alcoholic Beverages Market, By Type - Revenue and Forecast to 2028 (US$ Billion)
- Table 36. UK Non-Alcoholic Beverages Market, by Packaging Type- Revenue and Forecast to 2028 (US$ Billion)
- Table 37. UK Non-Alcoholic Beverages Market, by Category - Revenue and Forecast to 2028 (US$ Billion)
- Table 38. UK Non-Alcoholic Beverages Market, by Distribution Channel- Revenue and Forecast to 2028 (US$ Billion)
- Table 39. Italy Non-Alcoholic Beverages Market, By Type - Revenue and Forecast to 2028 (US$ Billion)
- Table 40. Italy Non-Alcoholic Beverages Market, by Packaging Type - Revenue and Forecast to 2028 (US$ Billion)
- Table 41. Italy Non-Alcoholic Beverages Market, by Category- Revenue and Forecast to 2028 (US$ Billion)
- Table 42. Italy Non-Alcoholic Beverages Market, by Distribution Channel- Revenue and Forecast to 2028 (US$ Billion)
- Table 43. Russia Non-Alcoholic Beverages Market, By Type - Revenue and Forecast to 2028 (US$ Billion)
- Table 44. Russia Non-Alcoholic Beverages Market, by Packaging Type - Revenue and Forecast to 2028 (US$ Billion)
- Table 45. Russia Non-Alcoholic Beverages Market, by Category- Revenue and Forecast to 2028 (US$ Billion)
- Table 46. Russia Non-Alcoholic Beverages Market, by Distribution Channel- Revenue and Forecast to 2028 (US$ Billion)
- Table 47. Rest of Europe Non-Alcoholic Beverages Market, By Type - Revenue and Forecast to 2028 (US$ Billion)
- Table 48. Rest of Europe Non-Alcoholic Beverages Market, by Packaging Type- Revenue and Forecast to 2028 (US$ Billion)
- Table 49. Rest of Europe Non-Alcoholic Beverages Market, by Category- Revenue and Forecast to 2028 (US$ Billion)
- Table 50. Rest of Europe Non-Alcoholic Beverages Market, by Distribution Channel- Revenue and Forecast to 2028 (US$ Billion)
- Table 51. Asia Pacific Non-Alcoholic Beverages Market, By Type - Revenue and Forecast to 2028 (US$ Billion)
- Table 52. Asia Pacific Non-Alcoholic Beverages Market, by Packaging Type- Revenue and Forecast to 2028 (US$ Billion)
- Table 53. Asia Pacific Non-Alcoholic Beverages Market, by Category- Revenue and Forecast to 2028 (US$ Billion)
- Table 54. Asia Pacific Non-Alcoholic Beverages Market, by Distribution Channel- Revenue and Forecast to 2028 (US$ Billion)
- Table 55. China Non-Alcoholic Beverages Market, By Type - Revenue and Forecast to 2028 (US$ Billion)
- Table 56. China Non-Alcoholic Beverages Market, by Packaging Type- Revenue and Forecast to 2028 (US$ Billion)
- Table 57. China Non-Alcoholic Beverages Market, by Category- Revenue and Forecast to 2028 (US$ Billion)
- Table 58. China Non-Alcoholic Beverages Market, by Distribution Channel- Revenue and Forecast to 2028 (US$ Billion)
- Table 59. Japan Non-Alcoholic Beverages Market, By Type - Revenue and Forecast to 2028 (US$ Billion)
- Table 60. Japan Non-Alcoholic Beverages Market, by Packaging Type- Revenue and Forecast to 2028 (US$ Billion)
- Table 61. Japan Non-Alcoholic Beverages Market, by Category - Revenue and Forecast to 2028 (US$ Billion)
- Table 62. Japan Non-Alcoholic Beverages Market, by Distribution Channel- Revenue and Forecast to 2028 (US$ Billion)
- Table 63. India Non-Alcoholic Beverages Market, By Type - Revenue and Forecast to 2028 (US$ Billion)
- Table 64. India Non-Alcoholic Beverages Market, by Packaging Type- Revenue and Forecast to 2028 (US$ Billion)
- Table 65. India Non-Alcoholic Beverages Market, by Category- Revenue and Forecast to 2028 (US$ Billion)
- Table 66. India Non-Alcoholic Beverages Market, by Distribution Channel- Revenue and Forecast to 2028 (US$ Billion)
- Table 67. Australia Non-Alcoholic Beverages Market, By Type- Revenue and Forecast to 2028 (US$ Billion)
- Table 68. Australia Non-Alcoholic Beverages Market, by Packaging Type- Revenue and Forecast to 2028 (US$ Billion)
- Table 69. Australia Non-Alcoholic Beverages Market, by Category- Revenue and Forecast to 2028 (US$ Billion)
- Table 70. Australia Non-Alcoholic Beverages Market, by Distribution Channel - Revenue and Forecast to 2028 (US$ Billion)
- Table 71. South Korea Non-Alcoholic Beverages Market, By Type - Revenue and Forecast to 2028 (US$ Billion)
- Table 72. South Korea Non-Alcoholic Beverages Market, by Packaging Type - Revenue and Forecast to 2028 (US$ Billion)
- Table 73. South Korea Non-Alcoholic Beverages Market, by Category- Revenue and Forecast to 2028 (US$ Billion)
- Table 74. South Korea Non-Alcoholic Beverages Market, by Distribution Channel- Revenue and Forecast to 2028 (US$ Billion)
- Table 75. Indonesia Non-Alcoholic Beverages Market, By Type - Revenue and Forecast to 2028 (US$ Billion)
- Table 76. Indonesia Non-Alcoholic Beverages Market, by Packaging Type- Revenue and Forecast to 2028 (US$ Billion)
- Table 77. Indonesia Non-Alcoholic Beverages Market, by Category- Revenue and Forecast to 2028 (US$ Billion)
- Table 78. Indonesia Non-Alcoholic Beverages Market, by Distribution Channel- Revenue and Forecast to 2028 (US$ Billion)
- Table 79. Philippines Non-Alcoholic Beverages Market, By Type - Revenue and Forecast to 2028 (US$ Billion)
- Table 80. Philippines Non-Alcoholic Beverages Market, by Packaging Type- Revenue and Forecast to 2028 (US$ Billion)
- Table 81. Philippines Non-Alcoholic Beverages Market, by Category- Revenue and Forecast to 2028 (US$ Billion)
- Table 82. Philippines Non-Alcoholic Beverages Market, by Distribution Channel- Revenue and Forecast to 2028 (US$ Billion)
- Table 83. Rest of Asia Pacific Non-Alcoholic Beverages Market, By Type - Revenue and Forecast to 2028 (US$ Billion)
- Table 84. Rest of Asia Pacific Non-Alcoholic Beverages Market, by Packaging Type- Revenue and Forecast to 2028 (US$ Billion)
- Table 85. Rest of Asia Pacific Non-Alcoholic Beverages Market, by Category- Revenue and Forecast to 2028 (US$ Billion)
- Table 86. Rest of Asia Pacific Non-Alcoholic Beverages Market, by Distribution Channel- Revenue and Forecast to 2028 (US$ Billion)
- Table 87. Middle East & Africa Non-Alcoholic Beverages Market, By Type- Revenue and Forecast to 2028 (US$ Billion)
- Table 88. Middle East & Africa Non-Alcoholic Beverages Market, by Packaging Type- Revenue and Forecast to 2028 (US$ Billion)
- Table 89. Middle East & Africa Non-Alcoholic Beverages Market, by Category- Revenue and Forecast to 2028 (US$ Billion)
- Table 90. Middle East & Africa Non-Alcoholic Beverages Market, by Distribution Channel- Revenue and Forecast to 2028 (US$ Billion)
- Table 91. South Africa Non-Alcoholic Beverages Market, By Type - Revenue and Forecast to 2028 (US$ Billion)
- Table 92. South Africa Non-Alcoholic Beverages Market, by Packaging Type - Revenue and Forecast to 2028 (US$ Billion)
- Table 93. South Africa Non-Alcoholic Beverages Market, by Category - Revenue and Forecast to 2028 (US$ Billion)
- Table 94. South Africa Non-Alcoholic Beverages Market, by Distribution Channel - Revenue and Forecast to 2028 (US$ Billion)
- Table 95. Saudi Arabia Non-Alcoholic Beverages Market, By Type - Revenue and Forecast to 2028 (US$ Billion)
- Table 96. Saudi Arabia Non-Alcoholic Beverages Market, by Packaging Type- Revenue and Forecast to 2028 (US$ Billion)
- Table 97. Saudi Arabia Non-Alcoholic Beverages Market, by Category - Revenue and Forecast to 2028 (US$ Billion)
- Table 98. Saudi Arabia Non-Alcoholic Beverages Market, by Distribution Channel - Revenue and Forecast to 2028 (US$ Billion)
- Table 99. UAE Non-Alcoholic Beverages Market, By Type - Revenue and Forecast to 2028 (US$ Billion)
- Table 100. UAE Non-Alcoholic Beverages Market, by Packaging Type - Revenue and Forecast to 2028 (US$ Billion)
- Table 101. UAE Non-Alcoholic Beverages Market, by Category- Revenue and Forecast to 2028 (US$ Billion)
- Table 102. UAE Non-Alcoholic Beverages Market, by Distribution Channel - Revenue and Forecast to 2028 (US$ Billion)
- Table 103. Oman Non-Alcoholic Beverages Market, By Type - Revenue and Forecast to 2028 (US$ Billion)
- Table 104. Oman Non-Alcoholic Beverages Market, by Packaging Type- Revenue and Forecast to 2028 (US$ Billion)
- Table 105. Oman Non-Alcoholic Beverages Market, by Category - Revenue and Forecast to 2028 (US$ Billion)
- Table 106. Oman Non-Alcoholic Beverages Market, by Distribution Channel - Revenue and Forecast to 2028 (US$ Billion)
- Table 107. Iran Non-Alcoholic Beverages Market, By Type - Revenue and Forecast to 2028 (US$ Billion)
- Table 108. Iran Non-Alcoholic Beverages Market, by Packaging Type- Revenue and Forecast to 2028 (US$ Billion)
- Table 109. Iran Non-Alcoholic Beverages Market, by Category - Revenue and Forecast to 2028 (US$ Billion)
- Table 110. Iran Non-Alcoholic Beverages Market, by Distribution Channel - Revenue and Forecast to 2028 (US$ Billion)
- Table 111. Kuwait Non-Alcoholic Beverages Market, By Type - Revenue and Forecast to 2028 (US$ Billion)
- Table 112. Kuwait Non-Alcoholic Beverages Market, by Packaging Type- Revenue and Forecast to 2028 (US$ Billion)
- Table 113. Kuwait Non-Alcoholic Beverages Market, by Category - Revenue and Forecast to 2028 (US$ Billion)
- Table 114. Kuwait Non-Alcoholic Beverages Market, by Distribution Channel - Revenue and Forecast to 2028 (US$ Billion)
- Table 115. Egypt Non-Alcoholic Beverages Market, By Type - Revenue and Forecast to 2028 (US$ Billion)
- Table 116. Egypt Non-Alcoholic Beverages Market, by Packaging Type- Revenue and Forecast to 2028 (US$ Billion)
- Table 117. Egypt Non-Alcoholic Beverages Market, by Category - Revenue and Forecast to 2028 (US$ Billion)
- Table 118. Egypt Non-Alcoholic Beverages Market, by Distribution Channel - Revenue and Forecast to 2028 (US$ Billion)
- Table 119. Rest of Middle East & Africa Non-Alcoholic Beverages Market, By Type - Revenue and Forecast to 2028 (US$ Billion)
- Table 120. Rest of Middle East & Africa Non-Alcoholic Beverages Market, by Packaging Type - Revenue and Forecast to 2028 (US$ Billion)
- Table 121. Rest of Middle East & Africa Non-Alcoholic Beverages Market, by Category - Revenue and Forecast to 2028 (US$ Billion)
- Table 122. Rest of Middle East & Africa Non-Alcoholic Beverages Market, by Distribution Channel - Revenue and Forecast to 2028 (US$ Billion)
- Table 123. South & Central America Non-Alcoholic Beverages Market, By Type - Revenue and Forecast to 2028 (US$ Billion)
- Table 124. South & Central America Non-Alcoholic Beverages Market, by Packaging Type - Revenue and Forecast to 2028 (US$ Billion)
- Table 125. South & Central America Non-Alcoholic Beverages Market, by Category - Revenue and Forecast to 2028 (US$ Billion)
- Table 126. South & Central America Non-Alcoholic Beverages Market, by Distribution Channel - Revenue and Forecast to 2028 (US$ Billion)
- Table 127. Brazil Non-Alcoholic Beverages Market, By Type - Revenue and Forecast to 2028 (US$ Billion)
- Table 128. Brazil Non-Alcoholic Beverages Market, by Packaging Type - Revenue and Forecast to 2028 (US$ Billion)
- Table 129. Brazil Non-Alcoholic Beverages Market, by Category - Revenue and Forecast to 2028 (US$ Billion)
- Table 130. Brazil Non-Alcoholic Beverages Market, by Distribution Channel - Revenue and Forecast to 2028 (US$ Billion)
- Table 131. Argentina Non-Alcoholic Beverages Market, By Type - Revenue and Forecast to 2028 (US$ Billion)
- Table 132. Argentina Non-Alcoholic Beverages Market, by Packaging Type - Revenue and Forecast to 2028 (US$ Billion)
- Table 133. Argentina Non-Alcoholic Beverages Market, by Category - Revenue and Forecast to 2028 (US$ Billion)
- Table 134. Argentina Non-Alcoholic Beverages Market, by Distribution Channel - Revenue and Forecast to 2028 (US$ Billion)
- Table 135. Rest of South & Central America Non-Alcoholic Beverages Market, By Type - Revenue and Forecast to 2028 (US$ Billion)
- Table 136. Rest of South & Central America Non-Alcoholic Beverages Market, by Packaging Type - Revenue and Forecast to 2028 (US$ Billion)
- Table 137. Rest of South & Central America Non-Alcoholic Beverages Market, by Category- Revenue and Forecast to 2028 (US$ Billion)
- Table 138. Rest of South & Central America Non-Alcoholic Beverages Market, by Distribution Channel - Revenue and Forecast to 2028 (US$ Billion)
- Table 139. List of Abbreviation
List Of Figures
- Figure 1. Non-Alcoholic Beverages Market Segmentation
- Figure 2. Non-Alcoholic Beverages Market Segmentation - By Geography
- Figure 3. Global Non-Alcoholic Beverages Market Overview
- Figure 4. Non-Alcoholic Beverages Market: By Category
- Figure 5. Non-Alcoholic Beverages Market: By Region
- Figure 6. Global Non-Alcoholic Beverages Market, Key Market Players
- Figure 7. Porter's Five Forces Analysis
- Figure 8. Expert Opinion
- Figure 9. Ecosystem: Non-Alcoholic Beverages Market
- Figure 10. Prevalence of Diabetes Among Men and Women of Age Group 20-79 in 2021
- Figure 11. Registrations for Veganuary Campaign from 2016 to 2022
- Figure 12. Global Non-Alcoholic Beverages Market Impact Analysis of Drivers and Restraints
- Figure 13. Geographic Overview of Non-Alcoholic Beverages Market
- Figure 14. Global: Non-Alcoholic Beverages Market - Revenue and Forecast to 2028 (US$ Billion)
- Figure 15. Key Players: Non-Alcoholic Beverages Market
- Figure 16. Non-Alcoholic Beverages Market Revenue Share, By Type (2021 and 2028)
- Figure 17. Carbonated Soft Drinks: Non-Alcoholic Beverages Market - Revenue and Forecast To 2028 (US$ Billion)
- Figure 18. Juices & Nectars: Non-Alcoholic Beverages Market - Revenue and Forecast To 2028 (US$ Billion)
- Figure 19. Sparkling Fruit Juices: Non-Alcoholic Beverages Market - Revenue and Forecast To 2028 (US$ Billion)
- Figure 20. Others: Non-Alcoholic Beverages Market - Revenue and Forecast To 2028 (US$ Billion)
- Figure 21. Bottled Waters: Non-Alcoholic Beverages Market - Revenue and Forecast To 2028 (US$ Billion)
- Figure 22. Dairy-Based Beverages: Non-Alcoholic Beverages Market - Revenue and Forecast To 2028 (US$ Billion)
- Figure 23. Annual Greenhouse Gas Emissions (GHG) Per Kilogram of Food and Beverage Product
- Figure 24. Dairy Alternative Beverages: Non-Alcoholic Beverages Market - Revenue and Forecast To 2028 (US$ Billion)
- Figure 25. RTD Tea and Coffee: Non-Alcoholic Beverages Market - Revenue and Forecast To 2028 (US$ Billion)
- Figure 26. Non-Alcoholic Beer: Non-Alcoholic Beverages Market - Revenue and Forecast To 2028 (US$ Billion)
- Figure 27. Malt Beverages: Non-Alcoholic Beverages Market - Revenue and Forecast To 2028 (US$ Billion)
- Figure 28. Others: Non-Alcoholic Beverages Market - Revenue and Forecast To 2028 (US$ Billion)
- Figure 29. Non-Alcoholic Beverages Market Revenue Share, By Packaging Type (2021 and 2028)
- Figure 30. Bottles: Non-Alcoholic Beverages Market - Revenue and Forecast To 2028 (US$ Billion)
- Figure 31. Cartons: Non-Alcoholic Beverages Market - Revenue and Forecast To 2028 (US$ Billion)
- Figure 32. Cans: Non-Alcoholic Beverages Market - Revenue and Forecast To 2028 (US$ Billion)
- Figure 33. Pouches: Non-Alcoholic Beverages Market - Revenue and Forecast To 2028 (US$ Billion)
- Figure 34. Non-Alcoholic Beverages Market Revenue Share, By Category (2021 and 2028)
- Figure 35. Sugar-Free: Non-Alcoholic Beverages Market- Revenue and Forecast To 2028 (US$ Billion)
- Figure 36. Conventional: Non-Alcoholic Beverages Market- Revenue and Forecast To 2028 (US$ Billion)
- Figure 37. Non-Alcoholic Beverages Market Revenue Share, By Distribution Channel (2021 and 2028)
- Figure 38. Supermarkets & Hypermarkets: Non-Alcoholic Beverages Market- Revenue and Forecast To 2028 (US$ Billion)
- Figure 39. Convenience Stores: Non-Alcoholic Beverages Market - Revenue and Forecast To 2028 (US$ Billion)
- Figure 40. Online Retail: Non-Alcoholic Beverages Market - Revenue and Forecast To 2028 (US$ Billion)
- Figure 41. Others: Non-Alcoholic Beverages Market - Revenue and Forecast To 2028 (US$ Billion)
- Figure 42. Global Non-Alcoholic Beverages Market Revenue Share, By Region (2021 and 2028)
- Figure 43. North America: Non-Alcoholic Beverages Market- Revenue and Forecast to 2028 (US$ Billion)
- Figure 44. North America: Non-Alcoholic Beverages Market Revenue Share, By Type (2021 and 2028)
- Figure 45. North America: Non-Alcoholic Beverages Market Revenue Share, by Packaging Type (2021 and 2028)
- Figure 46. North America: Non-Alcoholic Beverages Market Revenue Share, by Category (2021 and 2028)
- Figure 47. North America: Non-Alcoholic Beverages Market Revenue Share, by Distribution Channel (2021 and 2028)
- Figure 48. North America: Non-Alcoholic Beverages Market Revenue Share, by Key Country (2021 and 2028)
- Figure 49. US: Non-Alcoholic Beverages Market- Revenue and Forecast to 2028 (US$ Billion)
- Figure 50. Canada: Non-Alcoholic Beverages Market- Revenue and Forecast to 2028 (US$ Billion)
- Figure 51. Mexico: Non-Alcoholic Beverages Market- Revenue and Forecast to 2028 (US$ Billion)
- Figure 52. Europe: Non-Alcoholic Beverages Market- Revenue and Forecast to 2028 (US$ Billion)
- Figure 53. Europe: Non-Alcoholic Beverages Market Revenue Share, By Type (2021 and 2028)
- Figure 54. Europe: Non-Alcoholic Beverages Market Revenue Share, by Packaging Type (2021 and 2028)
- Figure 55. Europe: Non-Alcoholic Beverages Market Revenue Share, by Category (2021 and 2028)
- Figure 56. Europe: Non-Alcoholic Beverages Market Revenue Share, by Distribution Channel (2021 and 2028)
- Figure 57. Europe: Non-Alcoholic Beverages Market Revenue Share, by Key Country (2021 and 2028)
- Figure 58. Germany: Non-Alcoholic Beverages Market- Revenue and Forecast to 2028 (US$ Billion)
- Figure 59. France: Non-Alcoholic Beverages Market- Revenue and Forecast to 2028 (US$ Billion)
- Figure 60. UK: Non-Alcoholic Beverages Market- Revenue and Forecast to 2028 (US$ Billion)
- Figure 61. Italy: Non-Alcoholic Beverages Market- Revenue and Forecast to 2028 (US$ Billion)
- Figure 62. Russia: Non-Alcoholic Beverages Market- Revenue and Forecast to 2028 (US$ Billion)
- Figure 63. Rest of Europe: Non-Alcoholic Beverages Market- Revenue and Forecast to 2028 (US$ Billion)
- Figure 64. Asia Pacific: Non-Alcoholic Beverages Market- Revenue and Forecast to 2028 (US$ Billion)
- Figure 65. Asia Pacific: Non-Alcoholic Beverages Market Revenue Share, By Type (2021 and 2028)
- Figure 66. Asia Pacific: Non-Alcoholic Beverages Market Revenue Share, by Packaging Type (2021 and 2028)
- Figure 67. Asia Pacific: Non-Alcoholic Beverages Market Revenue Share, by Category (2021 and 2028)
- Figure 68. Asia Pacific: Non-Alcoholic Beverages Market Revenue Share, by Distribution Channel (2021 and 2028)
- Figure 69. Asia Pacific: Non-Alcoholic Beverages Market Revenue Share, by Key Country (2021 and 2028)
- Figure 70. China: Non-Alcoholic Beverages Market-Revenue and Forecast to 2028 (US$ Billion)
- Figure 71. Japan: Non-Alcoholic Beverages Market-Revenue and Forecast to 2028 (US$ Billion)
- Figure 72. India: Non-Alcoholic Beverages Market-Revenue and Forecast to 2028 (US$ Billion)
- Figure 73. Australia: Non-Alcoholic Beverages Market-Revenue and Forecast to 2028 (US$ Billion)
- Figure 74. South Korea: Non-Alcoholic Beverages Market-Revenue and Forecast to 2028 (US$ Billion)
- Figure 75. Indonesia: Non-Alcoholic Beverages Market-Revenue and Forecast to 2028 (US$ Billion)
- Figure 76. Philippines: Non-Alcoholic Beverages Market-Revenue and Forecast to 2028 (US$ Billion)
- Figure 77. Rest of Asia Pacific: Non-Alcoholic Beverages Market-Revenue and Forecast to 2028 (US$ Billion)
- Figure 78. Middle East & Africa: Non-Alcoholic Beverages Market- Revenue and Forecast to 2028 (US$ Billion)
- Figure 79. Middle East & Africa: Non-Alcoholic Beverages Market Revenue Share, By Type (2021 and 2028)
- Figure 80. Middle East & Africa: Non-Alcoholic Beverages Market Revenue Share, by Packaging Type (2021 and 2028)
- Figure 81. Middle East & Africa: Non-Alcoholic Beverages Market Revenue Share, by Category (2021 and 2028)
- Figure 82. Middle East & Africa: Non-Alcoholic Beverages Market Revenue Share, by Distribution Channel (2021 and 2028)
- Figure 83. Middle East & Africa: Non-Alcoholic Beverages Market Revenue Share, by Key Country (2021 and 2028)
- Figure 84. South Africa: Non-Alcoholic Beverages Market-Revenue and Forecast to 2028 (US$ Billion)
- Figure 85. Saudi Arabia: Non-Alcoholic Beverages Market-Revenue and Forecast to 2028 (US$ Billion)
- Figure 86. UAE: Non-Alcoholic Beverages Market-Revenue and Forecast to 2028 (US$ Billion)
- Figure 87. Oman: Non-Alcoholic Beverages Market-Revenue and Forecast to 2028 (US$ Billion)
- Figure 88. Iran: Non-Alcoholic Beverages Market-Revenue and Forecast to 2028 (US$ Billion)
- Figure 89. Kuwait: Non-Alcoholic Beverages Market-Revenue and Forecast to 2028 (US$ Billion)
- Figure 90. Egypt: Non-Alcoholic Beverages Market-Revenue and Forecast to 2028 (US$ Billion)
- Figure 91. Rest of Middle East & Africa: Non-Alcoholic Beverages Market-Revenue and Forecast to 2028 (US$ Billion)
- Figure 92. South & Central America: Non-Alcoholic Beverages Market- Revenue and Forecast to 2028 (US$ Billion)
- Figure 93. South & Central America: Non-Alcoholic Beverages Market Revenue Share, By Type (2021 and 2028)
- Figure 94. South & Central America: Non-Alcoholic Beverages Market Revenue Share, by Packaging Type (2021 and 2028)
- Figure 95. South & Central America: Non-Alcoholic Beverages Market Revenue Share, by Category (2021 and 2028)
- Figure 96. South & Central America: Non-Alcoholic Beverages Market Revenue Share, by Distribution Channel (2021 and 2028)
- Figure 97. South & Central America: Non-Alcoholic Beverages Market Revenue Share, by Key Country (2021 and 2028)
- Figure 98. Brazil: Non-Alcoholic Beverages Market- Revenue and Forecast to 2028 (US$ Billion)
- Figure 99. Argentina: Non-Alcoholic Beverages Market- Revenue and Forecast to 2028 (US$ Billion)
- Figure 100. Rest of South & Central America: Non-Alcoholic Beverages Market- Revenue and Forecast to 2028 (US$ Billion)
- Figure 101. Impact of COVID-19 Pandemic in North America Non-Alcoholic Beverages Market
- Figure 102. Impact of COVID-19 Pandemic in Europe Non-Alcoholic Beverages Market
- Figure 103. Impact of COVID-19 Pandemic in Asia-Pacific Non-Alcoholic Beverages Market
- Figure 104. Impact of COVID-19 Pandemic in the Middle East & Africa Non-Alcoholic Beverages Market
- Figure 105. Impact of COVID-19 Pandemic in South and Central America Non-Alcoholic Beverages Market
The non-alcoholic beverages market size is expected to grow from US$ 1,327.11 billion in 2022 to US$ 1,902.85 billion by 2028. It is estimated to grow at a CAGR of 6.2% from 2022 to 2028.
Non-alcoholic beverages include carbonated soft drinks, juices & nectars, bottled waters, dairy-based beverages, alternative dairy beverages, RTD tea & coffee, smoothies, non-alcoholic beers, RTD malt beverages and premixes, and energy and sports drinks. Over the past few years, awareness regarding health and nutrition increased significantly. Due to hectic working schedules and busy lifestyles, people cannot concentrate on their health and fitness, which leads to various health issues such as diabetes, obesity, skin diseases, eye problems, heart diseases, and cancer. People are increasingly spending on nutrient-enriched food and beverages to boost their health and reduce the risk of chronic diseases. This factor created a massive demand for functional food and beverages. Functional beverages usually contain one or more nutrients such as proteins, vitamins & minerals, good carbs, probiotics, and other nutrients that address specific health concerns of consumers. They enhance the overall physical state of the body and reduce the risk of disease progression. Furthermore, functional beverages keep the body well-hydrated and enhance immune health. Moreover, functional beverages support targeted and personalized health goals such as weight management, enhancing gut and immune health, and improving skin and hair health. This factor has enhanced their popularity among consumers of various age groups. Thus, the rising demand for functional beverages is driving the non-alcoholic beverages market.
Based on distribution channel, the global non-alcoholic beverages market is segmented into supermarkets & hypermarkets, convenience stores, online retail, and others. The supermarkets & hypermarkets segment held the largest share in the global non-alcoholic beverages market in 2021, whereas the online retail segment is expected to register the fastest CAGR from 2022 to 2028. Supermarkets and hypermarkets are huge retail establishments offering extensive products such as personal care, groceries, and household products. These stores provide products from various brands at a reasonable price. It is easier for shoppers to find the right product at these stores. Moreover, these stores offer attractive discounts, multiple payment options, and a pleasant customer experience. Non-alcoholic beverage manufacturers usually prefer selling their products through supermarkets and hypermarkets owing to heavy customer footfall. Moreover, many leading non-alcoholic beverage manufacturers sell their products through well-known supermarkets such as Walmart, Aldi, and Tesco, owing to their customer reach and wide distribution network. These factors are driving the segment.
In 2021, Asia Pacific held the largest revenue share of the global non-alcoholic beverages market. Emerging countries in Asia Pacific are witnessing a surge in health-conscious consumers, creating a strong demand for non-alcoholic beverages, including energy drinks and fortified juices. Further, rising health consciousness, increasing awareness of the need for an active lifestyle, and growing prevalence of lifestyle diseases are inspiring health-oriented consumers to opt for healthy and sugar-free drinks. This factor also contributes to the growth of the non-alcoholic beverages market across Asia Pacific. Further, there is a high prevalence of lactose intolerance in countries in Asia Pacific, such as Japan and South Korea, driving the demand for alternative dairy beverages. Also, no/low alcoholic beers and wines are witnessing high demand in countries in Asia Pacific, such as Indonesia, Japan, China, and Malaysia, due to the rising trend of booze-free drinking. This factor is also favoring the non-alcoholic beverages market growth across Asia Pacific.
Key players operating in the global non-alcoholic beverages market include The Coca-Cola Company, PepsiCo, Nestle, Red Bull, Suntory Holdings Limited, Danone S.A., Califia Farms LLC, Keurig Dr. Pepper Inc, Asahi Group Holdings Limited, and Bolthouse Farms Inc. The manufacturers of non-alcoholic beverages are making significant investments to launch innovative products that meet the changing requirements of consumers. For instance, in March 2019, The Coca-Cola Company announced the launch of sparkling juice with 25% Kashmiri apple juice under its Minute Maid brand. Such innovative products are expected to drive the non-alcoholic beverages market over the forecast period.
The overall size of the global non-alcoholic beverages market has been derived using both primary and secondary sources. To begin the research process, exhaustive secondary research has been conducted using internal and external sources to obtain qualitative and quantitative information related to the market. Also, multiple primary interviews have been conducted with industry participants to validate the data and gain more analytical insights into the topic. The participants of this process include industry experts such as VPs, business development managers, market intelligence managers, and national sales managers, along with external consultants such as valuation experts, research analysts, and key opinion leaders, specializing in the non-alcoholic beverages market.
Reasons to Buy:
Highlights key business priorities in order to assist companies to realign their business strategies.
The key findings and recommendations highlight crucial progressive industry trends in the global non-alcoholic beverages market, thereby allowing players to develop effective long-term strategies.
Develop/modify business expansion plans by using substantial growth offering developed and emerging markets.
Scrutinize in-depth the market trends and outlook coupled with the factors driving the market, as well as those hindering it.
Enhance the decision-making process by understanding the strategies that underpin commercial interest with respect to products, segmentation, and industry verticals.
Table Of Contents
1. Introduction
- 1.1 Study Scope
- 1.2 The Insight Partners Research Report Guidance
- 1.3 Market Segmentation
2. Key Takeaways
3. Research Methodology
- 3.1 Scope of the Study
- 3.2 Research Methodology
- 3.2.1 Data Collection:
- 3.2.2 Primary Interviews:
- 3.2.3 Hypothesis Formulation:
- 3.2.4 Macro-economic Factor Analysis:
- 3.2.5 Developing Base Number:
- 3.2.6 Data Triangulation:
- 3.2.7 Country Level Data:
4. Non-Alcoholic Beverages Market Landscape
- 4.1 Market Overview
- 4.2 Porter's Five Forces Analysis
- 4.2.1 Bargaining Power of Suppliers
- 4.2.2 Bargaining Power of Buyers
- 4.2.3 Threat of New Entrants
- 4.2.4 Competitive Rivalry
- 4.2.5 Threat of Substitutes
- 4.3 Expert Opinion
- 4.4 Ecosystem Analysis
- 4.5 Pricing Analysis: Non-Alcoholic Beverages Market
5. Non-Alcoholic Beverages Market - Key Market Dynamics
- 5.1 Market Drivers
- 5.1.1 Rising Demand for Non-Alcoholic Beverages with Functional Benefits
- 5.1.2 Increasing Consumption of Bottled Water
- 5.1.3 Surging Adoption of Sports Drinks
- 5.1 Market Restraints
- 5.1.1 Concerns Related to High-Sugar Content of Beverages
- 5.2 Market Opportunities
- 5.2.1 Development of Innovative Products such as Clean Label and Organic Products, Relaxation Drinks, and Nootropic Beverages
- 5.2.2 Sustainable and Innovative Packaging to Appeal to Consumers
- 5.3 Future Trends
- 5.3.1 Rising Popularity of Plant-Based Beverages
- 5.4 Impact Analysis of Drivers and Restraints
6. Non-Alcoholic Beverages - Global Market Analysis
- 6.1 Non-Alcoholic Beverages Market Overview
- 6.2 Non-Alcoholic Beverages Market -Revenue and Forecast to 2028 (US$ Billion)
- 6.3 Competitive Positioning - Key Market Players
7. Non-Alcoholic Beverages Market Analysis - By Type
- 7.1 Overview
- 7.2 Non-Alcoholic Beverages Market, By Type (2021 and 2028)
- 7.3 Carbonated Soft Drinks
- 7.3.1 Overview
- 7.3.2 Carbonated Soft Drinks: Non-Alcoholic Beverages Market - Revenue and Forecast to 2028 (US$ Billion)
- 7.4 Juices & Nectars
- 7.4.1 Overview
- 7.4.2 Juices & Nectars: Non-Alcoholic Beverages Market - Revenue and Forecast to 2028 (US$ Billion)
- 7.4.3 Sparkling Fruit Juices
- 7.4.3.1 Overview
- 7.4.3.2 Sparkling Fruit Juices: Non-Alcoholic Beverages Market - Revenue and Forecast to 2028 (US$ Billion)
- 7.4.4 Others
- 7.4.4.1 Overview
- 7.4.4.2 Others: Non-Alcoholic Beverages Market - Revenue and Forecast to 2028 (US$ Billion)
- 7.5 Bottled Waters:
- 7.5.1 Overview
- 7.5.2 Bottled Waters: Non-Alcoholic Beverages Market - Revenue and Forecast to 2028 (US$ Billion)
- 7.6 Dairy-Based Beverages
- 7.6.1 Overview
- 7.6.2 Dairy-Based Beverages: Non-Alcoholic Beverages Market - Revenue and Forecast to 2028 (US$ Billion)
- 7.7 Dairy Alternative Beverages
- 7.7.1 Overview
- 7.7.2 Dairy Alternative Beverages: Non-Alcoholic Beverages Market - Revenue and Forecast to 2028 (US$ Billion)
- 7.8 RTD Tea and Coffee:
- 7.8.1 Overview
- 7.8.2 RTD Tea and Coffee: Non-Alcoholic Beverages Market - Revenue and Forecast to 2028 (US$ Billion)
- 7.9 Non-Alcoholic Beer:
- 7.9.1 Overview
- 7.9.2 Non-Alcoholic Beer: Non-Alcoholic Beverages Market - Revenue and Forecast to 2028 (US$ Billion)
- 7.10 Malt Beverages:
- 7.10.1 Overview
- 7.10.2 Malt Beverages: Non-Alcoholic Beverages Market - Revenue and Forecast to 2028 (US$ Billion)
- 7.11 Others
- 7.11.1 Overview
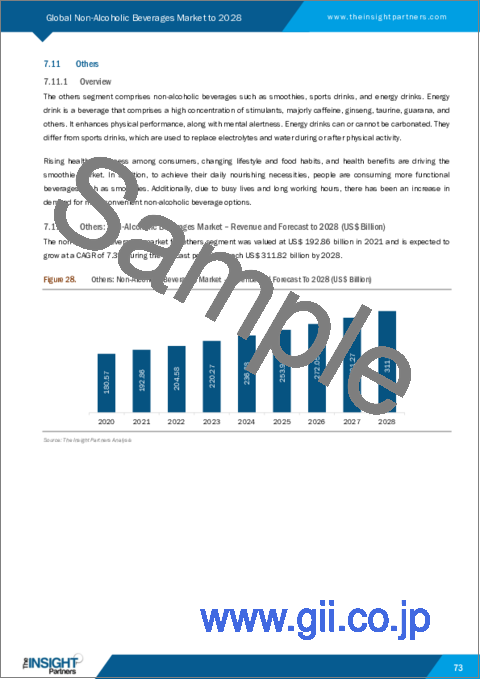
- 7.11.2 Others: Non-Alcoholic Beverages Market - Revenue and Forecast to 2028 (US$ Billion)
8. Non-Alcoholic Beverages Market Analysis - By Packaging Type
- 8.1 Overview
- 8.2 Non-Alcoholic Beverages Market, By Packaging Type (2021 and 2028)
- 8.3 Bottles
- 8.3.1 Overview
- 8.3.2 Bottles: Non-Alcoholic Beverages Market - Revenue and Forecast to 2028 (US$ Billion)
- 8.4 Cartons
- 8.4.1 Overview
- 8.4.2 Cartons: Non-Alcoholic Beverages Market - Revenue and Forecast to 2028 (US$ Billion)
- 8.5 Cans
- 8.5.1 Overview
- 8.5.2 Cans: Non-Alcoholic Beverages Market - Revenue and Forecast to 2028 (US$ Billion)
- 8.6 Pouches
- 8.6.1 Overview
- 8.6.2 Pouches: Non-Alcoholic Beverages Market - Revenue and Forecast to 2028 (US$ Billion)
9. Non-Alcoholic Beverages Market Analysis - By Category
- 9.1 Overview
- 9.2 Non-Alcoholic Beverages Market, By Category (2021 and 2028)
- 9.3 Sugar-Free
- 9.3.1 Overview
- 9.3.2 Sugar-Free: Non-Alcoholic Beverages Market- Revenue and Forecast to 2028 (US$ Billion)
- 9.4 Conventional
- 9.4.1 Overview
- 9.4.2 Conventional: Non-Alcoholic Beverages Market- Revenue and Forecast to 2028 (US$ Billion)
10. Non-Alcoholic Beverages Market Analysis - By Distribution Channel
- 10.1 Overview
- 10.2 Non-Alcoholic Beverages Market, By Distribution Channel (2021 and 2028)
- 10.3 Supermarkets & Hypermarkets
- 10.3.1 Overview
- 10.3.2 Supermarkets & Hypermarkets: Non-Alcoholic Beverages Market- Revenue and Forecast to 2028 (US$ Billion)
- 10.4 Convenience Stores
- 10.4.1 Overview
- 10.4.2 Convenience Stores: Non-Alcoholic Beverages Market - Revenue and Forecast to 2028 (US$ Billion)
- 10.5 Online Retail
- 10.5.1 Overview
- 10.5.2 Online Retail: Non-Alcoholic Beverages Market - Revenue and Forecast to 2028 (US$ Billion)
- 10.6 Others
- 10.6.1 Overview
- 10.6.2 Others: Non-Alcoholic Beverages Market - Revenue and Forecast to 2028 (US$ Billion)
11. Non-Alcoholic Beverages Market- Geographic Analysis
- 11.1 Overview
- 11.2 North America: Non-Alcoholic Beverages Market
- 11.2.1 North America: Non-Alcoholic Beverages Market-Revenue and Forecast to 2028 (US$ Billion)
- 11.2.2 North America: Non-Alcoholic Beverages Market, By Type
- 11.2.3 North America: Non-Alcoholic Beverages Market, by Packaging Type
- 11.2.4 North America: Non-Alcoholic Beverages Market, by Category
- 11.2.5 North America: Non-Alcoholic Beverages Market, by Distribution Channel
- 11.2.6 North America: Non-Alcoholic Beverages Market, by Key Country
- 11.2.6.1 US: Non-Alcoholic Beverages Market- Revenue and Forecast to 2028 (US$ Billion)
- 11.2.6.1.1 US: Non-Alcoholic Beverages Market, By Type
- 11.2.6.1.2 US: Non-Alcoholic Beverages Market, by Packaging Type
- 11.2.6.1.3 US: Non-Alcoholic Beverages Market, by Category
- 11.2.6.1.4 US: Non-Alcoholic Beverages Market, by Distribution Channel
- 11.2.6.2 Canada: Non-Alcoholic Beverages Market- Revenue and Forecast to 2028 (US$ Billion)
- 11.2.6.2.1 Canada: Non-Alcoholic Beverages Market, By Type
- 11.2.6.2.2 Canada: Non-Alcoholic Beverages Market, by Packaging Type
- 11.2.6.2.3 Canada: Non-Alcoholic Beverages Market, by Category
- 11.2.6.2.4 Canada: Non-Alcoholic Beverages Market, by Distribution Channel
- 11.2.6.3 Mexico: Non-Alcoholic Beverages Market- Revenue and Forecast to 2028 (US$ Billion)
- 11.2.6.3.1 Mexico: Non-Alcoholic Beverages Market, By Type
- 11.2.6.3.2 Mexico: Non-Alcoholic Beverages Market, by Packaging Type
- 11.2.6.3.3 Mexico: Non-Alcoholic Beverages Market, by Category
- 11.2.6.3.4 Mexico: Non-Alcoholic Beverages Market, by Distribution Channel
- 11.2.6.1 US: Non-Alcoholic Beverages Market- Revenue and Forecast to 2028 (US$ Billion)
- 11.3 Europe: Non-Alcoholic Beverages Market
- 11.3.1 Europe: Non-Alcoholic Beverages Market-Revenue and Forecast to 2028 (US$ Billion)
- 11.3.2 Europe: Non-Alcoholic Beverages Market, By Type
- 11.3.3 Europe: Non-Alcoholic Beverages Market, by Packaging Type
- 11.3.4 Europe: Non-Alcoholic Beverages Market, by Category
- 11.3.5 Europe: Non-Alcoholic Beverages Market, by Distribution Channel
- 11.3.6 Europe: Non-Alcoholic Beverages Market, by Key Country
- 11.3.6.1 Germany: Non-Alcoholic Beverages Market- Revenue and Forecast to 2028 (US$ Billion)
- 11.3.6.1.1 Germany: Non-Alcoholic Beverages Market, By Type
- 11.3.6.1.2 Germany: Non-Alcoholic Beverages Market, by Packaging Type
- 11.3.6.1.3 Germany: Non-Alcoholic Beverages Market, by Category
- 11.3.6.1.4 Germany: Non-Alcoholic Beverages Market, by Distribution Channel
- 11.3.6.2 France: Non-Alcoholic Beverages Market- Revenue and Forecast to 2028 (US$ Billion)
- 11.3.6.2.1 France: Non-Alcoholic Beverages Market, By Type
- 11.3.6.2.2 France: Non-Alcoholic Beverages Market, by Packaging Type
- 11.3.6.2.3 France: Non-Alcoholic Beverages Market, by Category
- 11.3.6.2.4 France: Non-Alcoholic Beverages Market, by Distribution Channel
- 11.3.6.3 UK: Non-Alcoholic Beverages Market- Revenue and Forecast to 2028 (US$ Billion)
- 11.3.6.3.1 UK: Non-Alcoholic Beverages Market, By Type
- 11.3.6.3.2 UK: Non-Alcoholic Beverages Market, by Packaging Type
- 11.3.6.3.3 UK: Non-Alcoholic Beverages Market, by Category
- 11.3.6.3.4 UK: Non-Alcoholic Beverages Market, by Distribution Channel
- 11.3.6.4 Italy: Non-Alcoholic Beverages Market- Revenue and Forecast to 2028 (US$ Billion)
- 11.3.6.4.1 Italy: Non-Alcoholic Beverages Market, By Type
- 11.3.6.4.2 Italy: Non-Alcoholic Beverages Market, by Packaging Type
- 11.3.6.4.3 Italy: Non-Alcoholic Beverages Market, by Category
- 11.3.6.4.4 Italy: Non-Alcoholic Beverages Market, by Distribution Channel
- 11.3.6.5 Russia: Non-Alcoholic Beverages Market- Revenue and Forecast to 2028 (US$ Billion)
- 11.3.6.5.1 Russia: Non-Alcoholic Beverages Market, By Type
- 11.3.6.5.2 Russia: Non-Alcoholic Beverages Market, by Packaging Type
- 11.3.6.5.3 Russia: Non-Alcoholic Beverages Market, by Category
- 11.3.6.5.4 Russia: Non-Alcoholic Beverages Market, by Distribution Channel
- 11.3.6.6 Rest of Europe: Non-Alcoholic Beverages Market- Revenue and Forecast to 2028 (US$ Billion)
- 11.3.6.6.1 Rest of Europe: Non-Alcoholic Beverages Market, By Type
- 11.3.6.6.2 Rest of Europe: Non-Alcoholic Beverages Market, by Packaging Type
- 11.3.6.6.3 Rest of Europe: Non-Alcoholic Beverages Market, by Category
- 11.3.6.6.4 Rest of Europe: Non-Alcoholic Beverages Market, by Distribution Channel
- 11.3.6.1 Germany: Non-Alcoholic Beverages Market- Revenue and Forecast to 2028 (US$ Billion)
- 11.4 Asia Pacific: Non-Alcoholic Beverages Market
- 11.4.1 Asia Pacific: Non-Alcoholic Beverages Market-Revenue and Forecast to 2028 (US$ Billion)
- 11.4.2 Asia Pacific: Non-Alcoholic Beverages Market, By Type
- 11.4.3 Asia Pacific: Non-Alcoholic Beverages Market, by Packaging Type
- 11.4.4 Asia Pacific: Non-Alcoholic Beverages Market, by Category
- 11.4.5 Asia Pacific: Non-Alcoholic Beverages Market, by Distribution Channel
- 11.4.6 Asia Pacific: Non-Alcoholic Beverages Market, by Key Country
- 11.4.6.1 China: Non-Alcoholic Beverages Market-Revenue and Forecast to 2028 (US$ Billion)
- 11.4.6.1.1 China: Non-Alcoholic Beverages Market, By Type
- 11.4.6.1.2 China: Non-Alcoholic Beverages Market, by Packaging Type
- 11.4.6.1.3 China: Non-Alcoholic Beverages Market, by Category
- 11.4.6.1.4 China: Non-Alcoholic Beverages Market, by Distribution Channel
- 11.4.6.2 Japan: Non-Alcoholic Beverages Market-Revenue and Forecast to 2028 (US$ Billion)
- 11.4.6.2.1 Japan: Non-Alcoholic Beverages Market, By Type
- 11.4.6.2.2 Japan: Non-Alcoholic Beverages Market, by Packaging Type
- 11.4.6.2.3 Japan: Non-Alcoholic Beverages Market, by Category
- 11.4.6.2.4 Japan: Non-Alcoholic Beverages Market, by Distribution Channel
- 11.4.6.3 India: Non-Alcoholic Beverages Market-Revenue and Forecast to 2028 (US$ Billion)
- 11.4.6.3.1 India: Non-Alcoholic Beverages Market, By Type
- 11.4.6.3.2 India: Non-Alcoholic Beverages Market, by Packaging Type
- 11.4.6.3.3 India: Non-Alcoholic Beverages Market, by Category
- 11.4.6.3.4 India: Non-Alcoholic Beverages Market, by Distribution Channel
- 11.4.6.4 Australia: Non-Alcoholic Beverages Market-Revenue and Forecast to 2028 (US$ Billion)
- 11.4.6.4.1 Australia: Non-Alcoholic Beverages Market, By Type
- 11.4.6.4.2 Australia: Non-Alcoholic Beverages Market, by Packaging Type
- 11.4.6.4.3 Australia: Non-Alcoholic Beverages Market, by Category
- 11.4.6.4.4 Australia: Non-Alcoholic Beverages Market, by Distribution Channel
- 11.4.6.5 South Korea: Non-Alcoholic Beverages Market-Revenue and Forecast to 2028 (US$ Billion)
- 11.4.6.5.1 South Korea: Non-Alcoholic Beverages Market, By Type
- 11.4.6.5.2 South Korea: Non-Alcoholic Beverages Market, by Packaging Type
- 11.4.6.5.3 South Korea: Non-Alcoholic Beverages Market, by Category
- 11.4.6.5.4 South Korea: Non-Alcoholic Beverages Market, by Distribution Channel
- 11.4.6.6 Indonesia: Non-Alcoholic Beverages Market-Revenue and Forecast to 2028 (US$ Billion)
- 11.4.6.6.1 Indonesia: Non-Alcoholic Beverages Market, By Type
- 11.4.6.6.2 Indonesia: Non-Alcoholic Beverages Market, by Packaging Type
- 11.4.6.6.3 Indonesia: Non-Alcoholic Beverages Market, by Category
- 11.4.6.6.4 Indonesia: Non-Alcoholic Beverages Market, by Distribution Channel
- 11.4.6.7 Philippines: Non-Alcoholic Beverages Market-Revenue and Forecast to 2028 (US$ Billion)
- 11.4.6.7.1 Philippines: Non-Alcoholic Beverages Market, By Type
- 11.4.6.7.2 Philippines: Non-Alcoholic Beverages Market, by Packaging Type
- 11.4.6.7.3 Philippines: Non-Alcoholic Beverages Market, by Category
- 11.4.6.7.4 Philippines: Non-Alcoholic Beverages Market, by Distribution Channel
- 11.4.6.8 Rest of Asia Pacific: Non-Alcoholic Beverages Market-Revenue and Forecast to 2028 (US$ Billion)
- 11.4.6.8.1 Rest of Asia Pacific: Non-Alcoholic Beverages Market, By Type
- 11.4.6.8.2 Rest of Asia Pacific: Non-Alcoholic Beverages Market, by Packaging Type
- 11.4.6.8.3 Rest of Asia Pacific: Non-Alcoholic Beverages Market, by Category
- 11.4.6.8.4 Rest of Asia Pacific: Non-Alcoholic Beverages Market, by Distribution Channel
- 11.4.6.1 China: Non-Alcoholic Beverages Market-Revenue and Forecast to 2028 (US$ Billion)
- 11.5 Middle East & Africa: Non-Alcoholic Beverages Market
- 11.5.1 Middle East & Africa: Non-Alcoholic Beverages Market-Revenue and Forecast to 2028 (US$ Billion)
- 11.5.2 Middle East & Africa: Non-Alcoholic Beverages Market, By Type
- 11.5.3 Middle East & Africa: Non-Alcoholic Beverages Market, by Packaging Type
- 11.5.4 Middle East & Africa: Non-Alcoholic Beverages Market, by Category
- 11.5.5 Middle East & Africa: Non-Alcoholic Beverages Market, by Distribution Channel
- 11.5.6 Middle East & Africa: Non-Alcoholic Beverages Market, by Key Country
- 11.5.6.1 South Africa: Non-Alcoholic Beverages Market-Revenue and Forecast to 2028 (US$ Billion)
- 11.5.6.1.1 South Africa: Non-Alcoholic Beverages Market, By Type
- 11.5.6.1.2 South Africa: Non-Alcoholic Beverages Market, by Packaging Type
- 11.5.6.1.3 South Africa: Non-Alcoholic Beverages Market, by Category
- 11.5.6.1.4 South Africa: Non-Alcoholic Beverages Market, by Distribution Channel
- 11.5.6.2 Saudi Arabia: Non-Alcoholic Beverages Market-Revenue and Forecast to 2028 (US$ Billion)
- 11.5.6.2.1 Saudi Arabia: Non-Alcoholic Beverages Market, By Type
- 11.5.6.2.2 Saudi Arabia: Non-Alcoholic Beverages Market, by Packaging Type
- 11.5.6.2.3 Saudi Arabia: Non-Alcoholic Beverages Market, by Category
- 11.5.6.2.4 Saudi Arabia: Non-Alcoholic Beverages Market, by Distribution Channel
- 11.5.6.3 UAE: Non-Alcoholic Beverages Market-Revenue and Forecast to 2028 (US$ Billion)
- 11.5.6.3.1 UAE: Non-Alcoholic Beverages Market, By Type
- 11.5.6.3.2 UAE: Non-Alcoholic Beverages Market, by Packaging Type
- 11.5.6.3.3 UAE: Non-Alcoholic Beverages Market, by Category
- 11.5.6.3.4 UAE: Non-Alcoholic Beverages Market, by Distribution Channel
- 11.5.6.4 Oman: Non-Alcoholic Beverages Market-Revenue and Forecast to 2028 (US$ Billion)
- 11.5.6.4.1 Oman: Non-Alcoholic Beverages Market, By Type
- 11.5.6.4.2 Oman: Non-Alcoholic Beverages Market, by Packaging Type
- 11.5.6.4.3 Oman: Non-Alcoholic Beverages Market, by Category
- 11.5.6.4.4 Oman: Non-Alcoholic Beverages Market, by Distribution Channel
- 11.5.6.5 Iran: Non-Alcoholic Beverages Market-Revenue and Forecast to 2028 (US$ Billion)
- 11.5.6.5.1 Iran: Non-Alcoholic Beverages Market, By Type
- 11.5.6.5.2 Iran: Non-Alcoholic Beverages Market, by Packaging Type
- 11.5.6.5.3 Iran: Non-Alcoholic Beverages Market, by Category
- 11.5.6.5.4 Iran: Non-Alcoholic Beverages Market, by Distribution Channel
- 11.5.6.6 Kuwait: Non-Alcoholic Beverages Market-Revenue and Forecast to 2028 (US$ Billion)
- 11.5.6.6.1 Kuwait: Non-Alcoholic Beverages Market, By Type
- 11.5.6.6.2 Kuwait: Non-Alcoholic Beverages Market, by Packaging Type
- 11.5.6.6.3 Kuwait: Non-Alcoholic Beverages Market, by Category
- 11.5.6.6.4 Kuwait: Non-Alcoholic Beverages Market, by Distribution Channel
- 11.5.6.7 Egypt: Non-Alcoholic Beverages Market-Revenue and Forecast to 2028 (US$ Billion)
- 11.5.6.7.1 Egypt: Non-Alcoholic Beverages Market, By Type
- 11.5.6.7.2 Egypt: Non-Alcoholic Beverages Market, by Packaging Type
- 11.5.6.7.3 Egypt: Non-Alcoholic Beverages Market, by Category
- 11.5.6.7.4 Egypt: Non-Alcoholic Beverages Market, by Distribution Channel
- 11.5.6.8 Rest of Middle East & Africa: Non-Alcoholic Beverages Market-Revenue and Forecast to 2028 (US$ Billion)
- 11.5.6.8.1 Rest of Middle East & Africa: Non-Alcoholic Beverages Market, By Type
- 11.5.6.8.2 Rest of Middle East & Africa: Non-Alcoholic Beverages Market, by Packaging Type
- 11.5.6.8.3 Rest of Middle East & Africa: Non-Alcoholic Beverages Market, by Category
- 11.5.6.8.4 Rest of Middle East & Africa: Non-Alcoholic Beverages Market, by Distribution Channel
- 11.5.6.1 South Africa: Non-Alcoholic Beverages Market-Revenue and Forecast to 2028 (US$ Billion)
- 11.6 South & Central America: Non-Alcoholic Beverages Market
- 11.6.1 South & Central America: Non-Alcoholic Beverages Market-Revenue and Forecast to 2028 (US$ Billion)
- 11.6.2 South & Central America: Non-Alcoholic Beverages Market, By Type
- 11.6.3 South & Central America: Non-Alcoholic Beverages Market, by Packaging Type
- 11.6.4 South & Central America: Non-Alcoholic Beverages Market, by Category
- 11.6.5 South & Central America: Non-Alcoholic Beverages Market, by Distribution Channel
- 11.6.6 South & Central America: Non-Alcoholic Beverages Market, by Key Country
- 11.6.6.1 Brazil: Non-Alcoholic Beverages Market- Revenue and Forecast to 2028 (US$ Billion)
- 11.6.6.1.1 Brazil: Non-Alcoholic Beverages Market, By Type
- 11.6.6.1.2 Brazil: Non-Alcoholic Beverages Market, by Packaging Type
- 11.6.6.1.3 Brazil: Non-Alcoholic Beverages Market, by Category
- 11.6.6.1.4 Brazil: Non-Alcoholic Beverages Market, by Distribution Channel
- 11.6.6.2 Argentina: Non-Alcoholic Beverages Market- Revenue and Forecast to 2028 (US$ Billion)
- 11.6.6.2.1 Argentina: Non-Alcoholic Beverages Market, By Type
- 11.6.6.2.2 Argentina: Non-Alcoholic Beverages Market, by Packaging Type
- 11.6.6.2.3 Argentina: Non-Alcoholic Beverages Market, by Category
- 11.6.6.2.4 Argentina: Non-Alcoholic Beverages Market, by Distribution Channel
- 11.6.6.3 Rest of South & Central America: Non-Alcoholic Beverages Market- Revenue and Forecast to 2028 (US$ Billion)
- 11.6.6.3.1 Rest of South & Central America: Non-Alcoholic Beverages Market, By Type
- 11.6.6.3.2 Rest of South & Central America: Non-Alcoholic Beverages Market, by Packaging Type
- 11.6.6.3.3 Rest of South & Central America: Non-Alcoholic Beverages Market, by Category
- 11.6.6.3.4 Rest of South & Central America: Non-Alcoholic Beverages Market, by Distribution Channel
- 11.6.6.1 Brazil: Non-Alcoholic Beverages Market- Revenue and Forecast to 2028 (US$ Billion)
12. Impact of COVID-19 Pandemic on Global Non-Alcoholic Beverages Market
- 12.1 Impact of COVID-19 on Non-Alcoholic Beverages Market
- 12.2 North America: Impact Assessment of COVID-19 Pandemic
- 12.3 Europe: Impact Assessment of COVID-19 Pandemic
- 12.4 Asia-Pacific: Impact Assessment of COVID-19 Pandemic
- 12.5 Middle East & Africa: Impact Assessment of COVID-19 Pandemic
- 12.6 South & Central America: Impact Assessment of COVID-19 Pandemic
13. Industry Landscape
- 13.1 Overview
- 13.2 Partnership
- 13.3 New Product Development
- 13.4 Expansion
14. Company Profiles
- 14.1 The Coca-Cola Company
- 14.1.1 Key Facts
- 14.1.2 Business Description
- 14.1.3 Products and Services
- 14.1.4 Financial Overview
- 14.1.5 SWOT Analysis
- 14.1.6 Key Developments
- 14.2 Nestle S.A.
- 14.2.1 Key Facts
- 14.2.2 Business Description
- 14.2.3 Products and Services
- 14.2.4 Financial Overview
- 14.2.5 SWOT Analysis
- 14.2.6 Key Developments
- 14.3 Red Bull
- 14.3.1 Key Facts
- 14.3.2 Business Description
- 14.3.3 Products and Services
- 14.3.4 Financial Overview
- 14.3.5 SWOT Analysis
- 14.3.6 Key Developments
- 14.4 Califia Farms, LLC
- 14.4.1 Key Facts
- 14.4.2 Business Description
- 14.4.3 Products and Services
- 14.4.4 Financial Overview
- 14.4.5 SWOT Analysis
- 14.4.6 Key Developments
- 14.5 Keurig Dr Pepper, Inc.
- 14.5.1 Key Facts
- 14.5.2 Business Description
- 14.5.3 Products and Services
- 14.5.4 Financial Overview
- 14.5.5 SWOT Analysis
- 14.5.6 Key Developments
- 14.6 Asahi Group Holdings, Ltd.
- 14.6.1 Key Facts
- 14.6.2 Business Description
- 14.6.3 Products and Services
- 14.6.4 Financial Overview
- 14.6.5 SWOT Analysis
- 14.6.6 Key Developments
- 14.7 Danone S.A.
- 14.7.1 Key Facts
- 14.7.2 Business Description
- 14.7.3 Products and Services
- 14.7.4 Financial Overview
- 14.7.5 SWOT Analysis
- 14.7.6 Key Developments
- 14.8 SUNTORY HOLDINGS LIMITED
- 14.8.1 Key Facts
- 14.8.2 Business Description
- 14.8.3 Products and Services
- 14.8.4 Financial Overview
- 14.8.5 SWOT Analysis
- 14.8.6 Key Developments
- 14.9 Bolthouse Farms, Inc.
- 14.9.1 Key Facts
- 14.9.2 Business Description
- 14.9.3 Products and Services
- 14.9.4 Financial Overview
- 14.9.5 SWOT Analysis
- 14.9.6 Key Developments
- 14.10 PepsiCo Inc.
- 14.10.1 Key Facts
- 14.10.2 Business Description
- 14.10.3 Products and Services
- 14.10.4 Financial Overview
- 14.10.5 SWOT Analysis
- 14.10.6 Key Developments
- 14.11 Heineken NV
- 14.11.1 Key Facts
- 14.11.2 Business Description
- 14.11.3 Products and Services
- 14.11.4 Financial Overview
- 14.11.5 SWOT Analysis
- 14.11.6 Key Developments
- 14.12 Coolberg Beverages Pvt Ltd
- 14.12.1 Key Facts
- 14.12.2 Business Description
- 14.12.3 Products and Services
- 14.12.4 Financial Overview
- 14.12.5 SWOT Analysis
- 14.12.6 Key Developments
- 14.13 Goya Foods Inc
- 14.13.1 Key Facts
- 14.13.2 Business Description
- 14.13.3 Products and Services
- 14.13.4 Financial Overview
- 14.13.5 SWOT Analysis
- 14.13.6 Key Developments
- 14.14 Anheuser-Busch InBev NV
- 14.14.1 Key Facts
- 14.14.2 Business Description
- 14.14.3 Products and Services
- 14.14.4 Financial Overview
- 14.14.5 SWOT Analysis
- 14.14.6 Key Developments
- 14.15 Carlsberg AS
- 14.15.1 Key Facts
- 14.15.2 Business Description
- 14.15.3 Products and Services
- 14.15.4 Financial Overview
- 14.15.5 SWOT Analysis
- 14.15.6 Key Developments
15. Appendix
- 15.1 About The Insight Partners
- 15.2 Word Index