|
|
市場調査レポート
商品コード
1290373
ノンアルコール飲料の世界市場 - 2023-2030年Global Non-Alcoholic Beverages Market - 2023-2030 |
||||||
カスタマイズ可能
適宜更新あり
|
|||||||
| ノンアルコール飲料の世界市場 - 2023-2030年 |
|
出版日: 2023年06月12日
発行: DataM Intelligence
ページ情報: 英文 195 Pages
納期: 即日から翌営業日
|
- 全表示
- 概要
- 目次
市場概要
ノンアルコール飲料の世界市場は、2022年に7,506億米ドルに達し、2030年には1兆2,423億米ドルに達することで有利な成長が予測されます。また、予測期間中(2023-2030年)のCAGRは6.5%と予測されています。
ノンアルコール飲料は、消費者に幅広い選択肢を提供する多様な飲料のカテゴリーです。アルコールを含まないこれらの飲料は、リフレッシュメントや水分補給、健康効果を求める人など、さまざまな嗜好に対応しています。ノンアルコール飲料市場は、様々な要因によって大きな成長を遂げています。この成長に貢献している重要な側面の一つは、遺伝子組み換え果実の利用や除草剤耐性など、果実の形質転換が統合されていることです。
これらの遺伝子工学の進歩は、風味、栄養価、耐病性などの果実の特性を向上させることにより、業界に革命をもたらしています。さらに、遺伝子組み換え果実における除草剤耐性の採用や、遺伝子組み換えによる果実の品質向上は、作物の収量向上と飲料製造用の高品質果実の安定供給につながっています。
市場力学
イノベーションと製品の多様化がノンアルコール飲料市場の成長を促進する
イノベーションと製品の多様化は、ノンアルコール飲料市場の主要な促進要因です。飲料メーカーは、消費者の嗜好の変化に対応したユニークで魅力的な商品の開発に継続的に取り組んでいます。これには、新しいフレーバー、機能性飲料、健康的なオプションの導入が含まれます。市場開拓者は、天然素材、持続可能性、ウェルネスなどの動向を活用し、革新的な処方を生み出すための研究開発に投資しています。
さらに、戦略的なマーケティングとブランディングの取り組みは、消費者の意識と関心を高める上で重要な役割を担っています。外出先で手軽に飲める飲料への需要の高まりや、マーケティングや流通におけるデジタルプラットフォームの影響力の高まりは、ノンアルコール飲料市場の拡大にさらに寄与しています。消費者のニーズに適応し、新たな動向を活用することで、企業はこのダイナミックな産業において機会を捉え、成長を促進することができます。
遺伝子組み換え果物に対する消費者の懐疑心がノンアルコール飲料市場に影響を与える
ノンアルコール飲料市場における重要な抑制要因の一つは、遺伝子組み換え果実を取り巻く社会的認識と懐疑心です。遺伝子組換え果実の耐病性、耐虫性、除草剤耐性、品質向上など、遺伝子組換えによるメリットがあるにもかかわらず、安全性や長期的影響に関する消費者の懸念が、遺伝子組換え果実の受容を制限しています。
そのため、遺伝子組み換え飲料の購入や消費にためらいが生じ、ノンアルコール飲料の市場シェアや需要に影響を及ぼしています。遺伝子組み換え作物(GMO)に関連する規制の枠組みや表示要件は、この市場で事業を展開する企業にとって課題となり、複雑さを増しています。
天然素材やオーガニック製品を求める消費者の嗜好と遺伝子工学の進歩のバランスを取ることは、依然として大きな制約であり、企業はイノベーション、透明性、消費者の信頼の間の微妙なバランスをうまく調整する必要があります。
COVID-19影響分析
COVID-19分析では、COVID前シナリオ、COVID中シナリオ、COVID後シナリオに加え、価格ダイナミクス(COVID前シナリオと比較したパンデミック中・後の価格変動を含む)、需要-供給スペクトル(取引制限、ロックダウン、その後の問題による需要と供給のシフト)、政府の取り組み(政府機関による市場、セクター、産業の活性化に関する取り組み)、メーカーの戦略的取り組み(COVID問題を軽減するためのメーカーの取り組み)についても解説しています。
目次
第1章 調査手法とスコープ
- 調査手法
- 調査目的および調査範囲
第2章 定義と概要
第3章 エグゼクティブサマリー
- 市場内訳:製品タイプ別
- 市場内訳:流通チャネル別
- 市場内訳:地域別
第4章 市場力学
- 影響要因
- 促進要因
- 抑制要因
- 機会
- 影響分析
第5章 産業分析
- ポーターのファイブフォース分析
- サプライチェーン分析
- 価格分析
- 法規制の分析
第6章 COVID-19の分析
第7章 製品タイプ別
- 炭酸飲料
- ボトルウォーター
- フルーツ飲料
- RTDティー・コーヒー
- その他
第8章 流通チャネル別
- スーパーマーケット/ハイパーマーケット
- コンビニエンスストア
- オンラインストア
- その他
第9章 地域別
- 北米
- 米国
- カナダ
- メキシコ
- 欧州
- ドイツ
- 英国
- フランス
- イタリア
- スペイン
- その他欧州
- 南米
- ブラジル
- アルゼンチン
- その他南米地域
- アジア太平洋地域
- 中国
- インド
- 日本
- オーストラリア
- その他アジア太平洋地域
- 中東・アフリカ地域
第10章 競合情勢
- 競合シナリオ
- 市況/シェア分析
- M&A(合併・買収)分析
第11章 企業プロファイル
- PepsiCo, Inc.
- 会社概要
- グレードのポートフォリオと説明
- 財務概要
- 主な発展状況
- Nestle S.A.
- The Coca-Cola Company
- The Kraft Heinz Company
- Appalachian Brewing Co.
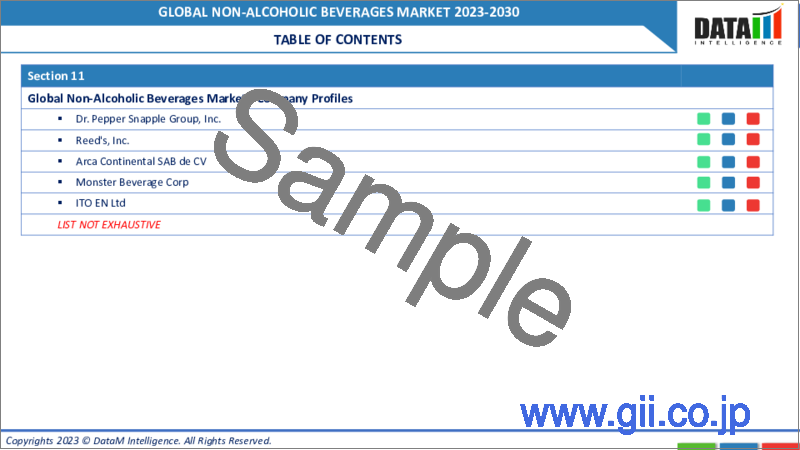
- Dr. Pepper Snapple Group, Inc.
- Reed's, Inc.
- Arca Continental SAB de CV
- Monster Beverage Corp
- ITO EN Ltd
第12章 付録
Market Overview
The Global Non-Alcoholic Beverages Market reached US$ 750.6 billion in 2022 and is projected to witness lucrative growth by reaching up to US$ 1,242.3 billion by 2030. The market is expected to exhibit a CAGR of 6.5% during the forecast period (2023-2030).
Non-alcoholic beverages are a diverse category of drinks that offer a wide range of options to consumers. These beverages do not contain alcohol and cater to various preferences, including those seeking refreshments, hydration, or health benefits. The non-alcoholic beverages market is witnessing significant growth, driven by various factors. One key aspect contributing to this growth is the integration of trait modification in fruits, including the utilization of transgenic fruits and herbicide tolerance in genetically modified fruits.
These advancements in genetic engineering have revolutionized the industry by enhancing fruit characteristics, such as flavor, nutritional content, and disease resistance. Additionally, the adoption of herbicide tolerance in genetically modified fruits and Fruit quality enhancement through genetic modification has led to improved crop yields and a stable supply of high-quality fruits for beverage production.
Market Dynamics
Innovation and Product Diversification Drive Growth in the Non-Alcoholic Beverages Market
Innovation and product diversification are key drivers of the non-alcoholic beverages market. Beverage companies continually strive to develop unique and appealing offerings that cater to changing consumer preferences. This includes the introduction of new flavors, functional beverages, and healthier options. Market players invest in research and development to create innovative formulations, leveraging trends such as natural ingredients, sustainability, and wellness.
Moreover, strategic marketing and branding efforts play a crucial role in driving consumer awareness and engagement. The increasing demand for convenient on-the-go beverages and the growing influence of digital platforms for marketing and distribution further contribute to the expansion of the non-alcoholic beverages market. By continuously adapting to consumer needs and leveraging emerging trends, companies can seize opportunities and drive growth in this dynamic industry.
Consumer Skepticism Towards Genetically Modified Fruits Impacts Non-Alcoholic Beverages Market
One key restraint in the non-alcoholic beverages market is the public perception and skepticism surrounding genetically modified fruits. Despite the benefits of disease resistance in genetically modified fruits, insect resistance in genetically modified fruits, herbicide tolerance, and fruit quality enhancement achieved through genetic modification, consumer concerns regarding the safety and long-term effects of these genetically modified fruits limit their acceptance.
This leads to hesitancy in purchasing and consuming such beverages, impacting non-alcoholic beverages' market share and demand. Regulatory frameworks and labeling requirements related to genetically modified organisms (GMOs) can pose challenges and add complexities for companies operating in this market.
Balancing consumer preferences for natural and organic products with the advancements in genetic engineering remains a significant restraint, requiring companies to navigate the delicate balance between innovation, transparency, and consumer trust.
COVID-19 Impact Analysis
The COVID-19 analysis includes Pre-COVID Scenario, COVID Scenario and Post-COVID Scenario along with pricing dynamics (including pricing change during and post-pandemic comparing it with pre-COVID scenarios), demand-supply spectrum (shift in demand and supply owing to trading restrictions, lockdown and subsequent issues), government initiatives (initiatives to revive market, sector or industry by government bodies) and manufacturers strategic initiatives (what manufacturers did to mitigate the COVID issues will be covered here).
Segment Analysis
The global non-alcoholic beverages market is segmented based on product type, target consumer, distribution channel, and region.
Bottled Water Segment Drives the Non-Alcoholic Beverages Market with Diverse Offerings and Genetic Enhancements
The non-alcoholic beverages market is segmented into various categories, with bottled water being one of the prominent segments. Bottled water offers a range of options to cater to different consumer preferences. Still bottled water, known for its purity and simplicity, holds a significant market share, accounting for approximately 60% of bottled water sales.
Sparkling bottled water, with its carbonation and refreshing bubbles, captures around 30% of the market. Flavored bottled water, infused with natural fruit essences, constitutes about 5% of the market, appealing to consumers looking for added taste and variety. Enhanced water, with added vitamins, minerals, or electrolytes, makes up the remaining 5%, targeting health-conscious individuals seeking additional benefits.
These segments reflect the industry's response to evolving consumer demands for healthier and more customized beverage options. Genetic engineering and trait modification in fruits contribute to the development of enhanced water varieties with improved nutritional profiles, further driving the growth of this segment.
Geographical Analysis
Asia Pacific Held a Significant Share of the Non-Alcoholic Beverages in 2022
By region, the global non-alcoholic beverages market is segmented into Asia-Pacific, North America, South America, Europe, and Middle-east & Africa.
The Asia Pacific non-alcoholic beverages market is witnessing robust growth, driven by changing consumer preferences and increasing health consciousness. The region's large population and rising disposable incomes create a fertile ground for market expansion. The non-alcoholic beverages market analysis shows that there is a growing demand for natural and healthier beverage options, prompting companies to innovate and introduce products with added nutritional value.
Genetic modification and biotechnology in fruit crops are playing a significant role in enhancing fruit crops, resulting in improved flavors, nutritional content, and disease resistance in genetically modified fruit. Countries such as China, India, and Japan are experiencing a surge in consumption of non-alcoholic beverages, with ready-to-drink options and functional beverages gaining popularity.
However, regulatory challenges and consumer concerns surrounding genetically modified organisms (GMOs) pose obstacles to the growth of the non-alcoholic beverages market share. To capitalize on opportunities in this dynamic market, companies are focusing on product diversification, marketing strategies, and distribution expansion.
Competitive Landscape
The major global players include: PepsiCo, Inc., Nestle S.A., The Coca-Cola Company, The Kraft Heinz Company, Appalachian Brewing Co., Dr. Pepper Snapple Group, Inc., Reed's, Inc., Arca Continental SAB de CV, Monster Beverage Corp, and ITO EN Ltd.
Why Purchase the Report?
- To visualize the global non-alcoholic beverages market segmentation based on product type, distribution channel, and Region, as well as understand key commercial assets and players.
- Identify commercial opportunities by analyzing trends and co-development.
- Excel data sheet with numerous data points of Non-alcoholic Beverages market-level with all segments.
- The PDF report consists of a comprehensive analysis after exhaustive qualitative interviews and an in-depth study.
- Product mapping available as Excel consisting of key products of all the major players.
The global non-alcoholic beverages market report would provide approximately 61 tables, 59 figures and 195 pages.
Target Audience 2023
- Manufacturers/ Buyers
- Industry Investors/Investment Bankers
- Research Professionals
- Emerging Companies
Table of Contents
1. Methodology and Scope
- 1.1. Research Methodology
- 1.2. Research Objective and Scope of the Report
2. Definition and Overview
3. Executive Summary
- 3.1. Snippet by Product Type
- 3.2. Snippet by Distribution Channel
- 3.3. Snippet by Region
4. Dynamics
- 4.1. Impacting Factors
- 4.1.1. Drivers
- 4.1.2. Restraints
- 4.1.3. Opportunity
- 4.1.4. Impact Analysis
5. Industry Analysis
- 5.1. Porter's Five Force Analysis
- 5.2. Supply Chain Analysis
- 5.3. Pricing Analysis
- 5.4. Regulatory Analysis
6. COVID-19 Analysis
- 6.1. Analysis of COVID-19
- 6.1.1. Scenario Before COVID-19
- 6.1.2. Scenario During COVID-19
- 6.1.3. Scenario Post COVID-19
- 6.2. Pricing Dynamics Amid COVID-19
- 6.3. Demand-Supply Spectrum
- 6.4. Government Initiatives Related to the Market During Pandemic
- 6.5. Manufacturers Strategic Initiatives
- 6.6. Conclusion
7. By Product Type
- 7.1. Introduction
- 7.1.1. Market Size Analysis and Y-o-Y Growth Analysis (%), By Product Type
- 7.1.2. Market Attractiveness Index, By Product Type
- 7.2. Carbonated Soft Drinks
- 7.2.1. Introduction
- 7.2.2. Market Size Analysis and Y-o-Y Growth Analysis (%)
- 7.3. Bottled Water
- 7.4. Fruit Beverages
- 7.5. Ready-to-Drink Tea and Coffee
- 7.6. Others
8. By Distribution Channel
- 8.1. Introduction
- 8.1.1. Market Size Analysis and Y-o-Y Growth Analysis (%), By Distribution Channel
- 8.1.2. Market Attractiveness Index, By Distribution Channel
- 8.2. Supermarkets/Hypermarkets
- 8.2.1. Introduction
- 8.2.2. Market Size Analysis and Y-o-Y Growth Analysis (%)
- 8.3. Convenience Stores
- 8.4. Online Stores
- 8.5. Others
9. By Region
- 9.1. Introduction
- 9.1.1. Market Size Analysis and Y-o-Y Growth Analysis (%), By Region
- 9.1.2. Market Attractiveness Index, By Region
- 9.2. North America
- 9.2.1. Introduction
- 9.2.2. Key Region-Specific Dynamics
- 9.2.3. Market Size Analysis and Y-o-Y Growth Analysis (%), By Product Type
- 9.2.4. Market Size Analysis and Y-o-Y Growth Analysis (%), By Distribution Channel
- 9.2.5. Market Size Analysis and Y-o-Y Growth Analysis (%), By Country
- 9.2.5.1. The U.S.
- 9.2.5.2. Canada
- 9.2.5.3. Mexico
- 9.3. Europe
- 9.3.1. Introduction
- 9.3.2. Key Region-Specific Dynamics
- 9.3.3. Market Size Analysis and Y-o-Y Growth Analysis (%), By Product Type
- 9.3.4. Market Size Analysis and Y-o-Y Growth Analysis (%), By Distribution Channel
- 9.3.5. Market Size Analysis and Y-o-Y Growth Analysis (%), By Country
- 9.3.5.1. Germany
- 9.3.5.2. The U.K
- 9.3.5.3. France
- 9.3.5.4. Italy
- 9.3.5.5. Spain
- 9.3.5.6. Rest of Europe
- 9.4. South America
- 9.4.1. Introduction
- 9.4.2. Key Region-Specific Dynamics
- 9.4.3. Market Size Analysis and Y-o-Y Growth Analysis (%), By Product Type
- 9.4.4. Market Size Analysis and Y-o-Y Growth Analysis (%), By Distribution Channel
- 9.4.5. Market Size Analysis and Y-o-Y Growth Analysis (%), By Country
- 9.4.5.1. Brazil
- 9.4.5.2. Argentina
- 9.4.5.3. Rest of South America
- 9.5. Asia-Pacific
- 9.5.1. Introduction
- 9.5.2. Key Region-Specific Dynamics
- 9.5.3. Market Size Analysis and Y-o-Y Growth Analysis (%), By Product Type
- 9.5.4. Market Size Analysis and Y-o-Y Growth Analysis (%), By Distribution Channel
- 9.5.5. Market Size Analysis and Y-o-Y Growth Analysis (%), By Country
- 9.5.5.1. China
- 9.5.5.2. India
- 9.5.5.3. Japan
- 9.5.5.4. Australia
- 9.5.5.5. Rest of Asia-Pacific
- 9.6. Middle East and Africa
- 9.6.1. Introduction
- 9.6.2. Key Region-Specific Dynamics
- 9.6.3. Market Size Analysis and Y-o-Y Growth Analysis (%), By Product Type
- 9.6.4. Market Size Analysis and Y-o-Y Growth Analysis (%), By Distribution Channel
10. Competitive Landscape
- 10.1. Competitive Scenario
- 10.2. Market Positioning/Share Analysis
- 10.3. Mergers and Acquisitions Analysis
11. Company Profiles
- 11.1. PepsiCo, Inc.
- 11.1.1. Company Overview
- 11.1.2. Grade Portfolio and Description
- 11.1.3. Financial Overview
- 11.1.4. Key Developments
- 11.2. Nestle S.A.
- 11.3. The Coca-Cola Company
- 11.4. The Kraft Heinz Company
- 11.5. Appalachian Brewing Co.
- 11.6. Dr. Pepper Snapple Group, Inc.
- 11.7. Reed's, Inc.
- 11.8. Arca Continental SAB de CV
- 11.9. Monster Beverage Corp
- 11.10. ITO EN Ltd
LIST NOT EXHAUSTIVE
12. Appendix
- 12.1. About Us and Services
- 12.2. Contact Us


