|
|
市場調査レポート
商品コード
1643949
アジア太平洋のノンアルコール飲料市場:製品別、投資別、主要動向 - 分析と予測(2024年~2034年)Asia-Pacific Non-Alcoholic Beverage Market: Focus on Products, Investments, Key Trends - Analysis and Forecast, 2024-2034 |
||||||
カスタマイズ可能
|
|||||||
| アジア太平洋のノンアルコール飲料市場:製品別、投資別、主要動向 - 分析と予測(2024年~2034年) |
|
出版日: 2025年01月29日
発行: BIS Research
ページ情報: 英文 104 Pages
納期: 1~5営業日
|
全表示
- 概要
- 図表
- 目次
アジア太平洋のノンアルコール飲料の市場規模は、2024年の5億550万米ドルから2034年には10億2,950万米ドルに達し、予測期間の2024年~2034年のCAGRは7.37%になると予測されています。
アジア太平洋のノンアルコール飲料市場は多様で、ジュース、お茶、コーヒー、ソフトドリンク、ボトル入り飲料水、機能性飲料などの製品があります。消費者の嗜好がより健康的で多様な飲料の選択肢へとシフトするにつれ、市場は拡大しています。植物性飲料水や機能性飲料のような革新的な飲料によって、より健康効果の高い飲料への需要が高まっています。
Coca-Cola Company、PepsiCo、Nestleなどの主要企業が市場を独占しており、市場競争は極めて激しい状況です。持続可能性と健康に対する意識の高まりから消費者の嗜好は変化しており、そのため企業は環境に優しいパッケージや天然素材にお金をかけるようになっています。従来の飲料に代わる新鮮で健康的な飲料を提供し、アジア太平洋の消費者の嗜好やライフスタイルの変化に対応することで、この活気ある市場は今も成長を続けています。
| 主要市場統計 | |
|---|---|
| 予測期間 | 2024年~2034年 |
| 2024年の評価 | 5億550万米ドル |
| 2034年の予測 | 10億2,950万米ドル |
| CAGR | 7.37% |
アジア太平洋のノンアルコール飲料市場は、より多様で健康的な飲料を求める消費者の嗜好の変化により、大きく拡大しています。ジュース、紅茶、コーヒー、ソフトドリンク、ボトル入り飲料水、機能性飲料は、市場で入手可能な数多くの製品のほんの一部にすぎません。また、栄養価や健康上の利点を付加した飲料に対する需要も高まっています。健康志向が高まるにつれ、顧客はリフレッシュ効果だけでなく、水分補給、消化促進、エネルギー補給といった実用的な利点もある飲料を選ぶようになっています。
植物性飲料、砂糖不使用の代替飲料、プロバイオティクス、ビタミン、ミネラルを添加した機能性飲料の発売など、製品開発におけるイノベーションによって、ウェルネス重視の製品に対する需要が満たされています。また、天然飲料、オーガニック飲料、低カロリー飲料に対する需要の高まりの結果、市場も変化しています。
この市場を独占しているのは、Nestle、PepsiCo、Coca-Cola Companyといった国際的な大企業で、消費者の嗜好の変化を満たすために常に新しいアイデアを打ち出しています。天然素材や環境に優しいパッケージへの需要が高まる中、アジア太平洋市場では健康に加えて持続可能性が大きな課題として浮上しています。
アジア太平洋では急速な都市化、可処分所得の増加、ライフスタイルの変化が続いており、ノンアルコール飲料市場は今後も成長を続けると予想されます。ノンアルコール飲料市場は、持続可能性を重視し、健康志向の強い消費者にアピールする幅広い選択肢を提供するとみられています。
当レポートでは、アジア太平洋のノンアルコール飲料市場について調査し、市場の概要とともに、製品別、投資別、地域別の動向、および市場に参入する企業のプロファイルなどを提供しています。
目次
エグゼクティブサマリー
第1章 市場
- 動向:現在および将来の影響評価
- サプライチェーンの概要
- 研究開発レビュー
- 規制状況
- 市場力学の概要
- スタートアップ資金調達の概要
第2章 地域
- 地域別概要
- アジア太平洋
- 地域概要
- 市場促進要因
- 市場抑制要因
- 製品
- 中国
- 日本
- オーストラリア
- 韓国
- インド
- その他
第3章 市場-競合ベンチマーキングと企業プロファイル
- 今後の見通し
- 地理的評価
- Tata Consumer Products Limited
- SUNTORY BEVERAGE & FOOD LIMITED
- ASAHI GROUP HOLDINGS, LTD.
- Kirin Holdings Company Limited
第4章 調査手法
List of Figures
- Figure 1: Non-Alcoholic Beverage Market (by Region), $Billion, 2024, 2030, and 2034
- Figure 2: Pricing Analysis for Non-Alcoholic Beverage Market (by Global and Region), $/Liter, 2024, 2030, and 2034
- Figure 3: Asia-Pacific Non-Alcoholic Beverage Market (by Preparation), $Billion, 2024, 2030, and 2034
- Figure 4: Asia-Pacific Non-Alcoholic Beverage Market (by Category), $Billion, 2024, 2030, and 2034
- Figure 5: Key Events
- Figure 6: Supply Chain and Risks within the Supply Chain
- Figure 7: Non-Alcoholic Beverage Market (by Country), January 2019 to December 2023
- Figure 8: Non-Alcoholic Beverage Market (by Company), January 2019 to December 2023
- Figure 9: Impact Analysis of Market Navigating Factors, 2024-2034
- Figure 10: China Non-Alcoholic Beverage Market, $Billion, 2023-2034
- Figure 11: Japan Non-Alcoholic Beverage Market, $Billion, 2023-2034
- Figure 12: Australia Non-Alcoholic Beverage Market, $Billion, 2023-2034
- Figure 13: South Korea Non-Alcoholic Beverage Market, $Billion, 2023-2034
- Figure 14: India Non-Alcoholic Beverage Market, $Billion, 2023-2034
- Figure 15: Rest-of-Asia-Pacific Non-Alcoholic Beverage Market, $Billion, 2023-2034
- Figure 16: Strategic Initiatives, January 2019- June 2024
- Figure 17: Share of Strategic Initiatives, 2019-2024
- Figure 18: Business and Corporate Strategy Outlook: Focusing Trends
- Figure 19: Data Triangulation
- Figure 20: Top-Down and Bottom-Up Approach
- Figure 21: Assumptions and Limitations
List of Tables
- Table 1: Opportunities across Regions
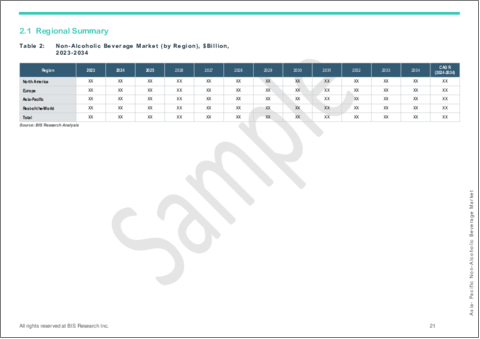
- Table 2: Non-Alcoholic Beverage Market (by Region), $Billion, 2023-2034
- Table 3: Asia-Pacific Non-Alcoholic Beverage Market (by Category), $Billion, 2023-2034
- Table 4: Asia-Pacific Non-Alcoholic Beverage Market (by Water), $Billion, 2023-2034
- Table 5: Asia-Pacific Non-Alcoholic Beverage Market (by Juice), $Billion, 2023-2034
- Table 6: Asia-Pacific Non-Alcoholic Beverage Market (by Soft Drinks), $Billion, 2023-2034
- Table 7: Asia-Pacific Non-Alcoholic Beverage Market (by Tea), $Billion, 2023-2034
- Table 8: Asia-Pacific Non-Alcoholic Beverage Market (by Coffee), $Billion, 2023-2034
- Table 9: Asia-Pacific Non-Alcoholic Beverage Market (by Dairy and Plant-Based Milk), $Billion, 2023-2034
- Table 10: Asia-Pacific Non-Alcoholic Beverage Market (by Non-Alcoholic Beer and Wine), $Billion, 2023-2034
- Table 11: Asia-Pacific Non-Alcoholic Beverage Market (by Functional Beverages), $Billion, 2023-2034
- Table 12: Asia-Pacific Non-Alcoholic Beverage Market (by Specialty Drinks), $Billion, 2023-2034
- Table 13: Asia-Pacific Non-Alcoholic Beverage Market (by Preparation), $Billion, 2023-2034
- Table 14: Asia-Pacific Non-Alcoholic Beverage Market (by Retail Packaged), $Billion, 2023-2034
- Table 15: China Non-Alcoholic Beverage Market (by Category), $Billion, 2023-2034
- Table 16: China Non-Alcoholic Beverage Market (by Water), $Billion, 2023-2034
- Table 17: China Non-Alcoholic Beverage Market (by Juice), $Billion, 2023-2034
- Table 18: China Non-Alcoholic Beverage Market (by Soft Drinks), $Billion, 2023-2034
- Table 19: China Non-Alcoholic Beverage Market (by Tea), $Billion, 2023-2034
- Table 20: China Non-Alcoholic Beverage Market (by Coffee), $Billion, 2023-2034
- Table 21: China Non-Alcoholic Beverage Market (by Dairy and Plant-Based Milk), $Billion, 2023-2034
- Table 22: China Non-Alcoholic Beverage Market (by Non-Alcoholic Beer and Wine), $Billion, 2023-2034
- Table 23: China Non-Alcoholic Beverage Market (by Functional Beverages), $Billion, 2023-2034
- Table 24: China Non-Alcoholic Beverage Market (by Specialty Drinks), $Billion, 2023-2034
- Table 25: China Non-Alcoholic Beverage Market (by Preparation), $Billion, 2023-2034
- Table 26: China Non-Alcoholic Beverage Market (by Retail Packaged), $Billion, 2023-2034
- Table 27: Japan Non-Alcoholic Beverage Market (by Category), $Billion, 2023-2034
- Table 28: Japan Non-Alcoholic Beverage Market (by Water), $Billion, 2023-2034
- Table 29: Japan Non-Alcoholic Beverage Market (by Juice), $Billion, 2023-2034
- Table 30: Japan Non-Alcoholic Beverage Market (by Soft Drinks), $Billion, 2023-2034
- Table 31: Japan Non-Alcoholic Beverage Market (by Tea), $Billion, 2023-2034
- Table 32: Japan Non-Alcoholic Beverage Market (by Coffee), $Billion, 2023-2034
- Table 33: Japan Non-Alcoholic Beverage Market (by Dairy and Plant-Based Milk), $Billion, 2023-2034
- Table 34: Japan Non-Alcoholic Beverage Market (by Non-Alcoholic Beer and Wine), $Billion, 2023-2034
- Table 35: Japan Non-Alcoholic Beverage Market (by Functional Beverages), $Billion, 2023-2034
- Table 36: Japan Non-Alcoholic Beverage Market (by Specialty Drinks), $Billion, 2023-2034
- Table 37: Japan Non-Alcoholic Beverage Market (by Preparation), $Billion, 2023-2034
- Table 38: Japan Non-Alcoholic Beverage Market (by Retail Packaged), $Billion, 2023-2034
- Table 39: Australia Non-Alcoholic Beverage Market (by Category), $Billion, 2023-2034
- Table 40: Australia Non-Alcoholic Beverage Market (by Water), $Billion, 2023-2034
- Table 41: Australia Non-Alcoholic Beverage Market (by Juice), $Billion, 2023-2034
- Table 42: Australia Non-Alcoholic Beverage Market (by Soft Drinks), $Billion, 2023-2034
- Table 43: Australia Non-Alcoholic Beverage Market (by Tea), $Billion, 2023-2034
- Table 44: Australia Non-Alcoholic Beverage Market (by Coffee), $Billion, 2023-2034
- Table 45: Australia Non-Alcoholic Beverage Market (by Dairy and Plant-Based Milk), $Billion, 2023-2034
- Table 46: Australia Non-Alcoholic Beverage Market (by Non-Alcoholic Beer and Wine), $Billion, 2023-2034
- Table 47: Australia Non-Alcoholic Beverage Market (by Functional Beverages), $Billion, 2023-2034
- Table 48: Australia Non-Alcoholic Beverage Market (by Specialty Drinks), $Billion, 2023-2034
- Table 49: Australia Non-Alcoholic Beverage Market (by Preparation), $Billion, 2023-2034
- Table 50: Australia Non-Alcoholic Beverage Market (by Retail Packaged), $Billion, 2023-2034
- Table 51: South Korea Non-Alcoholic Beverage Market (by Category), $Billion, 2023-2034
- Table 52: South Korea Non-Alcoholic Beverage Market (by Water), $Billion, 2023-2034
- Table 53: South Korea Non-Alcoholic Beverage Market (by Juice), $Billion, 2023-2034
- Table 54: South Korea Non-Alcoholic Beverage Market (by Soft Drinks), $Billion, 2023-2034
- Table 55: South Korea Non-Alcoholic Beverage Market (by Tea), $Billion, 2023-2034
- Table 56: South Korea Non-Alcoholic Beverage Market (by Coffee), $Billion, 2023-2034
- Table 57: South Korea Non-Alcoholic Beverage Market (by Dairy and Plant-Based Milk), $Billion, 2023-2034
- Table 58: South Korea Non-Alcoholic Beverage Market (by Non-Alcoholic Beer and Wine), $Billion, 2023-2034
- Table 59: South Korea Non-Alcoholic Beverage Market (by Functional Beverages), $Billion, 2023-2034
- Table 60: South Korea Non-Alcoholic Beverage Market (by Specialty Drinks), $Billion, 2023-2034
- Table 61: South Korea Non-Alcoholic Beverage Market (by Preparation), $Billion, 2023-2034
- Table 62: South Korea Non-Alcoholic Beverage Market (by Retail Packaged), $Billion, 2023-2034
- Table 63: India Non-Alcoholic Beverage Market (by Category), $Billion, 2023-2034
- Table 64: India Non-Alcoholic Beverage Market (by Water), $Billion, 2023-2034
- Table 65: India Non-Alcoholic Beverage Market (by Juice), $Billion, 2023-2034
- Table 66: India Non-Alcoholic Beverage Market (by Soft Drinks), $Billion, 2023-2034
- Table 67: India Non-Alcoholic Beverage Market (by Tea), $Billion, 2023-2034
- Table 68: India Non-Alcoholic Beverage Market (by Coffee), $Billion, 2023-2034
- Table 69: India Non-Alcoholic Beverage Market (by Dairy and Plant-Based Milk), $Billion, 2023-2034
- Table 70: India Non-Alcoholic Beverage Market (by Non-Alcoholic Beer and Wine), $Billion, 2023-2034
- Table 71: India Non-Alcoholic Beverage Market (by Functional Beverages), $Billion, 2023-2034
- Table 72: India Non-Alcoholic Beverage Market (by Specialty Drinks), $Billion, 2023-2034
- Table 73: India Non-Alcoholic Beverage Market (by Preparation), $Billion, 2023-2034
- Table 74: India Non-Alcoholic Beverage Market (by Retail Packaged), $Billion, 2023-2034
- Table 75: Rest-of-Asia-Pacific Non-Alcoholic Beverage Market (by Category), $Billion, 2023-2034
- Table 76: Rest-of-Asia-Pacific Non-Alcoholic Beverage Market (by Water), $Billion, 2023-2034
- Table 77: Rest-of-Asia-Pacific Non-Alcoholic Beverage Market (by Juice), $Billion, 2023-2034
- Table 78: Rest-of-Asia-Pacific Non-Alcoholic Beverage Market (by Soft Drinks), $Billion, 2023-2034
- Table 79: Rest-of-Asia-Pacific Non-Alcoholic Beverage Market (by Tea), $Billion, 2023-2034
- Table 80: Rest-of-Asia-Pacific Non-Alcoholic Beverage Market (by Coffee), $Billion, 2023-2034
- Table 81: Rest-of-Asia-Pacific Non-Alcoholic Beverage Market (by Dairy and Plant-Based Milk), $Billion, 2023-2034
- Table 82: Rest-of-Asia-Pacific Non-Alcoholic Beverage Market (by Non-Alcoholic Beer and Wine), $Billion, 2023-2034
- Table 83: Rest-of-Asia-Pacific Non-Alcoholic Beverage Market (by Functional Beverages), $Billion, 2023-2034
- Table 84: Rest-of-Asia-Pacific Non-Alcoholic Beverage Market (by Specialty Drinks), $Billion, 2023-2034
- Table 85: Rest-of-Asia-Pacific Non-Alcoholic Beverage Market (by Preparation), $Billion, 2023-2034
- Table 86: Rest-of-Asia-Pacific Non-Alcoholic Beverage Market (by Retail Packaged), $Billion, 2023-2034
- Table 87: Market Share, 2023
Introduction to Asia-Pacific Non-Alcoholic Beverage Market
The Asia-Pacific non-alcoholic beverage market is projected to reach $1,029.5 million by 2034 from $505.5 million in 2024, growing at a CAGR of 7.37% during the forecast period 2024-2034. The APAC non-alcoholic beverage market is diverse, with products such as juices, teas, coffees, soft drinks, bottled water, and functional beverages. The market is expanding as consumer preferences shift toward healthier and more diverse drink options. The growing demand for beverages with extra health benefits is being met by innovations like plant-based waters and functional drinks.
Leading corporations like The Coca-Cola Company, PepsiCo, and Nestle dominate the market, which is extremely competitive. Consumer preferences are changing due to increased awareness of sustainability and wellness, which is driving companies to spend money on eco-friendly packaging and natural ingredients. Offering fresh, healthier substitutes for conventional beverages and adjusting to the shifting tastes and lifestyles of APAC consumers, this vibrant market is still growing.
| KEY MARKET STATISTICS | |
|---|---|
| Forecast Period | 2024 - 2034 |
| 2024 Evaluation | $505.5 Million |
| 2034 Forecast | $1,029.5 Million |
| CAGR | 7.37% |
Market Introduction
The market for non-alcoholic beverages in Asia-Pacific is expanding significantly due to changing consumer tastes for more varied and healthful drink options. Juices, teas, coffees, soft drinks, bottled water, and functional beverages are just a few of the many products available in the market. There is also a growing demand for beverages with additional nutritional value and health advantages. Customers are choosing drinks that are not only refreshing but also offer practical advantages like hydration, support for digestion, and energy boosts as they grow more health conscious.
The demand for wellness-focused products is being met by innovations in product development, such as the launch of plant-based beverages, sugar-free alternatives, and functional drinks with probiotics, vitamins, and minerals added. The market is also changing as a result of the rising demand for natural, organic, and low-calorie beverages.
The market is dominated by big international companies like Nestle, PepsiCo, and The Coca-Cola Company, who are always coming up with new ideas to satisfy changing consumer tastes. With rising demand for natural ingredients and eco-friendly packaging, sustainability is emerging as a major issue in the APAC market in addition to health.
The non-alcoholic beverage market is anticipated to keep growing as the APAC region continues to see rapid urbanization, rising disposable income, and shifting lifestyles. It will provide a wide range of options that appeal to consumers who are sustainability-driven and health-conscious.
Market Segmentation
Segmentation 1: by Category
- Water
- Juices
- Soft Drinks
- Tea
- Coffee
- Dairy and Plant-Based Milk
- Non-Alcoholic Beer and Wine
- Functional Beverages
- Specialty Drinks
By Water
- Still Water
- Sparkling Water
- Flavored Water
By Juices
- Fruit Juices
- Vegetable Juices
- Smoothies
By Soft Drinks
- Sodas
- Non-Carbonated Soft Drinks
By Tea
- Traditional Tea
- Herbal Tea
- Iced Tea
By Coffee
- Brewed Coffee
- Espresso
- Cold Brew Coffee
- Decaffeinated Coffee
By Dairy and Plant-Based Milk
- Raw Milk
- Plant-Based Milk
- Milk-Based Shakes and Drinks
By Non-Alcoholic Beer and Wine
- Non-Alcoholic Beer
- Non-Alcoholic Wine
By Functional Beverages
- Energy Drinks
- Sports Drinks
- Probiotic Drinks
- Fortified Water and Juice
- Others
By Specialty Drinks
- Mocktails
- Coconut Water
- Kombucha
- Others
Segmentation 2: by Preparation
- Retail Packaged
- Ready-to-Drink
- Pre-Mix Beverages
- Syrups and Concentrates
- Mixers
- Restaurants and Food Chain
Segmentation 3: by Country
- China
- Japan
- Australia
- South Korea
- India
- Rest-of-Asia-Pacific
How can this report add value to an organization?
Product/Innovation Strategy: The product segment helps the reader understand the different types of products available in Asia-Pacific region. Moreover, the study provides the reader with a detailed understanding of the non-alcoholic beverage market by products based on category and preparation.
Growth/Marketing Strategy: The Asia-Pacific non-alcoholic beverage market has seen major development by key players operating in the market, such as business expansion, partnership, collaboration, and joint venture. The favored strategy for the companies has been product launches and acquisitions to strengthen their position in the non-alcoholic beverage market.
Competitive Strategy: Key players in the Asia-Pacific non-alcoholic beverage market have been analyzed and profiled in the study of non-alcoholic beverage products. Moreover, a detailed competitive benchmarking of the players operating in the non-alcoholic beverage market has been done to help the reader understand how players stack against each other, presenting a clear market landscape. Additionally, comprehensive competitive strategies such as partnerships, agreements, and collaborations will aid the reader in understanding the untapped revenue pockets in the market.
Key Market Players and Competition Synopsis
The companies that are profiled have been selected based on thorough secondary research, which includes analyzing company coverage, product portfolio, market penetration, and insights gathered from primary experts.
Some prominent names established in this market are:
- Tata Consumer Products Limited
- SUNTORY BEVERAGE & FOOD LIMITED
- ASAHI GROUP HOLDINGS, LTD.
- Kirin Holdings Company Limited
Table of Contents
Executive Summary
Scope and Definition
1 Markets
- 1.1 Trends: Current and Future Impact Assessment
- 1.1.1 Beverage Trends
- 1.1.1.1 Rise of Functional Beverages
- 1.1.1.1.1 Investments and Key Companies
- 1.1.1.2 Personalized Beverages
- 1.1.1.2.1 Investments and Key Companies
- 1.1.1.3 Plant-Based Waters
- 1.1.1.3.1 Investments and Key Companies
- 1.1.1.4 Non-Alcoholic Alternatives
- 1.1.1.4.1 Investments and Key Companies
- 1.1.1.1 Rise of Functional Beverages
- 1.1.2 Consumer Preferences and Change in Drinking Habits
- 1.1.3 Trends Observed
- 1.1.1 Beverage Trends
- 1.2 Supply Chain Overview
- 1.2.1 Value Chain Analysis
- 1.2.2 Pricing Forecast
- 1.3 Research and Development Review
- 1.3.1 Patent Filing Trend (by Country, Company)
- 1.4 Regulatory Landscape
- 1.5 Market Dynamics Overview
- 1.5.1 Market Drivers
- 1.5.1.1 Growing Population and Urbanization
- 1.5.1.2 Growing Demand for Alcohol Alternatives
- 1.5.2 Market Challenges
- 1.5.2.1 Strict Government Regulations for the Food and Beverage Industry
- 1.5.2.2 Volatility in Ingredient Costs
- 1.5.3 Market Opportunities
- 1.5.3.1 Growth of E-Commerce for the Beverage Industry
- 1.5.1 Market Drivers
- 1.6 Startup Funding Summary
2 Regions
- 2.1 Regional Summary
- 2.2 Asia-Pacific
- 2.2.1 Regional Overview
- 2.2.2 Driving Factors for Market Growth
- 2.2.3 Factors Challenging the Market
- 2.2.3.1 Trends Identified
- 2.2.4 Product
- 2.2.5 China
- 2.2.6 Japan
- 2.2.7 Australia
- 2.2.8 South Korea
- 2.2.9 India
- 2.2.10 Rest-of-Asia-Pacific
3 Markets - Competitive Benchmarking & Company Profiles
- 3.1 Next Frontiers
- 3.2 Geographic Assessment
- 3.2.1 Tata Consumer Products Limited
- 3.2.1.1 Overview
- 3.2.1.2 Top Products/Product Portfolio
- 3.2.1.3 Top Competitors
- 3.2.1.4 Target Customers
- 3.2.1.5 Market Developments
- 3.2.1.6 Mergers and Acquisitions
- 3.2.1.7 Key Focus Area
- 3.2.1.8 Analyst View
- 3.2.2 SUNTORY BEVERAGE & FOOD LIMITED
- 3.2.2.1 Overview
- 3.2.2.2 Top Products/Product Portfolio
- 3.2.2.3 Top Competitors
- 3.2.2.4 Target Customers
- 3.2.2.5 Mergers and Acquisitions
- 3.2.2.6 Key Focus Area
- 3.2.2.7 Analyst View
- 3.2.3 ASAHI GROUP HOLDINGS, LTD.
- 3.2.3.1 Overview
- 3.2.3.2 Top Products/Product Portfolio
- 3.2.3.3 Top Competitors
- 3.2.3.4 Target Customers
- 3.2.3.5 Market Developments
- 3.2.3.6 Recent Investments
- 3.2.3.7 Key Focus Area
- 3.2.3.8 Analyst View
- 3.2.4 Kirin Holdings Company Limited
- 3.2.4.1 Overview
- 3.2.4.2 Top Products/Product Portfolio
- 3.2.4.3 Top Competitors
- 3.2.4.4 Target Customers
- 3.2.4.5 Market Developments
- 3.2.4.6 Key Focus Area
- 3.2.4.7 Analyst View
- 3.2.1 Tata Consumer Products Limited
4 Research Methodology
- 4.1 Data Sources
- 4.1.1 Primary Data Sources
- 4.1.2 Secondary Data Sources
- 4.1.3 Data Triangulation
- 4.2 Market Estimation and Forecast


