|
|
市場調査レポート
商品コード
1423716
バブル食品および飲料の2030年までの市場予測:製品別、原料別、流通チャネル別、地域別の世界分析Bubble Food and Beverages Market Forecasts to 2030 - Global Analysis By Product (Bubble Tea, Desserts and Other Products), By Source (Tapioca-Based and Bursting Bubble), Distribution Channel and By Geography |
||||||
|
|||||||
カスタマイズ可能
|
|||||||

| バブル食品および飲料の2030年までの市場予測:製品別、原料別、流通チャネル別、地域別の世界分析 |
|
出版日: 2024年02月02日
発行: Stratistics Market Research Consulting
ページ情報: 英文 200+ Pages
納期: 2~3営業日
|

全表示
- 概要
- 図表
- 目次
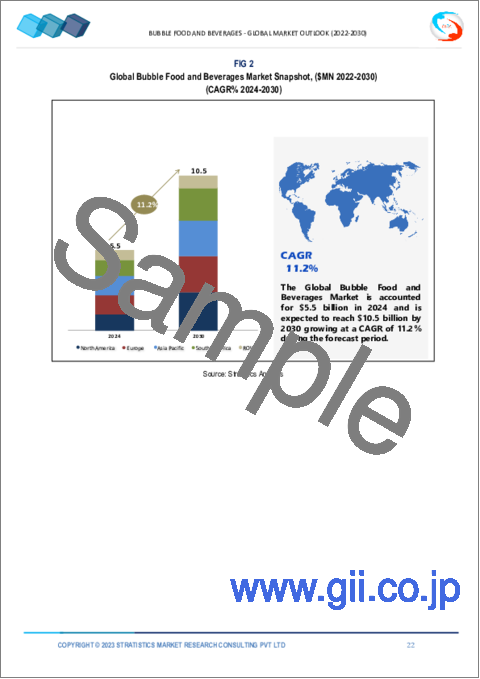
Stratistics MRCによると、世界のバブル食品および飲料市場は2023年に50億米ドルを占め、予測期間中にCAGR 11.2%で成長し、2030年には105億米ドルに達する見込みです。
飲食品とは、ユニークで革新的な要素として食用の泡を取り入れた料理アイテムを指します。これらの泡は通常、分子ガストロノミーのような技術を用いて作られ、寒天やゼラチンのような材料を用いて薄い膜の中に風味を封じ込める。
IBISWorldの調査によると、米国のバブルティー専門店の数は2022年時点で3,096店に達し、前年比23.4%の大幅増となり、増加傾向は衰えることなく続くようです。QianZhen Industry Research Instituteのデータによると、中国におけるお茶関連飲料の市場規模は2018年に537億元(約76億3,000万米ドル)に達しました。
バブルティーの人気上昇とソーシャルメディアの影響力
バブルティーの人気上昇は、ソーシャルメディアの影響力を含むいくつかの推進力によって後押しされています。インスタグラムやTikTokのような動向は、視覚的に魅力的でカスタマイズ可能なバブルティーの選択肢を紹介し、消費者が積極的に自分の体験を共有する傾向を促進し、飲料にまつわる話題を生み出しています。タピオカパール、多様なフレーバー、カスタマイズ可能なオプションというユニークな組み合わせは、斬新で共有可能な体験を求める若年層にアピールし、ソーシャルメディア・バイラリティを通じて飲料のリーチと需要を増幅しています。
特定原材料への依存度の高さ
特定の原材料への依存度が高いことは、様々な業界、特に飲食品製造において抑制要因となります。特定の原材料への依存は、気候変動、地政学的問題、市況などの要因によるサプライチェーンの脆弱性、価格変動、希少性につながる可能性があります。こうした依存は、一貫した生産、品質管理、コストの安定性にリスクをもたらします。多様化や代替は困難となり、製品の入手性に影響を与え、イノベーションを制限する可能性があり、この分野のメーカーに制約を課すことになります。
アジア文化への認識と関心の高まり
アジア文化に対する認識と関心の高まりは、様々な業界において特筆すべき機会となっています。この動向は、伝統的な食品、飲食品、娯楽を含む、本格的なアジア料理、文化体験、製品に対する需要の増加に拍車をかける。このような関心の高まりは、異文化交流を促し、多様な料理の探求や革新的なフュージョン創作を育みます。企業は、本物のアジアの味、文化的イベント、ユニークな体験を紹介することで、多様で没入感のある文化的出会いを求める受容的な市場を開拓し、この関心を活用することができます。
既存の飲料・スナック・カテゴリーとの競合
定評のあるブランドは消費者の信頼を得ており、広範な流通網を持ち、強力なマーケティング戦略を持っています。発バブル食品および飲料を導入するには、消費者の嗜好を慣れ親しんだ選択肢から逸らすという課題に直面します。消費者に、信頼できるブランドから革新的なバブル料理体験へと移行するよう説得するには、競争の激しい市場内でニッチを切り開くための多大なマーケティング努力と製品の差別化が必要であり、新規参入企業にとっては大きな課題となります。
COVID-19の影響:
COVID-19パンデミックはバブル食品および飲料業界を大きく混乱させました。レストランの閉鎖、イベントの中止、厳格な衛生規程により体験型飲食が制限され、バブル・フードのような革新的な料理動向の導入に影響が出ました。サプライチェーンの混乱や経済の不確実性も、製品のイントロダクションやマーケティング活動の妨げとなった。消費者の優先順位は必需品にシフトし、斬新な食体験に対する需要が減少しました。こうした要因が相まって、パンデミックの間、バブル食品と飲食品の成長と普及が鈍化しました。
予測期間中、バブルティー・セグメントが最大になると予想される
バブルティー・セグメントは、その確立された市場プレゼンスと広範な人気により、予測期間中に最大となる見込みです。アジアを中心に世界の消費者層を持ち、世界的に急速に拡大しているバブルティーは、絶大な支持を得ています。その多様なフレーバー、タピオカパール(ボバ)、カスタマイズ可能なオプションは様々な嗜好に対応し、幅広い層を魅了しています。さらに、フレーバー、素材、プレゼンテーションにおける絶え間ないイノベーションが、バブルティー・セグメントの持続的成長と優位性をさらに後押ししています。
オン・トレード分野は予測期間中最も高いCAGRが見込まれる
オン・トレード分野は、パンデミック規制の緩和や外食・社交活動の復活などの要因により、予測期間中に良好な成長率を経験すると予測されます。レストラン、バー、娯楽施設の再開に伴い、体験型ダイニングやバブル食品および飲料のような斬新な料理への消費者の傾倒が高まっています。このようなユニークな食事体験に対する消費者の新たな関心は、オン・トレード・セグメントにおける著しい成長と採用を促進すると予想されます。
最大のシェアを持つ地域:
アジア太平洋地域は、バブルティーの人気と文化的意義が広く浸透しているため、市場シェアでリードする立場にあります。台湾、中国、韓国、日本などの国々には強力な消費者基盤があり、多様で革新的なバブルティーに対する需要は旺盛です。新しいフレーバーやバリエーションの絶え間ない出現は、この地域の深く根付いた茶文化と相まって、アジア太平洋地域の市場における優位性に貢献しており、世界のバブルティー産業の主要な牽引役となっています。
CAGRが最も高い地域:
北米地域は、バブル食品および飲料のような革新的な料理を採用する傾向の高まりと相まって、消費者の意識の高まりやユニークな食体験への需要といった要因によって、大きな成長を遂げる位置にあります。この地域の多様でダイナミックな食文化は、斬新な動向を好む消費者層と相まって、バブル食品・飲料市場の拡大に有利な環境を生み出しています。これは、この地域の経済的安定性と相まって、大きな成長機会をもたらしています。
無料のカスタマイズサービス:
本レポートをご購読のお客様には、以下の無料カスタマイズオプションのいずれかをご利用いただけます:
- 企業プロファイル
- 追加市場プレーヤーの包括的プロファイリング(3社まで)
- 主要企業のSWOT分析(3社まで)
- 地域セグメンテーション
- 顧客の関心に応じた主要国の市場推計・予測・CAGR(注:フィージビリティチェックによる)
- 競合ベンチマーキング
- 製品ポートフォリオ、地理的プレゼンス、戦略的提携に基づく主要企業のベンチマーキング
目次
第1章 エグゼクティブサマリー
第2章 序文
- 概要
- ステークホルダー
- 調査範囲
- 調査手法
- データマイニング
- データ分析
- データ検証
- 調査アプローチ
- 調査ソース
- 1次調査ソース
- 2次調査ソース
- 前提条件
第3章 市場動向分析
- 促進要因
- 抑制要因
- 機会
- 脅威
- 製品分析
- 新型コロナウイルス感染症(COVID-19)の影響
第4章 ポーターのファイブフォース分析
- 供給企業の交渉力
- 買い手の交渉力
- 代替品の脅威
- 新規参入業者の脅威
- 競争企業間の敵対関係
第5章 世界のバブル食品および飲料市場:製品別
- タピオカティー
- デザート
- フルーツスナック
- フルーツ飲料
- その他の製品
第6章 世界のバブル食品および飲料市場:原料別
- タピオカベース
- バースティングバブル
第7章 世界のバブル食品および飲料市場:流通チャネル別
- 貿易中
- レストラン
- カフェ
- タピオカティーショップ
- オフトレード
- ハイパーマーケットとスーパーマーケット
- コンビニエンスストア
- オンライン小売業者
第8章 世界のバブル食品および飲料市場:地域別
- 北米
- 米国
- カナダ
- メキシコ
- 欧州
- ドイツ
- 英国
- イタリア
- フランス
- スペイン
- その他欧州
- アジア太平洋地域
- 日本
- 中国
- インド
- オーストラリア
- ニュージーランド
- 韓国
- その他アジア太平洋地域
- 南米
- アルゼンチン
- ブラジル
- チリ
- その他南米
- 中東とアフリカ
- サウジアラビア
- アラブ首長国連邦
- カタール
- 南アフリカ
- その他中東とアフリカ
第9章 主な発展
- 契約、パートナーシップ、コラボレーション、合弁事業
- 買収と合併
- 新製品の発売
- 事業拡大
- その他の主要戦略
第10章 企業プロファイル
- AB World Foods
- Anheuser-Busch InBev
- Campbell Soup Company
- Chen En Foods
- Constellation Brands
- Danone
- Diageo
- Ferrero
- General Mills
- Heineken
- Kellogg's
- Keurig Dr Pepper
- Mars, Incorporated
- Mondelez International
- Nestle
- PepsiCo
- Suntory Holdings Limited
- Tealive
- The Coca-Cola Company
- The Hershey Company
- The Kraft Heinz Company
- Unilever plc
List of Tables
- Table 1 Global Bubble Food and Beverages Market Outlook, By Region (2021-2030) ($MN)
- Table 2 Global Bubble Food and Beverages Market Outlook, By Product (2021-2030) ($MN)
- Table 3 Global Bubble Food and Beverages Market Outlook, By Bubble Tea (2021-2030) ($MN)
- Table 4 Global Bubble Food and Beverages Market Outlook, By Desserts (2021-2030) ($MN)
- Table 5 Global Bubble Food and Beverages Market Outlook, By Fruit Snacks (2021-2030) ($MN)
- Table 6 Global Bubble Food and Beverages Market Outlook, By Fruits Beverages (2021-2030) ($MN)
- Table 7 Global Bubble Food and Beverages Market Outlook, By Other Products (2021-2030) ($MN)
- Table 8 Global Bubble Food and Beverages Market Outlook, By Source (2021-2030) ($MN)
- Table 9 Global Bubble Food and Beverages Market Outlook, By Tapioca-Based (2021-2030) ($MN)
- Table 10 Global Bubble Food and Beverages Market Outlook, By Bursting Bubble (2021-2030) ($MN)
- Table 11 Global Bubble Food and Beverages Market Outlook, By Distribution Channel (2021-2030) ($MN)
- Table 12 Global Bubble Food and Beverages Market Outlook, By On-trade (2021-2030) ($MN)
- Table 13 Global Bubble Food and Beverages Market Outlook, By Restaurants (2021-2030) ($MN)
- Table 14 Global Bubble Food and Beverages Market Outlook, By Cafes (2021-2030) ($MN)
- Table 15 Global Bubble Food and Beverages Market Outlook, By Bubble Tea Shops (2021-2030) ($MN)
- Table 16 Global Bubble Food and Beverages Market Outlook, By Off-trade (2021-2030) ($MN)
- Table 17 Global Bubble Food and Beverages Market Outlook, By Hypermarkets & Supermarkets (2021-2030) ($MN)
- Table 18 Global Bubble Food and Beverages Market Outlook, By Convenience stores (2021-2030) ($MN)
- Table 19 Global Bubble Food and Beverages Market Outlook, By Online retailers (2021-2030) ($MN)
- Table 20 North America Bubble Food and Beverages Market Outlook, By Country (2021-2030) ($MN)
- Table 21 North America Bubble Food and Beverages Market Outlook, By Product (2021-2030) ($MN)
- Table 22 North America Bubble Food and Beverages Market Outlook, By Bubble Tea (2021-2030) ($MN)
- Table 23 North America Bubble Food and Beverages Market Outlook, By Desserts (2021-2030) ($MN)
- Table 24 North America Bubble Food and Beverages Market Outlook, By Fruit Snacks (2021-2030) ($MN)
- Table 25 North America Bubble Food and Beverages Market Outlook, By Fruits Beverages (2021-2030) ($MN)
- Table 26 North America Bubble Food and Beverages Market Outlook, By Other Products (2021-2030) ($MN)
- Table 27 North America Bubble Food and Beverages Market Outlook, By Source (2021-2030) ($MN)
- Table 28 North America Bubble Food and Beverages Market Outlook, By Tapioca-Based (2021-2030) ($MN)
- Table 29 North America Bubble Food and Beverages Market Outlook, By Bursting Bubble (2021-2030) ($MN)
- Table 30 North America Bubble Food and Beverages Market Outlook, By Distribution Channel (2021-2030) ($MN)
- Table 31 North America Bubble Food and Beverages Market Outlook, By On-trade (2021-2030) ($MN)
- Table 32 North America Bubble Food and Beverages Market Outlook, By Restaurants (2021-2030) ($MN)
- Table 33 North America Bubble Food and Beverages Market Outlook, By Cafes (2021-2030) ($MN)
- Table 34 North America Bubble Food and Beverages Market Outlook, By Bubble Tea Shops (2021-2030) ($MN)
- Table 35 North America Bubble Food and Beverages Market Outlook, By Off-trade (2021-2030) ($MN)
- Table 36 North America Bubble Food and Beverages Market Outlook, By Hypermarkets & Supermarkets (2021-2030) ($MN)
- Table 37 North America Bubble Food and Beverages Market Outlook, By Convenience stores (2021-2030) ($MN)
- Table 38 North America Bubble Food and Beverages Market Outlook, By Online retailers (2021-2030) ($MN)
- Table 39 Europe Bubble Food and Beverages Market Outlook, By Country (2021-2030) ($MN)
- Table 40 Europe Bubble Food and Beverages Market Outlook, By Product (2021-2030) ($MN)
- Table 41 Europe Bubble Food and Beverages Market Outlook, By Bubble Tea (2021-2030) ($MN)
- Table 42 Europe Bubble Food and Beverages Market Outlook, By Desserts (2021-2030) ($MN)
- Table 43 Europe Bubble Food and Beverages Market Outlook, By Fruit Snacks (2021-2030) ($MN)
- Table 44 Europe Bubble Food and Beverages Market Outlook, By Fruits Beverages (2021-2030) ($MN)
- Table 45 Europe Bubble Food and Beverages Market Outlook, By Other Products (2021-2030) ($MN)
- Table 46 Europe Bubble Food and Beverages Market Outlook, By Source (2021-2030) ($MN)
- Table 47 Europe Bubble Food and Beverages Market Outlook, By Tapioca-Based (2021-2030) ($MN)
- Table 48 Europe Bubble Food and Beverages Market Outlook, By Bursting Bubble (2021-2030) ($MN)
- Table 49 Europe Bubble Food and Beverages Market Outlook, By Distribution Channel (2021-2030) ($MN)
- Table 50 Europe Bubble Food and Beverages Market Outlook, By On-trade (2021-2030) ($MN)
- Table 51 Europe Bubble Food and Beverages Market Outlook, By Restaurants (2021-2030) ($MN)
- Table 52 Europe Bubble Food and Beverages Market Outlook, By Cafes (2021-2030) ($MN)
- Table 53 Europe Bubble Food and Beverages Market Outlook, By Bubble Tea Shops (2021-2030) ($MN)
- Table 54 Europe Bubble Food and Beverages Market Outlook, By Off-trade (2021-2030) ($MN)
- Table 55 Europe Bubble Food and Beverages Market Outlook, By Hypermarkets & Supermarkets (2021-2030) ($MN)
- Table 56 Europe Bubble Food and Beverages Market Outlook, By Convenience stores (2021-2030) ($MN)
- Table 57 Europe Bubble Food and Beverages Market Outlook, By Online retailers (2021-2030) ($MN)
- Table 58 Asia Pacific Bubble Food and Beverages Market Outlook, By Country (2021-2030) ($MN)
- Table 59 Asia Pacific Bubble Food and Beverages Market Outlook, By Product (2021-2030) ($MN)
- Table 60 Asia Pacific Bubble Food and Beverages Market Outlook, By Bubble Tea (2021-2030) ($MN)
- Table 61 Asia Pacific Bubble Food and Beverages Market Outlook, By Desserts (2021-2030) ($MN)
- Table 62 Asia Pacific Bubble Food and Beverages Market Outlook, By Fruit Snacks (2021-2030) ($MN)
- Table 63 Asia Pacific Bubble Food and Beverages Market Outlook, By Fruits Beverages (2021-2030) ($MN)
- Table 64 Asia Pacific Bubble Food and Beverages Market Outlook, By Other Products (2021-2030) ($MN)
- Table 65 Asia Pacific Bubble Food and Beverages Market Outlook, By Source (2021-2030) ($MN)
- Table 66 Asia Pacific Bubble Food and Beverages Market Outlook, By Tapioca-Based (2021-2030) ($MN)
- Table 67 Asia Pacific Bubble Food and Beverages Market Outlook, By Bursting Bubble (2021-2030) ($MN)
- Table 68 Asia Pacific Bubble Food and Beverages Market Outlook, By Distribution Channel (2021-2030) ($MN)
- Table 69 Asia Pacific Bubble Food and Beverages Market Outlook, By On-trade (2021-2030) ($MN)
- Table 70 Asia Pacific Bubble Food and Beverages Market Outlook, By Restaurants (2021-2030) ($MN)
- Table 71 Asia Pacific Bubble Food and Beverages Market Outlook, By Cafes (2021-2030) ($MN)
- Table 72 Asia Pacific Bubble Food and Beverages Market Outlook, By Bubble Tea Shops (2021-2030) ($MN)
- Table 73 Asia Pacific Bubble Food and Beverages Market Outlook, By Off-trade (2021-2030) ($MN)
- Table 74 Asia Pacific Bubble Food and Beverages Market Outlook, By Hypermarkets & Supermarkets (2021-2030) ($MN)
- Table 75 Asia Pacific Bubble Food and Beverages Market Outlook, By Convenience stores (2021-2030) ($MN)
- Table 76 Asia Pacific Bubble Food and Beverages Market Outlook, By Online retailers (2021-2030) ($MN)
- Table 77 South America Bubble Food and Beverages Market Outlook, By Country (2021-2030) ($MN)
- Table 78 South America Bubble Food and Beverages Market Outlook, By Product (2021-2030) ($MN)
- Table 79 South America Bubble Food and Beverages Market Outlook, By Bubble Tea (2021-2030) ($MN)
- Table 80 South America Bubble Food and Beverages Market Outlook, By Desserts (2021-2030) ($MN)
- Table 81 South America Bubble Food and Beverages Market Outlook, By Fruit Snacks (2021-2030) ($MN)
- Table 82 South America Bubble Food and Beverages Market Outlook, By Fruits Beverages (2021-2030) ($MN)
- Table 83 South America Bubble Food and Beverages Market Outlook, By Other Products (2021-2030) ($MN)
- Table 84 South America Bubble Food and Beverages Market Outlook, By Source (2021-2030) ($MN)
- Table 85 South America Bubble Food and Beverages Market Outlook, By Tapioca-Based (2021-2030) ($MN)
- Table 86 South America Bubble Food and Beverages Market Outlook, By Bursting Bubble (2021-2030) ($MN)
- Table 87 South America Bubble Food and Beverages Market Outlook, By Distribution Channel (2021-2030) ($MN)
- Table 88 South America Bubble Food and Beverages Market Outlook, By On-trade (2021-2030) ($MN)
- Table 89 South America Bubble Food and Beverages Market Outlook, By Restaurants (2021-2030) ($MN)
- Table 90 South America Bubble Food and Beverages Market Outlook, By Cafes (2021-2030) ($MN)
- Table 91 South America Bubble Food and Beverages Market Outlook, By Bubble Tea Shops (2021-2030) ($MN)
- Table 92 South America Bubble Food and Beverages Market Outlook, By Off-trade (2021-2030) ($MN)
- Table 93 South America Bubble Food and Beverages Market Outlook, By Hypermarkets & Supermarkets (2021-2030) ($MN)
- Table 94 South America Bubble Food and Beverages Market Outlook, By Convenience stores (2021-2030) ($MN)
- Table 95 South America Bubble Food and Beverages Market Outlook, By Online retailers (2021-2030) ($MN)
- Table 96 Middle East & Africa Bubble Food and Beverages Market Outlook, By Country (2021-2030) ($MN)
- Table 97 Middle East & Africa Bubble Food and Beverages Market Outlook, By Product (2021-2030) ($MN)
- Table 98 Middle East & Africa Bubble Food and Beverages Market Outlook, By Bubble Tea (2021-2030) ($MN)
- Table 99 Middle East & Africa Bubble Food and Beverages Market Outlook, By Desserts (2021-2030) ($MN)
- Table 100 Middle East & Africa Bubble Food and Beverages Market Outlook, By Fruit Snacks (2021-2030) ($MN)
- Table 101 Middle East & Africa Bubble Food and Beverages Market Outlook, By Fruits Beverages (2021-2030) ($MN)
- Table 102 Middle East & Africa Bubble Food and Beverages Market Outlook, By Other Products (2021-2030) ($MN)
- Table 103 Middle East & Africa Bubble Food and Beverages Market Outlook, By Source (2021-2030) ($MN)
- Table 104 Middle East & Africa Bubble Food and Beverages Market Outlook, By Tapioca-Based (2021-2030) ($MN)
- Table 105 Middle East & Africa Bubble Food and Beverages Market Outlook, By Bursting Bubble (2021-2030) ($MN)
- Table 106 Middle East & Africa Bubble Food and Beverages Market Outlook, By Distribution Channel (2021-2030) ($MN)
- Table 107 Middle East & Africa Bubble Food and Beverages Market Outlook, By On-trade (2021-2030) ($MN)
- Table 108 Middle East & Africa Bubble Food and Beverages Market Outlook, By Restaurants (2021-2030) ($MN)
- Table 109 Middle East & Africa Bubble Food and Beverages Market Outlook, By Cafes (2021-2030) ($MN)
- Table 110 Middle East & Africa Bubble Food and Beverages Market Outlook, By Bubble Tea Shops (2021-2030) ($MN)
- Table 111 Middle East & Africa Bubble Food and Beverages Market Outlook, By Off-trade (2021-2030) ($MN)
- Table 112 Middle East & Africa Bubble Food and Beverages Market Outlook, By Hypermarkets & Supermarkets (2021-2030) ($MN)
- Table 113 Middle East & Africa Bubble Food and Beverages Market Outlook, By Convenience stores (2021-2030) ($MN)
- Table 114 Middle East & Africa Bubble Food and Beverages Market Outlook, By Online retailers (2021-2030) ($MN)
According to Stratistics MRC, the Global Bubble Food and Beverages Market is accounted for $5.0 billion in 2023 and is expected to reach $10.5 billion by 2030 growing at a CAGR of 11.2% during the forecast period. Bubble food and beverages refer to culinary items that incorporate edible bubbles as a unique and innovative element. These bubbles are typically created using techniques such as molecular gastronomy, using ingredients like agar or gelatin to encapsulate flavors within a thin membrane.
According to research from IBISWorld, the number of bubble tea shops in the US has reached 3,096 as of 2022, marking a substantial increase of 23.4% from the previous year, with the upward trend appearing to continue unabated. According to data from QianZhen Industry Research Institute, the value of the tea-related beverage market in China reached 53.7 billion yuan (about $7.63 billion) in 2018.
Market Dynamics:
Driver:
Increasing popularity of bubble tea and social media influence
The rising popularity of bubble tea is propelled by several drivers, including social media influence. Platforms like Instagram and TikTok showcase visually appealing and customizable bubble tea options, driving a trend where consumers actively share their experiences, creating a buzz around the beverage. The unique combination of tapioca pearls, diverse flavors, and customizable options appeals to a younger demographic seeking novel and shareable experiences, amplifying the beverage's reach and demand through social media virality.
Restraint:
High dependence on specific ingredients
High dependence on specific ingredients acts as a restraint within various industries, particularly in food and beverage production. Reliance on specific ingredients can lead to supply chain vulnerabilities, price fluctuations or scarcity due to factors like climate change, geopolitical issues, or market conditions. This dependency poses risks to consistent production, quality control and cost stability. Diversification or substitution becomes challenging, impacting product availability, potentially limiting innovation, and imposing constraints on manufacturers within the sector.
Opportunity:
Increasing awareness and interest in Asian cultures
The rising awareness and interest in Asian cultures present a notable opportunity across various industries. This trend sparks increased demand for authentic Asian cuisines, cultural experiences and products, including traditional foods, beverages and entertainment. This growing fascination encourages cross-cultural exchanges, fostering diverse culinary explorations and innovative fusion creations. Businesses can leverage this interest by introducing authentic Asian flavors, cultural events, and unique experiences, tapping into a receptive market seeking diverse and immersive cultural encounters.
Threat:
Competition from established beverage and snack categories
Well-established brands hold consumer trust, have extensive distribution networks and have robust marketing strategies. Introducing bubble food and beverages faces the challenge of diverting consumer preferences from familiar choices. Convincing consumers to shift from trusted brands to innovative bubble culinary experiences requires significant marketing efforts and product differentiation to carve a niche within a competitive market, posing a substantial challenge for new entrants.
Covid-19 Impact:
The COVID-19 pandemic disrupted the bubble food and beverage industry significantly. Restaurant closures, event cancellations and stringent health protocols limited experiential dining, impacting the adoption of innovative culinary trends like bubble foods. Supply chain disruptions and economic uncertainties also hindered product introductions and marketing efforts. Consumer priorities shifted towards essential items, reducing the demand for novel food experiences. These factors collectively slowed the growth and adoption of bubble food and beverages during the pandemic.
The bubble tea segment is expected to be the largest during the forecast period
The bubble tea segment is poised to be the largest during the forecast period due to its established market presence and widespread popularity. With a global consumer base, particularly in Asia and expanding rapidly worldwide, bubble tea has gained immense traction. Its diverse flavors, tapioca pearls (boba) and customizable options cater to varied preferences, attracting a wide demographic. Moreover, continuous innovations in flavors, ingredient and presentation further fuel the sustained growth and dominance of the bubble tea segment.
The on-trade segment is expected to have the highest CAGR during the forecast period
The on-trade segment is projected to experience a favorable growth rate during the forecast period due to factors like easing pandemic restrictions and the resurgence of dining out and social activities. As restaurants, bars and entertainment venues reopen, there's a growing consumer inclination toward experiential dining and novel culinary offerings like bubble food and beverages. This renewed consumer interest in unique dining experiences is anticipated to drive significant growth and adoption within the on-trade segment.
Region with largest share:
Asia Pacific is positioned to lead in market share due to the widespread popularity and cultural significance of bubble tea in the region. With a strong consumer base in countries like Taiwan, China, South Korea and Japan, the demand for diverse and innovative bubble tea offerings is robust. The continual emergence of new flavors and variations, coupled with the region's deep-rooted tea culture, contributes to Asia Pacific's dominance in the market, making it a key driver of the global bubble tea industry.
Region with highest CAGR:
The North American region is positioned for significant growth due to factors such as increasing consumer awareness and demand for unique food experiences, coupled with a growing trend of adopting innovative culinary offerings like bubble food and beverages. The region's diverse and dynamic food culture, coupled with a consumer base that appreciates novel trends, creates a favorable environment for the expansion of the bubble food and beverage market. This, combined with the region's economic stability, presents substantial growth opportunities.
Key players in the market
Some of the key players in Bubble Food And Beverages Market include AB World Foods, Anheuser-Busch InBev, Campbell Soup Company, Chen En Foods, Constellation Brands, Danone, Diageo, Ferrero, General Mills, Heineken, Kellogg's, Keurig Dr Pepper, Mars, Incorporated, Mondelez International, Nestle, PepsiCo, Suntory Holdings Limited, Tealive, The Coca-Cola Company, The Hershey Company, The Kraft Heinz Company and Unilever plc.
Key Developments:
In November 2022, Malaysian bubble tea chain Tealive launches first store in Canada. The company, owned by food and beverage operator Loob Holding, said it will open 50 outlets across Canada in the next five years before a potential move into the US market.
In October 2022, Chen En Foods, a bubble tea ingredients supplier, established for over three decades in Taiwan, is in search of new business partners, such as wholesalers, importers and distributors in the U.S.
Products Covered:
- Bubble Tea
- Desserts
- Fruit Snacks
- Fruits Beverages
- Other Products
Sources Covered:
- Tapioca-Based
- Bursting Bubble
Distribution Channels Covered:
- On-trade
- Off-trade
Regions Covered:
- North America
- US
- Canada
- Mexico
- Europe
- Germany
- UK
- Italy
- France
- Spain
- Rest of Europe
- Asia Pacific
- Japan
- China
- India
- Australia
- New Zealand
- South Korea
- Rest of Asia Pacific
- South America
- Argentina
- Brazil
- Chile
- Rest of South America
- Middle East & Africa
- Saudi Arabia
- UAE
- Qatar
- South Africa
- Rest of Middle East & Africa
What our report offers:
- Market share assessments for the regional and country-level segments
- Strategic recommendations for the new entrants
- Covers Market data for the years 2021, 2022, 2023, 2026, and 2030
- Market Trends (Drivers, Constraints, Opportunities, Threats, Challenges, Investment Opportunities, and recommendations)
- Strategic recommendations in key business segments based on the market estimations
- Competitive landscaping mapping the key common trends
- Company profiling with detailed strategies, financials, and recent developments
- Supply chain trends mapping the latest technological advancements
Free Customization Offerings:
All the customers of this report will be entitled to receive one of the following free customization options:
- Company Profiling
- Comprehensive profiling of additional market players (up to 3)
- SWOT Analysis of key players (up to 3)
- Regional Segmentation
- Market estimations, Forecasts and CAGR of any prominent country as per the client's interest (Note: Depends on feasibility check)
- Competitive Benchmarking
- Benchmarking of key players based on product portfolio, geographical presence, and strategic alliances
Table of Contents
1 Executive Summary
2 Preface
- 2.1 Abstract
- 2.2 Stake Holders
- 2.3 Research Scope
- 2.4 Research Methodology
- 2.4.1 Data Mining
- 2.4.2 Data Analysis
- 2.4.3 Data Validation
- 2.4.4 Research Approach
- 2.5 Research Sources
- 2.5.1 Primary Research Sources
- 2.5.2 Secondary Research Sources
- 2.5.3 Assumptions
3 Market Trend Analysis
- 3.1 Introduction
- 3.2 Drivers
- 3.3 Restraints
- 3.4 Opportunities
- 3.5 Threats
- 3.6 Product Analysis
- 3.7 Impact of Covid-19
4 Porters Five Force Analysis
- 4.1 Bargaining power of suppliers
- 4.2 Bargaining power of buyers
- 4.3 Threat of substitutes
- 4.4 Threat of new entrants
- 4.5 Competitive rivalry
5 Global Bubble Food and Beverages Market, By Product
- 5.1 Introduction
- 5.2 Bubble Tea
- 5.3 Desserts
- 5.4 Fruit Snacks
- 5.5 Fruits Beverages
- 5.6 Other Products
6 Global Bubble Food and Beverages Market, By Source
- 6.1 Introduction
- 6.2 Tapioca-Based
- 6.3 Bursting Bubble
7 Global Bubble Food and Beverages Market, By Distribution Channel
- 7.1 Introduction
- 7.2 On-trade
- 7.2.1 Restaurants
- 7.2.2 Cafes
- 7.2.3 Bubble Tea Shops
- 7.3 Off-trade
- 7.3.1 Hypermarkets & Supermarkets
- 7.3.2 Convenience stores
- 7.3.3 Online retailers
8 Global Bubble Food and Beverages Market, By Geography
- 8.1 Introduction
- 8.2 North America
- 8.2.1 US
- 8.2.2 Canada
- 8.2.3 Mexico
- 8.3 Europe
- 8.3.1 Germany
- 8.3.2 UK
- 8.3.3 Italy
- 8.3.4 France
- 8.3.5 Spain
- 8.3.6 Rest of Europe
- 8.4 Asia Pacific
- 8.4.1 Japan
- 8.4.2 China
- 8.4.3 India
- 8.4.4 Australia
- 8.4.5 New Zealand
- 8.4.6 South Korea
- 8.4.7 Rest of Asia Pacific
- 8.5 South America
- 8.5.1 Argentina
- 8.5.2 Brazil
- 8.5.3 Chile
- 8.5.4 Rest of South America
- 8.6 Middle East & Africa
- 8.6.1 Saudi Arabia
- 8.6.2 UAE
- 8.6.3 Qatar
- 8.6.4 South Africa
- 8.6.5 Rest of Middle East & Africa
9 Key Developments
- 9.1 Agreements, Partnerships, Collaborations and Joint Ventures
- 9.2 Acquisitions & Mergers
- 9.3 New Product Launch
- 9.4 Expansions
- 9.5 Other Key Strategies
10 Company Profiling
- 10.1 AB World Foods
- 10.2 Anheuser-Busch InBev
- 10.3 Campbell Soup Company
- 10.4 Chen En Foods
- 10.5 Constellation Brands
- 10.6 Danone
- 10.7 Diageo
- 10.8 Ferrero
- 10.9 General Mills
- 10.10 Heineken
- 10.11 Kellogg's
- 10.12 Keurig Dr Pepper
- 10.13 Mars, Incorporated
- 10.14 Mondelez International
- 10.15 Nestle
- 10.16 PepsiCo
- 10.17 Suntory Holdings Limited
- 10.18 Tealive
- 10.19 The Coca-Cola Company
- 10.20 The Hershey Company
- 10.21 The Kraft Heinz Company
- 10.22 Unilever plc

