
コーザルAIの世界市場(~2035年):提供別、展開方式別、応用分野別、機能別、業界別、企業規模別、主要地域別、産業動向と予測
Causal AI Market Till 2035: Distribution by Type of Offering, Type of Deployment Mode, Areas of Application, Type of Functionality, Type of Industry Vertical, Company Size and Key Geographical Regions: Industry Trends and Global Forecasts- 発行日
- ページ情報
- 英文 203 Pages
- 納期
- 7~10営業日
- 商品コード
- 1752107
- カスタマイズ可能 お客様のご希望に応じて、既存データの加工や未掲載情報(例:国別セグメント)の追加などの対応が可能です。詳細はお問い合わせください。
- 翻訳ツール提供対象 PDF対応AI翻訳ツールの無料貸し出しサービスのご利用が可能です
- 医薬品関連専門 医薬品関連専門を専門とする市場調査会社です。
概要
コーザルAI市場の概要
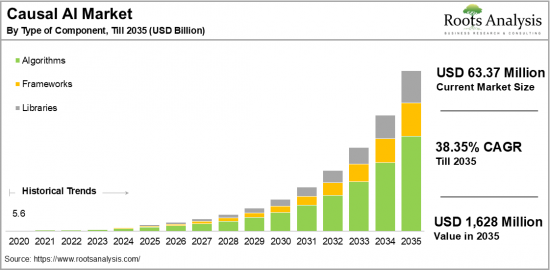
世界のコーザルAIの市場規模は、現在の6,337万米ドルから2035年までに16億2,843万米ドルに達すると予測され、2035年までの予測期間にCAGRで38.35%の成長が見込まれています。
コーザルAI市場:成長と動向
コーザルAIは、データセット内の因果関係の検出と利用に焦点を当てたAIと機械学習の分野における重要なブレークスルーを意味します。パターンを認識し予測を行うために主に相関ベースの技術に依存する従来のAIモデルとは対照的に、コーザルAIは基本的な因果関係のメカニズムを理解することが重要な状況に取り組みます。データから因果関係を明らかにすることを専門とする統計学的・哲学的分野である因果推論の原理を取り入れることで、コーザルAIはAI技術の分析能力を向上させます。
コーザルAIに対する需要は、さまざまな要因によって急増しています。さらに、自然言語で会話ができるバーチャルアシスタントやチャットボットの利用の増加が、コーザルAIアプリケーションの魅力を高めています。さらに、ハードウェア、クラウドコンピューティング、データストレージにかかるコストの低下により、AI技術はより広範な個人や組織が利用しやすくなっています。特筆すべきは、この経済的なアクセス可能性がコーザルAIソリューションの開発と統合を促進していることであり、これらのイノベーションを日常使用者に近づけることで、予測期間におけるこの市場の成長を促進しています。
当レポートでは、世界のコーザルAI市場について調査分析し、市場規模の推計と機会の分析、競合情勢、企業プロファイル、近年の発展などの情報を提供しています。
目次
セクション1 レポートの概要
第1章 序文
第2章 調査手法
第3章 市場力学
第4章 マクロ経済指標
セクション2 定性的な知見
第5章 エグゼクティブサマリー
第6章 イントロダクション
第7章 規制シナリオ
セクション3 市場の概要
第8章 主要企業の包括的なデータベース
第9章 競合情勢
第10章 ホワイトスペース分析
第11章 企業の競争力の分析
第12章 コーザルAI市場におけるスタートアップエコシステム
セクション4 企業プロファイル
第13章 企業プロファイル
- 章の概要
- Aible
- Aitia
- Actable AI
- Alibaba
- Amazon Web Services
- Amelia.ai
- Beyond Limits
- Biotx.ai
- Blue Prism
- Causa
- Causality Link
- Cognizant
- Data Poem
- DataRobot
- Dataiku
- IBM
- Microsoft
- NVIDIA
- OpenAI
セクション5 市場動向
第14章 メガトレンド分析
第15章 アンメットニーズ分析
第16章 特許分析
第17章 近年の発展
セクション6 市場機会の分析
第18章 世界のコーザルAI市場
第19章 市場機会:提供別
第20章 市場機会:展開方式別
第21章 市場機会:サービス別
第22章 市場機会:アナリティクス別
第23章 市場機会:技術別
第24章 市場機会:コンポーネント別
第25章 市場機会:応用分野別
第26章 市場機会:機能別
第27章 市場機会:業界別
第28章 北米のコーザルAI市場の機会
第29章 欧州のコーザルAI市場の機会
第30章 アジアのコーザルAI市場の機会
第31章 中東・北アフリカ(MENA)のコーザルAI市場の機会
第32章 ラテンアメリカのコーザルAI市場の機会
第33章 その他の地域のコーザルAI市場の機会
第34章 市場集中分析:主要企業別
第35章 隣接市場の分析
セクション7 戦略ツール
第36章 勝利の鍵となる戦略
第37章 ポーターのファイブフォース分析
第38章 SWOT分析
第39章 バリューチェーン分析
第40章 Rootsの戦略的提言
セクション8 その他の独占的知見
第41章 1次調査からの知見
第42章 レポートの結論
セクション9 付録
目次
Causal AI Market Overview
As per Roots Analysis, the global causal AI market size is estimated to grow from USD 63.37 million in the current year to USD 1,628.43 million by 2035, at a CAGR of 38.35% during the forecast period, till 2035.
The opportunity for causal AI market has been distributed across the following segments:
Type of Offering
- Services
- Software
Type of Deployment Mode
- Cloud
- Hybrid
- On-Premises
Type of Services
- Consulting
- Deployment & Integration
- Support and Maintenance
- Training
Type of Analytics
- Descriptive Analytics
- Predictive Analytics
- Prescriptive Analytics
Type of Technology
- Computer Vision
- Deep Learning
- Machine Learning
- Natural Language Processing
Type of Component
- Algorithms
- Frameworks
- Libraries
Areas of Application
- Customer Experience Management
- Fraud Detection
- Healthcare Diagnostics
- Marketing Optimization
- Predictive Maintenance
- Risk Management
- Supply Chain Optimization
Type of Functionality
- Causal Discovery
- Causal Inference
- Counterfactual Analysis
Type of Industry Vertical
- BFSI
- Financial Services
- Healthcare
- Manufacturing
- Retail
- Transportation & Logistics
Company Size
- Large Enterprises
- Small and Medium Enterprises
Geographical Regions
- North America
- US
- Canada
- Mexico
- Other North American countries
- Europe
- Austria
- Belgium
- Denmark
- France
- Germany
- Ireland
- Italy
- Netherlands
- Norway
- Russia
- Spain
- Sweden
- Switzerland
- UK
- Other European countries
- Asia
- China
- India
- Japan
- Singapore
- South Korea
- Other Asian countries
- Latin America
- Brazil
- Chile
- Colombia
- Venezuela
- Other Latin American countries
- Middle East and North Africa
- Egypt
- Iran
- Iraq
- Israel
- Kuwait
- Saudi Arabia
- UAE
- Other MENA countries
- Rest of the World
- Australia
- New Zealand
- Other countries
CAUSAL AI MARKET: GROWTH AND TRENDS
Causal AI signifies a significant breakthrough in the field of artificial intelligence and machine learning, focusing on the detection and application of cause-and-effect relationships within datasets. In contrast to the conventional AI models that primarily depend on correlation-based techniques to recognize patterns and make predictions, causal AI tackles situations where comprehending the fundamental causal mechanisms is crucial. By incorporating principles from causal inference, a statistical and philosophical field dedicated to uncovering causal relationships from data, causal AI improves the analytical capabilities of AI technologies.
The demand for causal AI is witnessing considerable surge driven by various factors. Further, the increasing use of virtual assistants and chatbots that can hold natural language conversations has heightened the appeal for causal AI applications. Moreover, the lower costs associated with hardware, cloud computing, and data storage have rendered AI technology more accessible to a broader spectrum of individuals and organizations. Notably, this financial accessibility has facilitated the development and integration of causal AI solutions, bringing these innovations closer to everyday users, thereby propelling the growth within this market, during the forecast period.
CAUSAL AI MARKET: KEY SEGMENTS
Market Share by Type of Offering
Based on type of offering, the global causal AI market is segmented services and software. According to our estimates, currently, services segment captures the majority share of the market. This can be attributed to the growing demand for consulting, integration, and continuous support as organizations aim to effectively implement causal AI solutions. However, the software segment is anticipated to grow at a relatively higher CAGR during the forecast period.
Market Share by Type of Deployment Mode
Based on type of deployment mode, the causal AI market is segmented into cloud, hybrid and on-premises. According to our estimates, currently, cloud segment captures the majority of the market. Further, this segment is expected to grow at a higher CAGR during the forecast period. This can be attributed to the benefits provided by cloud platforms, including scalability, accessibility, and reduced initial expenses relative to on-premises solutions.
The rising implementation of cloud technologies, coupled with the increasing demand for sophisticated analytics abilities across different sectors, is also driving market growth. Further, cloud-based solutions enable organizations to swiftly modify their resources according to demand, which is particularly advantageous for applications that need considerable computational power.
Market Share by Type of Service
Based on type of service, the causal AI market is segmented into consulting, deployment & integration, support & maintenance, and training. According to our estimates, currently, consulting segment captures the majority share of the market. This can be attributed to the important role that consulting plays in helping organizations implement and make the most of causal AI technologies. Consulting services assist businesses in comprehending how to apply causal AI to enhance decision-making processes and improve operational efficiency.
However, the support and maintenance sector is anticipated to grow at a relatively higher CAGR during the forecast period. This growth is driven by the increasing need for continuous support and training as organizations adopt causal AI solutions and seek help in optimizing their implementation and ensuring successful integration with existing systems.
Market Share by Type of Analytics
Based on type of analytics, the causal AI market is segmented into descriptive analytics, predictive analytics, and prescriptive analytics. According to our estimates, currently, predictive analytics segment captures the majority share of the market. This can be attributed to its extensive adoption by organizations to predict results based on past data and trends, making it a vital resource for decision-making across a range of industries.
In addition, the prescriptive analytics sector is projected to experience the highest CAGR during the forecast period. This is due to its capability to not only forecast results but also suggest actions to achieve intended outcomes. This feature is becoming increasingly important for companies looking to enhance their operations and strategies.
Market Share by Type of Technology
Based on type of technology, the causal AI market is segmented into computer vision, deep learning, machine learning, and natural language processing. According to our estimates, currently, machine learning segment captures the majority share of the market. This can be attributed to their capability to establish a foundation for various causal AI applications, which enables systems to learn from data and accurately discern cause-and-effect relationships.
Additionally, the natural language processing (NLP) sector is projected to experience the highest CAGR during the forecast period, owing to the rising demand for AI systems that can comprehend and interpret human language, facilitating more advanced interactions and insights from textual data.
Market Share by Type of Component
Based on type of component, the causal AI market is segmented into algorithms, frameworks, libraries. According to our estimates, currently, algorithms segment captures the majority share of the market. This can be attributed to the fact that algorithms serve as the foundation of causal AI models, allowing for the identification and examination of cause-and-effect relationships in data.
Additionally, the frameworks segment is projected to experience the highest CAGR during the forecast period. This is likely to be driven by the rising demand for strong frameworks that support the development and implementation of causal AI applications, enabling organizations to utilize these technologies more efficiently and effectively.
Market Share by Areas of Application
Based on areas of application, the causal AI market is segmented into customer experience management, fraud detection, healthcare diagnostics, marketing optimization, predictive maintenance, risk management, and supply chain optimization. According to our estimates, currently, healthcare diagnostics segment captures the majority share of the market. This can be attributed to the rising need for advanced analytics in the healthcare sector to enhance patient outcomes and improve operational efficiency.
Additionally, the fraud detection segment is projected to experience the highest CAGR during the forecast period. This increase can be linked to the growing demand for stronger security measures in financial services and other industries, as organizations aim to utilize causal AI to better identify and mitigate fraudulent activities. As a result, there is a heightened interest in causal AI within both healthcare and finance.
Market Share by Type of Functionality
Based on type of functionality, the causal AI market is segmented into causal discovery, causal inference, and counterfactual analysis. According to our estimates, currently, causal inference segment captures the majority share of the market. This can be attributed to the fact that it enables organizations to extract valuable insights about cause-and-effect relationships from data, which is crucial for making informed decisions across different industries.
Additionally, the growing awareness of its significance in improving decision-making processes, especially in areas such as marketing, healthcare, and operations, is significantly contributing to the growth of the market.
Market Share by Types of Industry Vertical
Based on types of industry vertical, the causal AI market is segmented into BFSI, financial services, healthcare, manufacturing, retail, transportation & logistics. According to our estimates, currently, healthcare segment captures the majority share of the market. This can be attributed to its capability to uncover causal connections among genetic, environmental, and lifestyle influences, as well as particular diseases, while offering valuable perspectives on intricate biological systems, disease pathways, and the effectiveness of treatments.
In addition, the manufacturing sector is projected to experience the highest CAGR during the forecast period. This surge can be linked to the rising implementation of causal AI in areas such as predictive maintenance, quality assurance, and supply chain optimization.
Market Share by Company Size
Based on company size, the causal AI market is segmented into large and small and medium enterprise. According to our estimates, currently, large enterprise segment captures the majority share of the market. However, the small and medium enterprise segment is expected to experience a comparatively higher growth rate during the forecast period. This growth can be attributed to their flexibility, innovation, emphasis on niche markets, and capability to adjust to evolving customer preferences and market dynamics.
Market Share by Geographical Regions
Based on geographical regions, the causal AI market is segmented into North America, Europe, Asia, Latin America, Middle East and North Africa, and the rest of the world. According to our estimates, currently, North America captures the majority share of the market. This can be attributed to the presence of leading technology companies, academic institutions, and research organizations that are significantly contributing to advancements in causal AI and are engaged in pioneering research in AI algorithms, causal inference, and related fields..
Example Players in Causal AI Market
- Aible
- Aitia
- Actable AI
- Alibaba
- Amazon Web Services
- Amelia.ai
- Beyond Limits
- Biotx.ai
- Blue Prism
- Causa
- CausaAI
- CausaLens
- Causaly
- Causely
- Causality Link
- Cognizant
- CognitiveScale
- Data Poem
- DataRobot
- Dataiku
- Databricks
- Descartes Labs
- Dynatrace
- Element AI
- Ernst & Young
- Geminos
- Glencoe Software
- Howso
- H2O.ai
- IBM
- Impact Genome
- Incrmntl
- Intel
- Lifesight
- Logility
- Microsoft
- Modzy
- Nebula
- NVIDIA
- OpenAI
- Oracle
- Parabole.AI
- PwC
- RapidMiner
- Restackio
- Salesforce
- SAP SE
- Scalnyx
- Seldon
- Shopify
- Slack
- Snowflake
- Symphony Ayasdi AI
- Taskade
- ThoughtSpot
- TikTok
- Trifacta
- Uber
- Unlearn.AI
- VELDT
- Wipro
CAUSAL AI MARKET: RESEARCH COVERAGE
The report on the causal AI market features insights on various sections, including:
- Market Sizing and Opportunity Analysis: An in-depth analysis of the causal AI market, focusing on key market segments, including [A] type of offering, [B] type of deployment mode, [C] type of services, [D] type of analytics, [E] type of technology, [F] type of component, [G] areas of application, [H] type of functionality, [I] type of industry vertical, [J] company size and [K] key geographical regions.
- Competitive Landscape: A comprehensive analysis of the companies engaged in the causal AI market, based on several relevant parameters, such as [A] year of establishment, [B] company size, [C] location of headquarters and [D] ownership structure.
- Company Profiles: Elaborate profiles of prominent players engaged in the causal AI market, providing details on [A] location of headquarters, [B]company size, [C] company mission, [D] company footprint, [E] management team, [F] contact details, [G] financial information, [H] operating business segments, [I] causal AI portfolio, [J] moat analysis, [K] recent developments, and an informed future outlook.
- Megatrends: An evaluation of ongoing megatrends in causal AI industry.
- Patent Analysis: An insightful analysis of patents filed / granted in the causal AI domain, based on relevant parameters, including [A] type of patent, [B] patent publication year, [C] patent age and [D] leading players.
- Recent Developments: An overview of the recent developments made in the causal AI market, along with analysis based on relevant parameters, including [A] year of initiative, [B] type of initiative, [C] geographical distribution and [D] most active players.
- Porter's Five Forces Analysis: An analysis of five competitive forces prevailing in the causal AI market, including threats of new entrants, bargaining power of buyers, bargaining power of suppliers, threats of substitute products and rivalry among existing competitors.
- SWOT Analysis: An insightful SWOT framework, highlighting the strengths, weaknesses, opportunities and threats in the domain. Additionally, it provides Harvey ball analysis, highlighting the relative impact of each SWOT parameter.
KEY QUESTIONS ANSWERED IN THIS REPORT
- How many companies are currently engaged in causal AI market?
- Which are the leading companies in this market?
- What factors are likely to influence the evolution of this market?
- What is the current and future market size?
- What is the CAGR of this market?
- How is the current and future market opportunity likely to be distributed across key market segments?
REASONS TO BUY THIS REPORT
- The report provides a comprehensive market analysis, offering detailed revenue projections of the overall market and its specific sub-segments. This information is valuable to both established market leaders and emerging entrants.
- Stakeholders can leverage the report to gain a deeper understanding of the competitive dynamics within the market. By analyzing the competitive landscape, businesses can make informed decisions to optimize their market positioning and develop effective go-to-market strategies.
- The report offers stakeholders a comprehensive overview of the market, including key drivers, barriers, opportunities, and challenges. This information empowers stakeholders to stay abreast of market trends and make data-driven decisions to capitalize on growth prospects.
ADDITIONAL BENEFITS
- Complimentary Excel Data Packs for all Analytical Modules in the Report
- 15% Free Content Customization
- Detailed Report Walkthrough Session with Research Team
- Free Updated report if the report is 6-12 months old or older
TABLE OF CONTENTS
SECTION I: REPORT OVERVIEW
1. PREFACE
- 1.1. Introduction
- 1.2. Market Share Insights
- 1.3. Key Market Insights
- 1.4. Report Coverage
- 1.5. Key Questions Answered
- 1.6. Chapter Outlines
2. RESEARCH METHODOLOGY
- 2.1. Chapter Overview
- 2.2. Research Assumptions
- 2.3. Database Building
- 2.3.1. Data Collection
- 2.3.2. Data Validation
- 2.3.3. Data Analysis
- 2.4. Project Methodology
- 2.4.1. Secondary Research
- 2.4.1.1. Annual Reports
- 2.4.1.2. Academic Research Papers
- 2.4.1.3. Company Websites
- 2.4.1.4. Investor Presentations
- 2.4.1.5. Regulatory Filings
- 2.4.1.6. White Papers
- 2.4.1.7. Industry Publications
- 2.4.1.8. Conferences and Seminars
- 2.4.1.9. Government Portals
- 2.4.1.10. Media and Press Releases
- 2.4.1.11. Newsletters
- 2.4.1.12. Industry Databases
- 2.4.1.13. Roots Proprietary Databases
- 2.4.1.14. Paid Databases and Sources
- 2.4.1.15. Social Media Portals
- 2.4.1.16. Other Secondary Sources
- 2.4.2. Primary Research
- 2.4.2.1. Introduction
- 2.4.2.2. Types
- 2.4.2.2.1. Qualitative
- 2.4.2.2.2. Quantitative
- 2.4.2.3. Advantages
- 2.4.2.4. Techniques
- 2.4.2.4.1. Interviews
- 2.4.2.4.2. Surveys
- 2.4.2.4.3. Focus Groups
- 2.4.2.4.4. Observational Research
- 2.4.2.4.5. Social Media Interactions
- 2.4.2.5. Stakeholders
- 2.4.2.5.1. Company Executives (CXOs)
- 2.4.2.5.2. Board of Directors
- 2.4.2.5.3. Company Presidents and Vice Presidents
- 2.4.2.5.4. Key Opinion Leaders
- 2.4.2.5.5. Research and Development Heads
- 2.4.2.5.6. Technical Experts
- 2.4.2.5.7. Subject Matter Experts
- 2.4.2.5.8. Scientists
- 2.4.2.5.9. Doctors and Other Healthcare Providers
- 2.4.2.6. Ethics and Integrity
- 2.4.2.6.1. Research Ethics
- 2.4.2.6.2. Data Integrity
- 2.4.3. Analytical Tools and Databases
- 2.4.1. Secondary Research
3. MARKET DYNAMICS
- 3.1. Forecast Methodology
- 3.1.1. Top-Down Approach
- 3.1.2. Bottom-Up Approach
- 3.1.3. Hybrid Approach
- 3.2. Market Assessment Framework
- 3.2.1. Total Addressable Market (TAM)
- 3.2.2. Serviceable Addressable Market (SAM)
- 3.2.3. Serviceable Obtainable Market (SOM)
- 3.2.4. Currently Acquired Market (CAM)
- 3.3. Forecasting Tools and Techniques
- 3.3.1. Qualitative Forecasting
- 3.3.2. Correlation
- 3.3.3. Regression
- 3.3.4. Time Series Analysis
- 3.3.5. Extrapolation
- 3.3.6. Convergence
- 3.3.7. Forecast Error Analysis
- 3.3.8. Data Visualization
- 3.3.9. Scenario Planning
- 3.3.10. Sensitivity Analysis
- 3.4. Key Considerations
- 3.4.1. Demographics
- 3.4.2. Market Access
- 3.4.3. Reimbursement Scenarios
- 3.4.4. Industry Consolidation
- 3.5. Robust Quality Control
- 3.6. Key Market Segmentations
- 3.7. Limitations
4. MACRO-ECONOMIC INDICATORS
- 4.1. Chapter Overview
- 4.2. Market Dynamics
- 4.2.1. Time Period
- 4.2.1.1. Historical Trends
- 4.2.1.2. Current and Forecasted Estimates
- 4.2.2. Currency Coverage
- 4.2.2.1. Overview of Major Currencies Affecting the Market
- 4.2.2.2. Impact of Currency Fluctuations on the Industry
- 4.2.3. Foreign Exchange Impact
- 4.2.3.1. Evaluation of Foreign Exchange Rates and Their Impact on Market
- 4.2.3.2. Strategies for Mitigating Foreign Exchange Risk
- 4.2.4. Recession
- 4.2.4.1. Historical Analysis of Past Recessions and Lessons Learnt
- 4.2.4.2. Assessment of Current Economic Conditions and Potential Impact on the Market
- 4.2.5. Inflation
- 4.2.5.1. Measurement and Analysis of Inflationary Pressures in the Economy
- 4.2.5.2. Potential Impact of Inflation on the Market Evolution
- 4.2.6. Interest Rates
- 4.2.6.1. Overview of Interest Rates and Their Impact on the Market
- 4.2.6.2. Strategies for Managing Interest Rate Risk
- 4.2.7. Commodity Flow Analysis
- 4.2.7.1. Type of Commodity
- 4.2.7.2. Origins and Destinations
- 4.2.7.3. Values and Weights
- 4.2.7.4. Modes of Transportation
- 4.2.8. Global Trade Dynamics
- 4.2.8.1. Import Scenario
- 4.2.8.2. Export Scenario
- 4.2.9. War Impact Analysis
- 4.2.9.1. Russian-Ukraine War
- 4.2.9.2. Israel-Hamas War
- 4.2.10. COVID Impact / Related Factors
- 4.2.10.1. Global Economic Impact
- 4.2.10.2. Industry-specific Impact
- 4.2.10.3. Government Response and Stimulus Measures
- 4.2.10.4. Future Outlook and Adaptation Strategies
- 4.2.11. Other Indicators
- 4.2.11.1. Fiscal Policy
- 4.2.11.2. Consumer Spending
- 4.2.11.3. Gross Domestic Product (GDP)
- 4.2.11.4. Employment
- 4.2.11.5. Taxes
- 4.2.11.6. R&D Innovation
- 4.2.11.7. Stock Market Performance
- 4.2.11.8. Supply Chain
- 4.2.11.9. Cross-Border Dynamics
- 4.2.1. Time Period
SECTION II: QUALITATIVE INSIGHTS
5. EXECUTIVE SUMMARY
6. INTRODUCTION
- 6.1. Chapter Overview
- 6.2. Overview of Causal AI Market
- 6.2.1. Type of Offering
- 6.2.2. Types of Deployment Mode
- 6.2.3. Type of Services
- 6.2.4. Type of Analytics
- 6.2.5. Type of Technology
- 6.2.6. Type of Component
- 6.2.7. Areas of Application
- 6.2.8. Type of Functionality
- 6.2.9. Type of Industry Vertical
- 6.3. Future Perspective
7. REGULATORY SCENARIO
SECTION III: MARKET OVERVIEW
8. COMPREHENSIVE DATABASE OF LEADING PLAYERS
9. COMPETITIVE LANDSCAPE
- 9.1. Chapter Overview
- 9.2. Causal AI Market: Overall Market Landscape
- 9.2.1. Analysis by Year of Establishment
- 9.2.2. Analysis by Company Size
- 9.2.3. Analysis by Location of Headquarters
- 9.2.4. Analysis by Ownership Structure
10. WHITE SPACE ANALYSIS
11. COMPANY COMPETITIVENESS ANALYSIS
12. STARTUP ECOSYSTEM IN THE CAUSAL AI MARKET
- 12.1. Causal AI Market: Market Landscape of Startups
- 12.1.1. Analysis by Year of Establishment
- 12.1.2. Analysis by Company Size
- 12.1.3. Analysis by Company Size and Year of Establishment
- 12.1.4. Analysis by Location of Headquarters
- 12.1.5. Analysis by Company Size and Location of Headquarters
- 12.1.6. Analysis by Ownership Structure
- 12.2. Key Findings
SECTION IV: COMPANY PROFILES
13. COMPANY PROFILES
- 13.1. Chapter Overview
- 13.2. Aible*
- 13.2.1. Company Overview
- 13.2.2. Company Mission
- 13.2.3. Company Footprint
- 13.2.4. Management Team
- 13.2.5. Contact Details
- 13.2.6. Financial Performance
- 13.2.7. Operating Business Segments
- 13.2.8. Service / Product Portfolio (project specific)
- 13.2.9. MOAT Analysis
- 13.2.10. Recent Developments and Future Outlook
- 13.3. Aitia
- 13.4. Actable AI
- 13.5. Alibaba
- 13.6. Amazon Web Services
- 13.7. Amelia.ai
- 13.8. Beyond Limits
- 13.9. Biotx.ai
- 13.10. Blue Prism
- 13.11. Causa
- 13.12. Causality Link
- 13.13. Cognizant
- 13.14. Data Poem
- 13.15. DataRobot
- 13.16. Dataiku
- 13.17. IBM
- 13.18. Microsoft
- 13.19. NVIDIA
- 13.20. OpenAI
SECTION V: MARKET TRENDS
14. MEGA TRENDS ANALYSIS
15. UNMET NEED ANALYSIS
16. PATENT ANALYSIS
17. RECENT DEVELOPMENTS
- 17.1. Chapter Overview
- 17.2. Recent Funding
- 17.3. Recent Partnerships
- 17.4. Other Recent Initiatives
SECTION VI: MARKET OPPORTUNITY ANALYSIS
18. GLOBAL CAUSAL AI MARKET
- 18.1. Chapter Overview
- 18.2. Key Assumptions and Methodology
- 18.3. Trends Disruption Impacting Market
- 18.4. Demand Side Trends
- 18.5. Supply Side Trends
- 18.6. Global Causal AI Market, Historical Trends (Since 2020) and Forecasted Estimates (Till 2035)
- 18.7. Multivariate Scenario Analysis
- 18.7.1. Conservative Scenario
- 18.7.2. Optimistic Scenario
- 18.8. Investment Feasibility Index
- 18.9. Key Market Segmentations
19. MARKET OPPORTUNITIES BASED ON TYPE OF OFFERING
- 19.1. Chapter Overview
- 19.2. Key Assumptions and Methodology
- 19.3. Revenue Shift Analysis
- 19.4. Market Movement Analysis
- 19.5. Penetration-Growth (P-G) Matrix
- 19.6. Causal AI Market for Services: Historical Trends (Since 2020) and Forecasted Estimates (Till 2035)
- 19.7. Causal AI Market for Software: Historical Trends (Since 2020) and Forecasted Estimates (Till 2035)
- 19.8. Data Triangulation and Validation
- 19.8.1. Secondary Sources
- 19.8.2. Primary Sources
- 19.8.3. Statistical Modeling
20. MARKET OPPORTUNITIES BASED ON TYPE OF DEPLOYMENT MODE
- 20.1. Chapter Overview
- 20.2. Key Assumptions and Methodology
- 20.3. Revenue Shift Analysis
- 20.4. Market Movement Analysis
- 20.5. Penetration-Growth (P-G) Matrix
- 20.6. Causal AI Market for Cloud: Historical Trends (Since 2020) and Forecasted Estimates (Till 2035)
- 20.7. Causal AI Market for Hybrid: Historical Trends (Since 2020) and Forecasted Estimates (Till 2035)
- 20.8. Causal AI Market for On-Premises: Historical Trends (Since 2020) and Forecasted Estimates (Till 2035)
- 20.9. Data Triangulation and Validation
- 20.9.1. Secondary Sources
- 20.9.2. Primary Sources
- 20.9.3. Statistical Modeling
21. MARKET OPPORTUNITIES BASED ON TYPE OF SERVICES
- 21.1. Chapter Overview
- 21.2. Key Assumptions and Methodology
- 21.3. Revenue Shift Analysis
- 21.4. Market Movement Analysis
- 21.5. Penetration-Growth (P-G) Matrix
- 21.6. Causal AI Market for Consulting: Historical Trends (Since 2020) and Forecasted Estimates (Till 2035)
- 21.7. Causal AI Market for Deployment & Integration: Historical Trends (Since 2020) and Forecasted Estimates (Till 2035)
- 21.8. Causal AI Market for Support and Maintenance: Historical Trends (Since 2020) and Forecasted Estimates (Till 2035)
- 21.9. Causal AI Market for Training: Historical Trends (Since 2020) and Forecasted Estimates (Till 2035)
- 21.10. Data Triangulation and Validation
- 21.10.1. Secondary Sources
- 21.10.2. Primary Sources
- 21.10.3. Statistical Modeling
22. MARKET OPPORTUNITIES BASED ON TYPE OF ANALYTICS
- 22.1. Chapter Overview
- 22.2. Key Assumptions and Methodology
- 22.3. Revenue Shift Analysis
- 22.4. Market Movement Analysis
- 22.5. Penetration-Growth (P-G) Matrix
- 22.6. Causal AI Market for Descriptive Analytics: Historical Trends (Since 2020) and Forecasted Estimates (Till 2035)
- 22.7. Causal AI Market for Predictive Analytics: Historical Trends (Since 2020) and Forecasted Estimates (Till 2035)
- 22.8. Causal AI Market for Prescriptive Analytics: Historical Trends (Since 2020) and Forecasted Estimates (Till 2035)
- 22.9. Data Triangulation and Validation
- 22.9.1. Secondary Sources
- 22.9.2. Primary Sources
- 22.9.3. Statistical Modeling
23. MARKET OPPORTUNITIES BASED ON TYPE OF TECHNOLOGY
- 23.1. Chapter Overview
- 23.2. Key Assumptions and Methodology
- 23.3. Revenue Shift Analysis
- 23.4. Market Movement Analysis
- 23.5. Penetration-Growth (P-G) Matrix
- 23.6. Causal AI Market for Computer Vision: Historical Trends (Since 2020) and Forecasted Estimates (Till 2035)
- 23.7. Causal AI Market for Deep Learning: Historical Trends (Since 2020) and Forecasted Estimates (Till 2035)
- 23.8. Causal AI Market for Machine Learning: Historical Trends (Since 2020) and Forecasted Estimates (Till 2035)
- 23.9. Causal AI Market for Natural Language Processing: Historical Trends (Since 2020) and Forecasted Estimates (Till 2035)
- 23.10. Data Triangulation and Validation
- 23.10.1. Secondary Sources
- 23.10.2. Primary Sources
- 23.10.3. Statistical Modeling
24. MARKET OPPORTUNITIES BASED ON TYPE OF COMPONENT
- 24.1. Chapter Overview
- 24.2. Key Assumptions and Methodology
- 24.3. Revenue Shift Analysis
- 24.4. Market Movement Analysis
- 24.5. Penetration-Growth (P-G) Matrix
- 24.6. Causal AI Market for Algorithms: Historical Trends (Since 2020) and Forecasted Estimates (Till 2035)
- 24.7. Causal AI Market for Frameworks: Historical Trends (Since 2020) and Forecasted Estimates (Till 2035)
- 24.8. Causal AI Market for Libraries: Historical Trends (Since 2020) and Forecasted Estimates (Till 2035)
- 24.9. Data Triangulation and Validation
- 24.9.1. Secondary Sources
- 24.9.2. Primary Sources
- 24.9.3. Statistical Modeling
25. MARKET OPPORTUNITIES BASED ON AREAS OF APPLICATION
- 25.1. Chapter Overview
- 25.2. Key Assumptions and Methodology
- 25.3. Revenue Shift Analysis
- 25.4. Market Movement Analysis
- 25.5. Penetration-Growth (P-G) Matrix
- 25.6. Causal AI Market for Customer Experience Management: Historical Trends (Since 2020) and Forecasted Estimates (Till 2035)
- 25.7. Causal AI Market for Fraud Detection: Historical Trends (Since 2020) and Forecasted Estimates (Till 2035)
- 25.8. Causal AI Market for Healthcare Diagnostics: Historical Trends (Since 2020) and Forecasted Estimates (Till 2035)
- 25.9. Causal AI Market for Marketing Optimization: Historical Trends (Since 2020) and Forecasted Estimates (Till 2035)
- 25.10. Causal AI Market for Predictive Maintenance: Historical Trends (Since 2020) and Forecasted Estimates (Till 2035)
- 25.11. Causal AI Market for Risk Management: Historical Trends (Since 2020) and Forecasted Estimates (Till 2035)
- 25.12. Causal AI Market for Supply Chain Optimization: Historical Trends (Since 2020) and Forecasted Estimates (Till 2035)
- 25.13. Data Triangulation and Validation
- 25.13.1. Secondary Sources
- 25.13.2. Primary Sources
- 25.13.3. Statistical Modeling
26. MARKET OPPORTUNITIES BASED ON TYPE OF FUNCTIONALITY
- 26.1. Chapter Overview
- 26.2. Key Assumptions and Methodology
- 26.3. Revenue Shift Analysis
- 26.4. Market Movement Analysis
- 26.5. Penetration-Growth (P-G) Matrix
- 26.6. Causal AI Market for Causal Discovery: Historical Trends (Since 2020) and Forecasted Estimates (Till 2035)
- 26.7. Causal AI Market for Causal Inference: Historical Trends (Since 2020) and Forecasted Estimates (Till 2035)
- 26.8. Causal AI Market for Counterfactual Analysis: Historical Trends (Since 2020) and Forecasted Estimates (Till 2035)
- 26.9. Data Triangulation and Validation
- 26.9.1. Secondary Sources
- 26.9.2. Primary Sources
- 26.9.3. Statistical Modeling
27. MARKET OPPORTUNITIES BASED ON TYPE OF INDUSTRY VERTICAL
- 27.1. Chapter Overview
- 27.2. Key Assumptions and Methodology
- 27.3. Revenue Shift Analysis
- 27.4. Market Movement Analysis
- 27.5. Penetration-Growth (P-G) Matrix
- 27.6. Causal AI Market for BFSI: Historical Trends (Since 2020) and Forecasted Estimates (Till 2035)
- 27.7. Causal AI Market for Financial Services: Historical Trends (Since 2020) and Forecasted Estimates (Till 2035)
- 27.8. Causal AI Market for Healthcare: Historical Trends (Since 2020) and Forecasted Estimates (Till 2035)
- 27.9. Causal AI Market for Manufacturing: Historical Trends (Since 2020) and Forecasted Estimates (Till 2035)
- 27.10. Causal AI Market for Retail: Historical Trends (Since 2020) and Forecasted Estimates (Till 2035)
- 27.11. Causal AI Market for Transportation & Logistics: Historical Trends (Since 2020) and Forecasted Estimates (Till 2035)
- 27.12. Data Triangulation and Validation
- 27.12.1. Secondary Sources
- 27.12.2. Primary Sources
- 27.12.3. Statistical Modeling
28. MARKET OPPORTUNITIES FOR CAUSAL AI IN NORTH AMERICA
- 28.1. Chapter Overview
- 28.2. Key Assumptions and Methodology
- 28.3. Revenue Shift Analysis
- 28.4. Market Movement Analysis
- 28.5. Penetration-Growth (P-G) Matrix
- 28.6. Causal AI Market in North America: Historical Trends (Since 2020) and Forecasted Estimates (Till 2035)
- 28.6.1. Causal AI Market in the US: Historical Trends (Since 2020) and Forecasted Estimates (Till 2035)
- 28.6.2. Causal AI Market in Canada: Historical Trends (Since 2020) and Forecasted Estimates (Till 2035)
- 28.6.3. Causal AI Market in Mexico: Historical Trends (Since 2020) and Forecasted Estimates (Till 2035)
- 28.6.4. Causal AI Market in Other North American Countries: Historical Trends (Since 2020) and Forecasted Estimates (Till 2035)
- 28.7. Data Triangulation and Validation
29. MARKET OPPORTUNITIES FOR CAUSAL AI IN EUROPE
- 29.1. Chapter Overview
- 29.2. Key Assumptions and Methodology
- 29.3. Revenue Shift Analysis
- 29.4. Market Movement Analysis
- 29.5. Penetration-Growth (P-G) Matrix
- 29.6. Causal AI Market in Europe: Historical Trends (Since 2020) and Forecasted Estimates (Till 2035)
- 29.6.1. Causal AI Market in Austria: Historical Trends (Since 2020) and Forecasted Estimates (Till 2035)
- 29.6.2. Causal AI Market in Belgium: Historical Trends (Since 2020) and Forecasted Estimates (Till 2035)
- 29.6.3. Causal AI Market in Denmark: Historical Trends (Since 2020) and Forecasted Estimates (Till 2035)
- 29.6.4. Causal AI Market in France: Historical Trends (Since 2020) and Forecasted Estimates (Till 2035)
- 29.6.5. Causal AI Market in Germany: Historical Trends (Since 2020) and Forecasted Estimates (Till 2035)
- 29.6.6. Causal AI Market in Ireland: Historical Trends (Since 2020) and Forecasted Estimates (Till 2035)
- 29.6.7. Causal AI Market in Italy: Historical Trends (Since 2020) and Forecasted Estimates (Till 2035)
- 29.6.8. Causal AI Market in Netherlands: Historical Trends (Since 2020) and Forecasted Estimates (Till 2035)
- 29.6.9. Causal AI Market in Norway: Historical Trends (Since 2020) and Forecasted Estimates (Till 2035)
- 29.6.10. Causal AI Market in Russia: Historical Trends (Since 2020) and Forecasted Estimates (Till 2035)
- 29.6.11. Causal AI Market in Spain: Historical Trends (Since 2020) and Forecasted Estimates (Till 2035)
- 29.6.12. Causal AI Market in Sweden: Historical Trends (Since 2020) and Forecasted Estimates (Till 2035)
- 29.6.13. Causal AI Market in Sweden: Historical Trends (Since 2020) and Forecasted Estimates (Till 2035)
- 29.6.14. Causal AI Market in Switzerland: Historical Trends (Since 2020) and Forecasted Estimates (Till 2035)
- 29.6.15. Causal AI Market in the UK: Historical Trends (Since 2020) and Forecasted Estimates (Till 2035)
- 29.6.16. Causal AI Market in Other European Countries: Historical Trends (Since 2020) and Forecasted Estimates (Till 2035)
- 29.7. Data Triangulation and Validation
30. MARKET OPPORTUNITIES FOR CAUSAL AI IN ASIA
- 30.1. Chapter Overview
- 30.2. Key Assumptions and Methodology
- 30.3. Revenue Shift Analysis
- 30.4. Market Movement Analysis
- 30.5. Penetration-Growth (P-G) Matrix
- 30.6. Causal AI Market in Asia: Historical Trends (Since 2020) and Forecasted Estimates (Till 2035)
- 30.6.1. Causal AI Market in China: Historical Trends (Since 2020) and Forecasted Estimates (Till 2035)
- 30.6.2. Causal AI Market in India: Historical Trends (Since 2020) and Forecasted Estimates (Till 2035)
- 30.6.3. Causal AI Market in Japan: Historical Trends (Since 2020) and Forecasted Estimates (Till 2035)
- 30.6.4. Causal AI Market in Singapore: Historical Trends (Since 2020) and Forecasted Estimates (Till 2035)
- 30.6.5. Causal AI Market in South Korea: Historical Trends (Since 2020) and Forecasted Estimates (Till 2035)
- 30.6.6. Causal AI Market in Other Asian Countries: Historical Trends (Since 2020) and Forecasted Estimates (Till 2035)
- 30.7. Data Triangulation and Validation
31. MARKET OPPORTUNITIES FOR CAUSAL AI IN MIDDLE EAST AND NORTH AFRICA (MENA)
- 31.1. Chapter Overview
- 31.2. Key Assumptions and Methodology
- 31.3. Revenue Shift Analysis
- 31.4. Market Movement Analysis
- 31.5. Penetration-Growth (P-G) Matrix
- 31.6. Causal AI Market in Middle East and North Africa (MENA): Historical Trends (Since 2020) and Forecasted Estimates (Till 2035)
- 31.6.1. Causal AI Market in Egypt: Historical Trends (Since 2020) and Forecasted Estimates (Till 205)
- 31.6.2. Causal AI Market in Iran: Historical Trends (Since 2020) and Forecasted Estimates (Till 2035)
- 31.6.3. Causal AI Market in Iraq: Historical Trends (Since 2020) and Forecasted Estimates (Till 2035)
- 31.6.4. Causal AI Market in Israel: Historical Trends (Since 2020) and Forecasted Estimates (Till 2035)
- 31.6.5. Causal AI Market in Kuwait: Historical Trends (Since 2020) and Forecasted Estimates (Till 2035)
- 31.6.6. Causal AI Market in Saudi Arabia: Historical Trends (Since 2020) and Forecasted Estimates (Till 2035)
- 31.6.7. Causal AI Market in United Arab Emirates (UAE): Historical Trends (Since 2020) and Forecasted Estimates (Till 2035)
- 31.6.8. Causal AI Market in Other MENA Countries: Historical Trends (Since 2020) and Forecasted Estimates (Till 2035)
- 31.7. Data Triangulation and Validation
32. MARKET OPPORTUNITIES FOR CAUSAL AI IN LATIN AMERICA
- 32.1. Chapter Overview
- 32.2. Key Assumptions and Methodology
- 32.3. Revenue Shift Analysis
- 32.4. Market Movement Analysis
- 32.5. Penetration-Growth (P-G) Matrix
- 32.6. Causal AI Market in Latin America: Historical Trends (Since 2020) and Forecasted Estimates (Till 2035)
- 32.6.1. Causal AI Market in Argentina: Historical Trends (Since 2020) and Forecasted Estimates (Till 2035)
- 32.6.2. Causal AI Market in Brazil: Historical Trends (Since 2020) and Forecasted Estimates (Till 2035)
- 32.6.3. Causal AI Market in Chile: Historical Trends (Since 2020) and Forecasted Estimates (Till 2035)
- 32.6.4. Causal AI Market in Colombia Historical Trends (Since 2020) and Forecasted Estimates (Till 2035)
- 32.6.5. Causal AI Market in Venezuela: Historical Trends (Since 2020) and Forecasted Estimates (Till 2035)
- 32.6.6. Causal AI Market in Other Latin American Countries: Historical Trends (Since 2020) and Forecasted Estimates (Till 2035)
- 32.7. Data Triangulation and Validation
33. MARKET OPPORTUNITIES FOR CAUSAL AI IN REST OF THE WORLD
- 33.1. Chapter Overview
- 33.2. Key Assumptions and Methodology
- 33.3. Revenue Shift Analysis
- 33.4. Market Movement Analysis
- 33.5. Penetration-Growth (P-G) Matrix
- 33.6. Causal AI Market in Rest of the World: Historical Trends (Since 2020) and Forecasted Estimates (Till 2035)
- 33.6.1. Causal AI Market in Australia: Historical Trends (Since 2020) and Forecasted Estimates (Till 2035)
- 33.6.2. Causal AI Market in New Zealand: Historical Trends (Since 2020) and Forecasted Estimates (Till 2035)
- 33.6.3. Causal AI Market in Other Countries
- 33.7. Data Triangulation and Validation
34. MARKET CONCENTRATION ANALYSIS: DISTRIBUTION BY LEADING PLAYERS
- 34.1. Leading Player 1
- 34.2. Leading Player 2
- 34.3. Leading Player 3
- 34.4. Leading Player 4
- 34.5. Leading Player 5
- 34.6. Leading Player 6
- 34.7. Leading Player 7
- 34.8. Leading Player 8
35. ADJACENT MARKET ANALYSIS
SECTION VII: STRATEGIC TOOLS
36. KEY WINNING STRATEGIES
37. PORTER'S FIVE FORCES ANALYSIS
38. SWOT ANALYSIS
39. VALUE CHAIN ANALYSIS
40. ROOTS STRATEGIC RECOMMENDATIONS
- 40.1. Chapter Overview
- 40.2. Key Business-related Strategies
- 40.2.1. Research & Development
- 40.2.2. Product Manufacturing
- 40.2.3. Commercialization / Go-to-Market
- 40.2.4. Sales and Marketing
- 40.3. Key Operations-related Strategies
- 40.3.1. Risk Management
- 40.3.2. Workforce
- 40.3.3. Finance
- 40.3.4. Others
SECTION VIII: OTHER EXCLUSIVE INSIGHTS
41. INSIGHTS FROM PRIMARY RESEARCH
42. REPORT CONCLUSION
SECTION IX: APPENDIX
43. TABULATED DATA
44. LIST OF COMPANIES AND ORGANIZATIONS
45. CUSTOMIZATION OPPORTUNITIES
46. ROOTS SUBSCRIPTION SERVICES
47. AUTHOR DETAILS
- 発行日
- 発行
- Roots Analysis
- ページ情報
- 英文 203 Pages
- 納期
- 7~10営業日