|
|
市場調査レポート
商品コード
1351148
家電製品の世界市場:2023年Global Home Appliance Market Research Report 2023 |
||||||
|
|
|||||||
カスタマイズ可能
適宜更新あり
|
|||||||


| 家電製品の世界市場:2023年 |
|
出版日: 2023年09月25日
発行: QYResearch
ページ情報: 英文 110 Pages
納期: 2~3営業日
|

- 全表示
- 概要
- 図表
- 目次
世界の家電製品の市場規模は2022年に2,061億7,000万米ドルとなりました。
同市場は、予測期間の2023年~2029年に3.94%のCAGRで拡大し、2029年には2,711億1,000万米ドルに達すると予測されています。
当レポートでは、世界の家電製品市場について調査し、市場の概要とともに、企業別、タイプ別、販売チャネル別、地域別の動向、および市場に参入する企業のプロファイルなどを提供しています。
目次
第1章 家電製品市場概要
- 製品の定義
- 家電製品、タイプ別
- 家電製品の販売チャネル別
- 世界の家電製品市場規模予測
- 前提と制限
第2章 メーカーによる家電製品市場競争
第3章 世界の家電製品市場シナリオ、地域別
- 世界家電製品市場規模:2018年対2022年対2029年、地域別
- 世界の家電売上高:2018年~2029年、地域別
- 世界の家電売上高:2018年~2029年、地域別
- 北米の家電製品市場の国別の事実と数字
- 欧州の家電製品市場の国別の事実と数字
- アジア太平洋の家電製品市場の地域別の事実と数字
- ラテンアメリカの家電製品市場の国別の事実と数字
- 中東・アフリカの家電製品市場の国別の事実と数字
第4章 タイプ別セグメント
- 世界の家電製品売上(2018年~2029年)、タイプ別
- 世界の家電製品収益(2018年~2029年)、タイプ別
- 世界の家電製品価格(2018~2029年)、タイプ別
第5章 販売チャネル別セグメント
- 世界の家電製品売上(2018年~2029年)、販売チャネル別
- 世界の家電製品収益(2018年~2029年)、販売チャネル別
- 世界の家電製品価格(2018~2029年)、販売チャネル別
第6章 主要企業のプロファイル
- Haier
- Gree
- Midea
- Whirlpool
- Electrolux
- Samsung
- Panasonic
- LG Electronics
- Bosch
- Hisense
- TCL
- Arcelik
- Meiling
- Skyworth
第7章 家電製品の製造コスト分析
第8章 マーケティングチャネル、販売代理店および顧客
第9章 家電製品市場力学
- 家電業界の動向
- 家電製品市場の促進要因
- 家電製品市場の課題と抑制要因
第10章 調査結果と結論
第11章 調査手法とデータソース
List of Tables
- Table 1. Global Home Appliance Market Value Comparison by Type (2023-2029) & (US$ Million)
- Table 2. Global Home Appliance Market Value by Sales Channel (2023-2029) & (US$ Million)
- Table 3. Global Home Appliance Market Competitive Situation by Manufacturers in 2022
- Table 4. Global Home Appliance Sales (K Units) of Key Manufacturers (2019-2023)
- Table 5. Global Home Appliance Sales Market Share by Manufacturers (2019-2023)
- Table 6. Global Home Appliance Revenue (US$ Million) by Manufacturers (2019-2023)
- Table 7. Global Home Appliance Revenue Share by Manufacturers (2019-2023)
- Table 8. Global Market Home Appliance Average Price (US$/Unit) of Key Manufacturers (2019-2023)
- Table 9. Global Key Players of Home Appliance, Industry Ranking in 2022
- Table 10. Global Key Manufacturers of Home Appliance, Manufacturing Sites & Headquarters
- Table 11. Global Manufacturers Market Concentration Ratio (CR5)
- Table 12. Global Home Appliance by Company Type (Tier 1, Tier 2, and Tier 3) & (based on the Revenue in Home Appliance as of 2022)
- Table 13. Manufacturers Mergers & Acquisitions, Expansion Plans
- Table 14. Global Home Appliance Market Size by Region (US$ Million): 2018 VS 2022 VS 2029
- Table 15. Global Home Appliance Sales by Region (2018-2023) & (K Units)
- Table 16. Global Home Appliance Sales Market Share by Region (2018-2023)
- Table 17. Global Home Appliance Sales by Region (2024-2029) & (K Units)
- Table 18. Global Home Appliance Sales Market Share by Region (2024-2029)
- Table 19. Global Home Appliance Revenue by Region (2018-2023) & (US$ Million)
- Table 20. Global Home Appliance Revenue Market Share by Region (2018-2023)
- Table 21. Global Home Appliance Revenue by Region (2024-2029) & (US$ Million)
- Table 22. Global Home Appliance Revenue Market Share by Region (2024-2029)
- Table 23. North America Home Appliance Sales by Country (2018-2023) & (K Units)
- Table 24. North America Home Appliance Sales by Country (2024-2029) & (K Units)
- Table 25. North America Home Appliance Revenue by Country (2018-2023) & (US$ Million)
- Table 26. North America Home Appliance Revenue by Country (2024-2029) & (US$ Million)
- Table 27. Europe Home Appliance Sales by Country (2018-2023) & (K Units)
- Table 28. Europe Home Appliance Sales by Country (2024-2029) & (K Units)
- Table 29. Europe Home Appliance Revenue by Country (2018-2023) & (US$ Million)
- Table 30. Europe Home Appliance Revenue by Country (2024-2029) & (US$ Million)
- Table 31. Asia Pacific Home Appliance Sales by Region (2018-2023) & (K Units)
- Table 32. Asia Pacific Home Appliance Sales by Region (2024-2029) & (K Units)
- Table 33. Asia Pacific Home Appliance Revenue by Region (2018-2023) & (US$ Million)
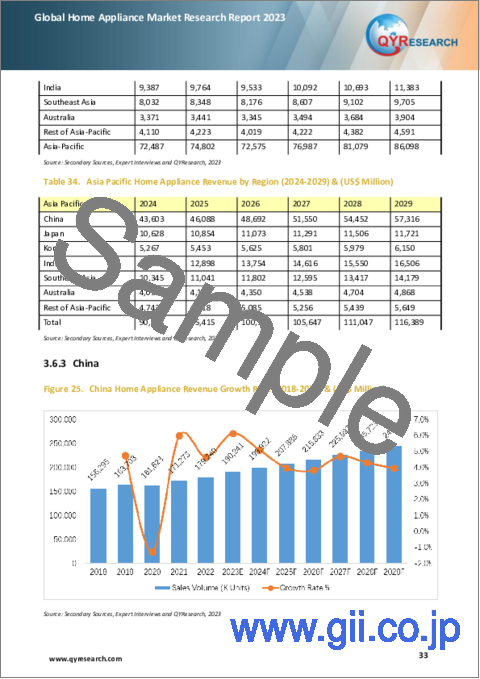
- Table 34. Asia Pacific Home Appliance Revenue by Region (2024-2029) & (US$ Million)
- Table 35. Latin America Home Appliance Sales by Country (2018-2023) & (K Units)
- Table 36. Latin America Home Appliance Sales by Country (2024-2029) & (K Units)
- Table 37. Latin America Home Appliance Revenue by Country (2018-2023) & (US$ Million)
- Table 38. Latin America Home Appliance Revenue Market Share by Country (2018-2023)
- Table 39. Middle East and Africa Home Appliance Sales by Country (2018-2023) & (K Units)
- Table 40. Middle East and Africa Home Appliance Sales by Country (2024-2029) & (K Units)
- Table 41. Middle East and Africa Home Appliance Revenue by Country (2018-2023) & (US$ Million)
- Table 42. Middle East and Africa Home Appliance Revenue by Country (2024-2029) & (US$ Million)
- Table 43. Global Home Appliance Sales (K Units) by Type (2018-2023)
- Table 44. Global Home Appliance Sales (K Units) by Type (2024-2029)
- Table 45. Global Home Appliance Sales Market Share by Type (2018-2023)
- Table 46. Global Home Appliance Sales Market Share by Type (2024-2029)
- Table 47. Global Home Appliance Revenue (US$ Million) by Type (2018-2023)
- Table 48. Global Home Appliance Revenue (US$ Million) by Type (2024-2029)
- Table 49. Global Home Appliance Revenue Market Share by Type (2018-2023)
- Table 50. Global Home Appliance Revenue Market Share by Type (2024-2029)
- Table 51. Global Home Appliance Price (US$/Unit) by Type (2018-2023)
- Table 52. Global Home Appliance Price (US$/Unit) by Type (2024-2029)
- Table 53. Global Home Appliance Sales (K Units) by Sales Channel (2018-2023)
- Table 54. Global Home Appliance Sales (K Units) by Sales Channel (2024-2029)
- Table 55. Global Home Appliance Sales Market Share by Sales Channel (2018-2023)
- Table 56. Global Home Appliance Sales Market Share by Sales Channel (2024-2029)
- Table 57. Global Home Appliance Revenue (US$ Million) by Sales Channel (2018-2023)
- Table 58. Global Home Appliance Revenue (US$ Million) by Sales Channel (2024-2029)
- Table 59. Global Home Appliance Revenue Market Share by Sales Channel (2018-2023)
- Table 60. Global Home Appliance Revenue Market Share by Sales Channel (2024-2029)
- Table 61. Global Home Appliance Price (US$/Unit) by Sales Channel (2018-2023)
- Table 62. Global Home Appliance Price (US$/Unit) by Sales Channel (2024-2029)
- Table 63. Haier Basic Information
- Table 64. Haier Home Appliance Product and Services
- Table 65. Haier Home Appliance Sales (K Units), Price (USD/Unit), Revenue (USD Million), Gross Margin and Market Share (2019-2023)
- Table 66. Gree Basic Information, Manufacturing Base and Competitors
- Table 67. Gree Home Appliance Product and Services
- Table 68. Gree Home Appliance Sales (K Units), Price (USD/Unit), Revenue (USD Million), Gross Margin and Market Share (2019-2023)
- Table 69. Midea Basic Information
- Table 70. Midea Home Appliance Product and Services
- Table 71. Midea Home Appliance Sales (K Units), Price (USD/Unit), Revenue (USD Million), Gross Margin and Market Share (2019-2023)
- Table 72. Whirlpool Basic Information
- Table 73. Whirlpool Home Appliance Product and Services
- Table 74. Whirlpool Home Appliance Sales (K Units), Price (USD/Unit), Revenue (USD Million), Gross Margin and Market Share (2019-2023)
- Table 75. Electrolux Basic Information
- Table 76. Electrolux Home Appliance Product and Services
- Table 77. Electrolux Home Appliance Sales (K Units), Price (USD/Unit), Revenue (USD Million), Gross Margin and Market Share (2019-2023)
- Table 78. Samsung Basic Information
- Table 79. Samsung Home Appliance Product and Services
- Table 80. Samsung Home Appliance Sales (K Units), Price (USD/Unit), Revenue (USD Million), Gross Margin and Market Share (2019-2023)
- Table 81. Panasonic Basic Information
- Table 82. Panasonic Home Appliance Product and Services
- Table 83. Panasonic Home Appliance Sales (K Units), Price (USD/Unit), Revenue (USD Million), Gross Margin and Market Share (2019-2023)
- Table 84. LG Electronics Basic Information
- Table 85. LG Electronics Home Appliance Product and Services
- Table 86. LG Electronics Home Appliance Sales (K Units), Price (USD/Unit), Revenue (USD Million), Gross Margin and Market Share (2019-2023)
- Table 87. Bosch Basic Information
- Table 88. Bosch Home Appliance Product and Services
- Table 89. Bosch Home Appliance Sales (K Units), Price (USD/Unit), Revenue (USD Million), Gross Margin and Market Share (2019-2023)
- Table 90. Hisense Basic Information
- Table 91. Hisense Home Appliance Product and Services
- Table 92. Hisense Home Appliance Sales (K Units), Price (USD/Unit), Revenue (USD Million), Gross Margin and Market Share (2019-2023)
- Table 93. TCL Basic Information, Manufacturing Base and Competitors
- Table 94. TCL Home Appliance Product and Services
- Table 95. TCL Home Appliance Sales (K Units), Price (USD/Unit), Revenue (USD Million), Gross Margin and Market Share (2019-2023)
- Table 96. Arcelik Basic Information, Manufacturing Base and Competitors
- Table 97. Arcelik Home Appliance Product and Services
- Table 98. Arcelik Home Appliance Sales (K Units), Price (USD/Unit), Revenue (USD Million), Gross Margin and Market Share (2019-2023)
- Table 99. Meiling Basic Information, Manufacturing Base and Competitors
- Table 100. Meiling Home Appliance Product and Services
- Table 101. Meiling Home Appliance Sales (K Units), Price (USD/Unit), Revenue (USD Million), Gross Margin and Market Share (2019-2023)
- Table 102. Skyworth Basic Information, Manufacturing Base and Competitors
- Table 103. Skyworth Home Appliance Product and Services
- Table 104. Skyworth Home Appliance Sales (K Units), Price (USD/Unit), Revenue (USD Million), Gross Margin and Market Share (2019-2023)
- Table 105. Key Suppliers of Raw Materials
- Table 106. Home Appliance Distributors List
- Table 107. Home Appliance Market Trends
- Table 108. Home Appliance Market Drivers
- Table 109. Home Appliance Market Challenges and Restraints
- Table 110. Research Programs/Design for This Report
- Table 111. Key Data Information from Secondary Sources
- Table 112. Key Data Information from Primary Sources
- Table 113. Authors List of This Report
- Table 114. QYR Business Unit and Senior & Team Lead Analysts
List of Figures
- Figure 1. Global Home Appliance Market Share by Type: 2022 & 2029
- Figure 2. Refrigerators Product Picture
- Figure 3. Freezers Product Picture
- Figure 4. Washing Machines Product Picture
- Figure 5. Air Conditioner Product Picture
- Figure 6. Kitchen Appliances Product Picture
- Figure 7. Electric Water Heater Product Picture
- Figure 8. Global Home Appliance Market Share by Sales Channel: 2022 & 2029
- Figure 9. Global Home Appliance Revenue, (US$ Million), 2018 VS 2022 VS 2029
- Figure 10. Global Home Appliance Market Size (2018-2029) & (US$ Million)
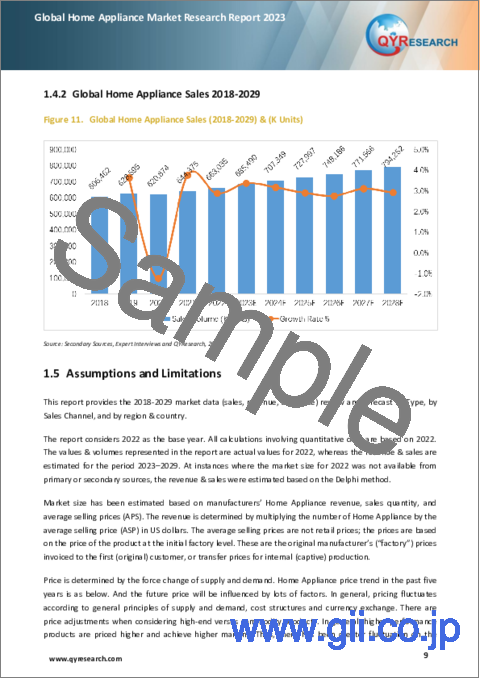
- Figure 11. Global Home Appliance Sales (2018-2029) & (K Units)
- Figure 12. Home Appliance Report Years Considered
- Figure 13. Home Appliance Sales Share by Manufacturers in 2022
- Figure 14. Global Home Appliance Revenue Share by Manufacturers in 2022
- Figure 15. Global 5 Largest Home Appliance Players: Market Share by Revenue in Home Appliance in 2022
- Figure 16. Global 10 Largest Home Appliance Players: Market Share by Revenue in Home Appliance in 2022
- Figure 17. United States Home Appliance Revenue Growth Rate (2018-2029) & (US$ Million)
- Figure 18. Canada Home Appliance Revenue Growth Rate (2018-2029) & (US$ Million)
- Figure 19. Germany Home Appliance Revenue Growth Rate (2018-2029) & (US$ Million)
- Figure 20. France Home Appliance Revenue Growth Rate (2018-2029) & (US$ Million)
- Figure 21. U.K. Home Appliance Revenue Growth Rate (2018-2029) & (US$ Million)
- Figure 22. Italy Home Appliance Revenue Growth Rate (2018-2029) & (US$ Million)
- Figure 23. Russia Home Appliance Revenue Growth Rate (2018-2029) & (US$ Million)
- Figure 24. Spain Home Appliance Revenue Growth Rate (2018-2029) & (US$ Million)
- Figure 25. China Home Appliance Revenue Growth Rate (2018-2029) & (US$ Million)
- Figure 26. Japan Home Appliance Revenue Growth Rate (2018-2029) & (US$ Million)
- Figure 27. South Korea Home Appliance Revenue Growth Rate (2018-2029) & (US$ Million)
- Figure 28. India Home Appliance Revenue Growth Rate (2018-2029) & (US$ Million)
- Figure 29. Southeast Asia Home Appliance Revenue Growth Rate (2018-2029) & (US$ Million)
- Figure 30. Australia Home Appliance Revenue Growth Rate (2018-2029) & (US$ Million)
- Figure 31. Brazil Home Appliance Revenue Growth Rate (2018-2029) & (US$ Million)
- Figure 32. Mexico Home Appliance Revenue Growth Rate (2018-2029) & (US$ Million)
- Figure 33. Middle East Home Appliance Revenue Growth Rate (2018-2029) & (US$ Million)
- Figure 34. Africa Home Appliance Revenue Growth Rate (2018-2029) & (US$ Million)
- Figure 35. Global Sales Market Share of Home Appliance by Type (2018-2029)
- Figure 36. Global Revenue Market Share of Home Appliance by Type (2018-2029)
- Figure 37. Global Sales Market Share of Home Appliance by Sales Channel (2018-2029)
- Figure 38. Global Revenue Market Share of Home Appliance by Sales Channel (2018-2029)
- Figure 39. Home Appliance Value Chain
- Figure 40. Manufacturing Cost Structure of Home Appliance
- Figure 41. Manufacturing Process Analysis of Home Appliance
- Figure 42. Channels of Distribution
- Figure 43. Distributors Profiles
- Figure 44. Bottom-up and Top-down Approaches for This Report
- Figure 45. Data Triangulation
- Figure 46. Key Executives Interviewed
The global Home Appliance market was valued at US$ 206.17 billion in 2022 and is anticipated to reach US$ 271.11 billion by 2029, witnessing a CAGR of 3.94% during the forecast period 2023-2029. The influence of COVID-19 and the Russia-Ukraine War were considered while estimating market sizes.
Report Scope
This report aims to provide a comprehensive presentation of the global market for Home Appliance, with both quantitative and qualitative analysis, to help readers develop business/growth strategies, assess the market competitive situation, analyze their position in the current marketplace, and make informed business decisions regarding Home Appliance.
The Home Appliance market size, estimations, and forecasts are provided in terms of sales volume (K Units) and revenue ($ millions), considering 2021 as the base year, with history and forecast data for the period from 2017 to 2028. This report segments the global Home Appliance market comprehensively. Regional market sizes, concerning products by Type, by Sales Channel, and by players, are also provided.
For a more in-depth understanding of the market, the report provides profiles of the competitive landscape, key competitors, and their respective market ranks. The report also discusses technological trends and new product developments.
The report will help the Home Appliance manufacturers, new entrants, and industry chain related companies in this market with information on the revenues, sales volume, and average price for the overall market and the sub-segments across the different segments, by company, by Type, by Sales Channel, and by regions.
By Company
- Haier
- Gree
- Midea
- Whirlpool
- Electrolux
- Samsung
- Panasonic
- LG
- Bosch
- Hisense
- TCL
- Arcelik
- Meling
- Skyworth
Segment by Type
- Refrigerators
- Freezers
- Washing Machines
- Air Conditioner
- Kitchen Appliances
- Others
Segment by Sales Channel
- Offline Sales
- Online Sales
Consumption by Region
- North America
- U.S.
- Canada
- Asia-Pacific
- China
- Japan
- South Korea
- Southeast Asia
- India
- Australia
- Rest of Asia-Pacific
- Europe
- Germany
- France
- U.K.
- Italy
- Russia
- Spain
- Rest of Europe
- Latin America
- Mexico
- Brazil
- Rest of Latin America
Table of Contents
1 Home Appliance Market Overview
- 1.1 Product Definition
- 1.2 Home Appliance by Type
- 1.2.1 Global Home Appliance Market Value Comparison by Type (2023-2029)
- 1.2.2 Refrigerators
- 1.2.3 Freezers
- 1.2.4 Washing Machines
- 1.2.5 Air Conditioner
- 1.2.6 Kitchen Appliances
- 1.2.7 Others (Electric Water Heater)
- 1.3 Home Appliance by Sales Channel
- 1.4 Global Home Appliance Market Size Estimates and Forecasts
- 1.4.1 Global Home Appliance Revenue 2018-2029
- 1.4.2 Global Home Appliance Sales 2018-2029
- 1.5 Assumptions and Limitations
2 Home Appliance Market Competition by Manufacturers
- 2.1 Global Home Appliance Sales Market Share by Manufacturers (2019-2023)
- 2.2 Global Home Appliance Revenue Market Share by Manufacturers (2019-2023)
- 2.3 Global Home Appliance Average Price by Manufacturers (2019-2023)
- 2.4 Global Key Players of Home Appliance, Industry Ranking in 2022
- 2.5 Global Key Manufacturers of Home Appliance Manufacturing Sites
- 2.6 Global Home Appliance Market Competitive Situation and Trends
- 2.6.1 Global Home Appliance Market Concentration Rate
- 2.6.2 The Global 5 and 10 Largest Home Appliance Players Market Share by Revenue
- 2.6.3 Global Home Appliance Market Share by Company Type (Tier 1, Tier 2, and Tier 3)
- 2.7 Manufacturers Mergers & Acquisitions, Expansion Plans
3 Global Home Appliance Market Scenario by Region
- 3.1 Global Home Appliance Market Size by Region: 2018 Versus 2022 Versus 2029
- 3.2 Global Home Appliance Sales by Region: 2018-2029
- 3.2.1 Global Home Appliance Sales by Region: 2018-2023
- 3.2.2 Global Home Appliance Sales by Region: 2024-2029
- 3.3 Global Home Appliance Revenue by Region: 2018-2029
- 3.3.1 Global Home Appliance Revenue by Region: 2018-2023
- 3.3.2 Global Home Appliance Revenue by Region: 2024-2029
- 3.4 North America Home Appliance Market Facts & Figures by Country
- 3.4.1 North America Home Appliance Sales by Country (2018-2029)
- 3.4.2 North America Home Appliance Revenue by Country (2018-2029)
- 3.4.3 United States
- 3.4.4 Canada
- 3.5 Europe Home Appliance Market Facts & Figures by Country
- 3.5.1 Europe Home Appliance Sales by Country (2018-2029)
- 3.5.2 Europe Home Appliance Revenue by Country (2018-2029)
- 3.5.3 Germany
- 3.5.4 France
- 3.5.5 U.K.
- 3.5.6 Italy
- 3.5.7 Russia
- 3.5.8 Spain
- 3.6 Asia Pacific Home Appliance Market Facts & Figures by Region
- 3.6.1 Asia Pacific Home Appliance Sales by Region (2018-2029)
- 3.6.2 Asia Pacific Home Appliance Revenue by Region (2018-2029)
- 3.6.3 China
- 3.6.4 Japan
- 3.6.5 South Korea
- 3.6.6 India
- 3.6.7 Southeast Asia
- 3.6.8 Australia
- 3.7 Latin America Home Appliance Market Facts & Figures by Country
- 3.7.1 Latin America Home Appliance Sales by Country (2018-2029)
- 3.7.2 Latin America Home Appliance Revenue by Country
- 3.7.3 Brazil
- 3.7.4 Mexico
- 3.8 Middle East and Africa Home Appliance Market Facts & Figures by Country
- 3.8.1 Middle East and Africa Home Appliance Sales by Country (2018-2029)
- 3.8.2 Middle East and Africa Home Appliance Revenue by Country
- 3.8.3 Middle East
- 3.8.4 Africa
4 Segment by Type
- 4.1 Global Home Appliance Sales by Type (2018-2029)
- 4.1.1 Global Home Appliance Sales by Type (2018-2023)
- 4.1.2 Global Home Appliance Sales by Type (2024-2029)
- 4.1.3 Global Home Appliance Sales Market Share by Type (2018-2029)
- 4.2 Global Home Appliance Revenue by Type (2018-2029)
- 4.2.1 Global Home Appliance Revenue by Type (2018-2023)
- 4.2.2 Global Home Appliance Revenue by Type (2024-2029)
- 4.2.3 Global Home Appliance Revenue Market Share by Type (2018-2029)
- 4.3 Global Home Appliance Price by Type (2018-2029)
5 Segment by Sales Channel
- 5.1 Global Home Appliance Sales by Sales Channel (2018-2029)
- 5.1.1 Global Home Appliance Sales by Sales Channel (2018-2023)
- 5.1.2 Global Home Appliance Sales by Sales Channel (2024-2029)
- 5.1.3 Global Home Appliance Sales Market Share by Sales Channel (2018-2029)
- 5.2 Global Home Appliance Revenue by Sales Channel (2018-2029)
- 5.2.1 Global Home Appliance Revenue by Sales Channel (2018-2023)
- 5.2.2 Global Home Appliance Revenue by Sales Channel (2024-2029)
- 5.2.3 Global Home Appliance Revenue Market Share by Sales Channel (2018-2029)
- 5.3 Global Home Appliance Price by Sales Channel (2018-2029)
6 Key Companies Profiled
- 6.1 Haier
- 6.1.1 Haier Details
- 6.1.2 Haier Major Business
- 6.1.3 Haier Home Appliance Product and Services
- 6.1.4 Haier Home Appliance Sales, Price, Revenue, Gross Margin and Market Share (2019-2023)
- 6.2 Gree
- 6.2.1 Gree Details
- 6.2.2 Gree Major Business
- 6.2.3 Gree Home Appliance Product and Services
- 6.2.4 Gree Home Appliance Sales, Price, Revenue, Gross Margin and Market Share (2019-2023)
- 6.3 Midea
- 6.3.1 Midea Details
- 6.3.2 Midea Major Business
- 6.3.3 Midea Home Appliance Product and Services
- 6.3.4 Midea Home Appliance Sales, Price, Revenue, Gross Margin and Market Share (2019-2023)
- 6.4 Whirlpool
- 6.4.1 Whirlpool Details
- 6.4.2 Whirlpool Major Business
- 6.4.3 Whirlpool Home Appliance Product and Services
- 6.4.4 Whirlpool Home Appliance Sales, Price, Revenue, Gross Margin and Market Share (2019-2023)
- 6.5 Electrolux
- 6.5.1 Electrolux Details
- 6.5.2 Electrolux Major Business
- 6.5.3 Electrolux Home Appliance Product and Services
- 6.5.4 Electrolux Home Appliance Sales, Price, Revenue, Gross Margin and Market Share (2019-2023)
- 6.6 Samsung
- 6.6.1 Samsung Details
- 6.6.2 Samsung Major Business
- 6.6.3 Samsung Home Appliance Product and Services
- 6.6.4 Samsung Home Appliance Sales, Price, Revenue, Gross Margin and Market Share (2019-2023)
- 6.7 Panasonic
- 6.7.1 Panasonic Details
- 6.7.2 Panasonic Major Business
- 6.7.3 Panasonic Home Appliance Product and Services
- 6.7.4 Panasonic Home Appliance Sales, Price, Revenue, Gross Margin and Market Share (2019-2023)
- 6.8 LG Electronics
- 6.8.1 LG Electronics Details
- 6.8.2 LG Electronics Major Business
- 6.8.3 LG Electronics Home Appliance Product and Services
- 6.8.4 LG Electronics Home Appliance Sales, Price, Revenue, Gross Margin and Market Share (2019-2023)
- 6.9 Bosch
- 6.9.1 Bosch Details
- 6.9.2 Bosch Major Business
- 6.9.3 Bosch Home Appliance Product and Services
- 6.9.4 Bosch Home Appliance Sales, Price, Revenue, Gross Margin and Market Share (2019-2023)
- 6.10 Hisense
- 6.10.1 Hisense Details
- 6.10.2 Hisense Major Business
- 6.10.3 Hisense Home Appliance Product and Services
- 6.10.4 Hisense Home Appliance Sales, Price, Revenue, Gross Margin and Market Share (2019-2023)
- 6.11 TCL
- 6.11.1 TCL Details
- 6.11.2 TCL Major Business
- 6.11.3 TCL Home Appliance Product and Services
- 6.11.4 TCL Home Appliance Sales, Price, Revenue, Gross Margin and Market Share (2019-2023)
- 6.12 Arcelik
- 6.12.1 Arcelik Details
- 6.12.2 Arcelik Major Business
- 6.12.3 Arcelik Home Appliance Product and Services
- 6.12.4 Arcelik Home Appliance Sales, Price, Revenue, Gross Margin and Market Share (2019-2023)
- 6.13 Meiling
- 6.13.1 Meiling Details
- 6.13.2 Meiling Major Business
- 6.13.3 Meiling Home Appliance Product and Services
- 6.13.4 Meiling Home Appliance Sales, Price, Revenue, Gross Margin and Market Share (2019-2023)
- 6.14 Skyworth
- 6.14.1 Skyworth Details
- 6.14.2 Skyworth Major Business
- 6.14.3 Skyworth Home Appliance Product and Services
- 6.14.4 Skyworth Home Appliance Sales, Price, Revenue, Gross Margin and Market Share (2019-2023)
7 Home Appliance Manufacturing Cost Analysis
- 7.1 Home Appliance Industry Chain Analysis
- 7.2 Home Appliance Key Raw Materials Analysis
- 7.3 Proportion of Manufacturing Cost Structure
- 7.4 Manufacturing Process Analysis of Home Appliance
8 Marketing Channel, Distributors and Customers
- 8.1 Marketing Channel
- 8.2 Home Appliance Distributors List
- 8.3 Home Appliance Customers
9 Home Appliance Market Dynamics
- 9.1 Home Appliance Industry Trends
- 9.2 Home Appliance Market Drivers
- 9.3 Home Appliance Market Challenges and Restraints
10 Research Findings and Conclusion
11 Methodology and Data Source
- 11.1 Methodology/Research Approach
- 11.1.1 Research Programs/Design
- 11.1.2 Market Size Estimation
- 11.1.3 Market Breakdown and Data Triangulation
- 11.2 Data Source
- 11.2.1 Secondary Sources
- 11.2.2 Primary Sources
- 11.3 Author List
- 11.4 Disclaimer
