|
|
市場調査レポート
商品コード
1340739
EVバッテリー向け熱伝導材料の世界市場(2023年)Global Thermal Interface Material for EV Battery Market Research Report 2023 |
||||||
|
|
|||||||
カスタマイズ可能
適宜更新あり
|
|||||||


| EVバッテリー向け熱伝導材料の世界市場(2023年) |
|
出版日: 2023年08月30日
発行: QYResearch
ページ情報: 英文 153 Pages
納期: 2~3営業日
|

- 全表示
- 概要
- 図表
- 目次
世界のEVバッテリー向け熱伝導材料の市場規模は、2022年の2億7,168万米ドルから2029年末までに12億9,436万米ドルに達し、2023年~2029年にCAGRで23.18%の成長が予測されています。
当レポートでは、世界のEVバッテリー向け熱伝導材料市場について調査分析し、市場規模の実績と予測、地域とセグメントの分析、企業プロファイルなどを提供しています。
目次
第1章 EVバッテリー向け熱伝導材料市場の概要
- 製品の定義
- EVバッテリー向け熱伝導材料:タイプ別
- 世界のEVバッテリー向け熱伝導材料の市場金額成長率分析:タイプ別(2022年・2029年)
- HDギャップフィラー
- HDシート
- HDグリス
- その他
- EVバッテリー向け熱伝導材料:用途別
- 世界のEVバッテリー向け熱伝導材料の市場金額成長率分析:用途別(2022年・2029年)
- 乗用車
- 商用車
- 世界市場の成長の見通し
- 世界のEVバッテリー向け熱伝導材料の生産金額の推計と予測(2018年~2029年)
- 世界のEVバッテリー向け熱伝導材料の生産の推計と予測(2018年~2029年)
- 世界のEVバッテリー向け熱伝導材料市場の平均価格の推計と予測(2018年~2029年)
- 前提条件と制限
第2章 市場競合:メーカー別
- 世界のEVバッテリー向け熱伝導材料生産の市場シェア:メーカー別(2018年~2023年)
- 世界のEVバッテリー向け熱伝導材料生産金額の市場シェア:メーカー別(2018年~2023年)
- 世界のEVバッテリー向け熱伝導材料の主要企業、業界ランキング(2021年・2022年)
- 世界のEVバッテリー向け熱伝導材料の市場シェア:企業タイプ別(Tier 1・Tier 2・Tier 3)
- 世界のEVバッテリー向け熱伝導材料の平均価格:メーカー別(2018年~2023年)
- 世界のEVバッテリー向け熱伝導材料の主要メーカー、製造拠点の分布、本社
- EVバッテリー向け熱伝導材料市場の競合状況と動向
- EVバッテリー向け熱伝導材料の市場集中度
- 世界の5大・10大EVバッテリー向け熱伝導材料企業の収益の市場シェア
- 合併と買収、拡大
第3章 EVバッテリー向け熱伝導材料生産:地域別
- 世界のEVバッテリー向け熱伝導材料生産金額の推計と予測(2018年・2022年・2029年)
- 世界のEVバッテリー向け熱伝導材料生産金額:地域別(2018年~2029年)
- 世界のEVバッテリー向け熱伝導材料生産金額の市場シェア:地域別(2018年~2023年)
- 世界のEVバッテリー向け熱伝導材料生産金額の予測:地域別(2024年~2029年)
- 世界のEVバッテリー向け熱伝導材料生産の推計と予測:地域別(2018年・2022年・2029年)
- 世界のEVバッテリー向け熱伝導材料生産:地域別(2018年~2029年)
- 世界のEVバッテリー向け熱伝導材料生産の市場シェア:地域別(2018年~2023年)
- 世界のEVバッテリー向け熱伝導材料生産予測:地域別(2024年~2029年)
- 世界のEVバッテリー向け熱伝導材料市場の価格分析:地域別(2018年~2023年)
- 世界のEVバッテリー向け熱伝導材料の生産と金額、前年比成長率
- 北米のEVバッテリー向け熱伝導材料生産金額の推計と予測(2018年~2029年)
- 欧州のEVバッテリー向け熱伝導材料生産金額の推計と予測(2018年~2029年)
- 中国のEVバッテリー向け熱伝導材料生産金額の推計と予測(2018年~2029年)
- 日本のEVバッテリー向け熱伝導材料生産金額の推計と予測(2018年~2029年)
第4章 EVバッテリー向け熱伝導材料消費:地域別
- 世界のEVバッテリー向け熱伝導材料消費の推計と予測:地域別(2018年・2022年・2029年)
- 世界のEVバッテリー向け熱伝導材料消費:地域別(2018年~2029年)
- 世界のEVバッテリー向け熱伝導材料消費:地域別(2018年~2029年)
- 世界のEVバッテリー向け熱伝導材料消費予測:地域別(2024年~2029年)
- 北米
- 北米のEVバッテリー向け熱伝導材料消費の成長率:国別(2018年・2022年・2029年)
- 北米のEVバッテリー向け熱伝導材料消費:国別(2018年~2029年)
- 米国
- カナダ
- 欧州
- 欧州のEVバッテリー向け熱伝導材料消費の成長率:国別(2018年・2022年・2029年)
- 欧州のEVバッテリー向け熱伝導材料消費:国別(2018年~2029年)
- ドイツ
- フランス
- 英国
- イタリア
- スウェーデン
- アジア太平洋
- アジア太平洋のEVバッテリー向け熱伝導材料消費の成長率:国別(2018年・2022年・2029年)
- アジア太平洋のEVバッテリー向け熱伝導材料消費:地域別(2018年~2029年)
- 中国
- 日本
- 韓国
- 東南アジア
- インド
- ラテンアメリカ
- ラテンアメリカのEVバッテリー向け熱伝導材料消費の成長率:国別(2018年・2022年・2029年)
- ラテンアメリカのEVバッテリー向け熱伝導材料消費:国別(2018年~2029年)
- メキシコ
- ブラジル
- 中東・アフリカ
第5章 セグメンテーション:タイプ別
- 世界のEVバッテリー向け熱伝導材料生産:タイプ別(2018年~2029年)
- 世界のEVバッテリー向け熱伝導材料生産:タイプ別(2018年~2023年)
- 世界のEVバッテリー向け熱伝導材料生産:タイプ別(2024年~2029年)
- 世界のEVバッテリー向け熱伝導材料生産の市場シェア:タイプ別(2018年~2029年)
- 世界のEVバッテリー向け熱伝導材料生産金額:タイプ別(2018年~2029年)
- 世界のEVバッテリー向け熱伝導材料生産金額:タイプ別(2018年~2023年)
- 世界のEVバッテリー向け熱伝導材料生産金額:タイプ別(2024年~2029年)
- 世界のEVバッテリー向け熱伝導材料生産金額の市場シェア:タイプ別(2018年~2029年)
- 世界のEVバッテリー向け熱伝導材料の価格:タイプ別(2018年~2029年)
第6章 セグメンテーション:用途別
- 世界のEVバッテリー向け熱伝導材料生産:用途別(2018年~2029年)
- 世界のEVバッテリー向け熱伝導材料生産:用途別(2018年~2023年)
- 世界のEVバッテリー向け熱伝導材料生産:用途別(2024年~2029年)
- 世界のEVバッテリー向け熱伝導材料生産の市場シェア:用途別(2018年~2029年)
- 世界のEVバッテリー向け熱伝導材料生産金額:用途別(2018年~2029年)
- 世界のEVバッテリー向け熱伝導材料生産金額:用途別(2018年~2023年)
- 世界のEVバッテリー向け熱伝導材料生産金額:用途別(2024年~2029年)
- 世界のEVバッテリー向け熱伝導材料生産金額の市場シェア:用途別(2018年~2029年)
- 世界のEVバッテリー向け熱伝導材料の価格:用途別(2018年~2029年)
第7章 主要企業プロファイル
- Jones Tech PLC
- Shenzhen FRD Science & Technology
- DuPont
- Dow
- Shin-Etsu Chemical
- Parker Hannifin
- Fujipoly
- Henkel
- Wacker
- 3M
- Bornsun
- Jointas Chemical
- Nano TIM
- Amogreentech
第8章 産業チェーンと販売チャネルの分析
- EVバッテリー向け熱伝導材料の産業チェーン分析
- EVバッテリー向け熱伝導材料の主な原材料
- 原材料の主要サプライヤー
- EVバッテリー向け熱伝導材料の生産方式とプロセス
- EVバッテリー向け熱伝導材料の販売とマーケティング
- EVバッテリー向け熱伝導材料の販売チャネル
- EVバッテリー向け熱伝導材料の販売業者
- EVバッテリー向け熱伝導材料の顧客
第9章 EVバッテリー向け熱伝導材料の市場力学
- EVバッテリー向け熱伝導材料業界の動向
- EVバッテリー向け熱伝導材料市場の促進要因
- EVバッテリー向け熱伝導材料市場の課題
- EVバッテリー向け熱伝導材料市場の抑制要因
第10章 調査結果と結論
第11章 調査手法とデータソース
List of Tables
- Table 1. Global Thermal Interface Material for EV Battery Market Value by Type, (US$ Million) & (2022 VS 2029)
- Table 2. Global Thermal Interface Material for EV Battery Market Value by Application, (US$ Million) & (2022 VS 2029)
- Table 3. Global Thermal Interface Material for EV Battery Production by Manufacturers (2018-2023) & (MT)
- Table 4. Global Thermal Interface Material for EV Battery Production Market Share by Manufacturers (2018-2023)
- Table 5. Global Thermal Interface Material for EV Battery Production Value by Manufacturers (2018-2023) & (US$ Million)
- Table 6. Global Thermal Interface Material for EV Battery Production Value Share by Manufacturers (2018-2023)
- Table 7. Global Key Players of Thermal Interface Material for EV Battery, Industry Ranking, 2021 VS 2022
- Table 8. Company Type (Tier 1, Tier 2, and Tier 3) & (based on the Production Value in Thermal Interface Material for EV Battery as of 2022)
- Table 9. Global Market Thermal Interface Material for EV Battery Average Price by Manufacturers (USD/Kg) & (2018-2023)
- Table 10. Global Key Manufacturers of Thermal Interface Material for EV Battery, Manufacturing Base Distribution and Headquarters
- Table 11. Global Thermal Interface Material for EV Battery Manufacturers Market Concentration Ratio (CR5 and HHI)
- Table 12. Mergers & Acquisitions, Expansion Plans
- Table 13. Global Thermal Interface Material for EV Battery Production Value by Region: 2018 VS 2022 VS 2029 (US$ Million)
- Table 14. Global Thermal Interface Material for EV Battery Production Value (US$ Million) by Region (2018-2023)
- Table 15. Global Thermal Interface Material for EV Battery Production Value Market Share by Region (2018-2023)
- Table 16. Global Thermal Interface Material for EV Battery Production Value (US$ Million) Forecast by Region (2024-2029)
- Table 17. Global Thermal Interface Material for EV Battery Production Value Market Share Forecast by Region (2024-2029)
- Table 18. Global Thermal Interface Material for EV Battery Production Comparison by Region: 2018 VS 2022 VS 2029 (MT)
- Table 19. Global Thermal Interface Material for EV Battery Production (MT) by Region (2018-2023)
- Table 20. Global Thermal Interface Material for EV Battery Production Market Share by Region (2018-2023)
- Table 21. Global Thermal Interface Material for EV Battery Production (MT) Forecast by Region (2024-2029)
- Table 22. Global Thermal Interface Material for EV Battery Production Market Share Forecast by Region (2024-2029)
- Table 23. Global Thermal Interface Material for EV Battery Market Average Price (USD/Kg) by Region (2018-2023)
- Table 24. Global Thermal Interface Material for EV Battery Market Average Price (USD/Kg) by Region (2024-202*)
- Table 25. Global Thermal Interface Material for EV Battery Consumption Growth Rate by Region: 2018 VS 2022 VS 2029 (MT)
- Table 26. Global Thermal Interface Material for EV Battery Consumption by Region (2018-2023) & (MT)
- Table 27. Global Thermal Interface Material for EV Battery Consumption Market Share by Region (2018-2023)
- Table 28. Global Thermal Interface Material for EV Battery Forecasted Consumption by Region (2024-2029) & (MT)
- Table 29. Global Thermal Interface Material for EV Battery Forecasted Consumption Market Share by Region (2018-2023)
- Table 30. North America Thermal Interface Material for EV Battery Consumption Growth Rate by Country: 2018 VS 2022 VS 2029 (MT)
- Table 31. North America Thermal Interface Material for EV Battery Consumption by Country (2018-2023) & (MT)
- Table 32. North America Thermal Interface Material for EV Battery Consumption by Country (2024-2029) & (MT)
- Table 33. Europe Thermal Interface Material for EV Battery Consumption Growth Rate by Country: 2018 VS 2022 VS 2029 (MT)
- Table 34. Europe Thermal Interface Material for EV Battery Consumption by Country (2018-2023) & (MT)
- Table 35. Europe Thermal Interface Material for EV Battery Consumption by Country (2024-2029) & (MT)
- Table 36. Asia Pacific Thermal Interface Material for EV Battery Consumption Growth Rate by Country: 2018 VS 2022 VS 2029 (MT)
- Table 37. Asia Pacific Thermal Interface Material for EV Battery Consumption by Region (2018-2023) & (MT)
- Table 38. Asia Pacific Thermal Interface Material for EV Battery Consumption by Region (2024-2029) & (MT)
- Table 39. Latin America Thermal Interface Material for EV Battery Consumption Growth Rate by Country: 2018 VS 2022 VS 2029 (MT)
- Table 40. Latin America Thermal Interface Material for EV Battery Consumption by Country (2018-2023) & (MT)
- Table 41. Latin America Thermal Interface Material for EV Battery Consumption by Country (2024-2029) & (MT)
- Table 42. Global Thermal Interface Material for EV Battery Production (MT) by Type (2018-2023)
- Table 43. Global Thermal Interface Material for EV Battery Production (MT) by Type (2024-2029)
- Table 44. Global Thermal Interface Material for EV Battery Production Market Share by Type (2018-2023)
- Table 45. Global Thermal Interface Material for EV Battery Production Market Share by Type (2024-2029)
- Table 46. Global Thermal Interface Material for EV Battery Production Value (US$ Million) by Type (2018-2023)
- Table 47. Global Thermal Interface Material for EV Battery Production Value (US$ Million) by Type (2024-2029)
- Table 48. Global Thermal Interface Material for EV Battery Production Value Market Share by Type (2018-2023)
- Table 49. Global Thermal Interface Material for EV Battery Production Value Market Share by Type (2024-2029)
- Table 50. Global Thermal Interface Material for EV Battery Price (USD/Kg) by Type (2018-2023)
- Table 51. Global Thermal Interface Material for EV Battery Price (USD/Kg) by Type (2024-2029)
- Table 52. Global Thermal Interface Material for EV Battery Production (MT) by Application (2018-2023)
- Table 53. Global Thermal Interface Material for EV Battery Production (MT) by Application (2024-2029)
- Table 54. Global Thermal Interface Material for EV Battery Production Market Share by Application (2018-2023)
- Table 55. Global Thermal Interface Material for EV Battery Production Market Share by Application (2024-2029)
- Table 56. Global Thermal Interface Material for EV Battery Production Value (US$ Million) by Application (2018-2023)
- Table 57. Global Thermal Interface Material for EV Battery Production Value (US$ Million) by Application (2024-2029)
- Table 58. Global Thermal Interface Material for EV Battery Production Value Market Share by Application (2018-2023)
- Table 59. Global Thermal Interface Material for EV Battery Production Value Market Share by Application (2024-2029)
- Table 60. Global Thermal Interface Material for EV Battery Price (USD/Kg) by Application (2018-2023)
- Table 61. Global Thermal Interface Material for EV Battery Price (USD/Kg) by Application (2024-2029)
- Table 62. Jones Tech PLC Thermal Interface Material for EV Battery Company Information
- Table 63. Jones Tech PLC Thermal Interface Material for EV Battery Production (MT), Value (US$ Million), Price (USD/Kg) and Gross Margin (2018-2023)
- Table 64. Jones Tech PLC Main Business and Markets Served
- Table 65. Shenzhen FRD Science & Technology Thermal Interface Material for EV Battery Company Information
- Table 66. Shenzhen FRD Science & Technology Thermal Interface Material for EV Battery Specification and Application
- Table 67. Shenzhen FRD Science & Technology Thermal Interface Material for EV Battery Production (MT), Value (US$ Million), Price (USD/Kg) and Gross Margin (2018-2023)
- Table 68. Shenzhen FRD Science & Technology Main Business and Markets Served
- Table 69. DuPont Thermal Interface Material for EV Battery Company Information
- Table 70. DuPont Thermal Interface Material for EV Battery Specification and Application
- Table 71. DuPont Thermal Interface Material for EV Battery Production (MT), Value (US$ Million), Price (USD/Kg) and Gross Margin (2018-2023)
- Table 72. DuPont Main Business and Markets Served
- Table 73. Dow Thermal Interface Material for EV Battery Company Information
- Table 74. Dow Thermal Interface Material for EV Battery Production (MT), Value (US$ Million), Price (USD/Kg) and Gross Margin (2018-2023)
- Table 75. Dow Main Business and Markets Served
- Table 76. Shin-Etsu Chemical Thermal Interface Material for EV Battery Company Information
- Table 77. Shin-Etsu Chemical Thermal Interface Material for EV Battery Specification and Application
- Table 78. Shin-Etsu Chemical Thermal Interface Material for EV Battery Production (MT), Value (US$ Million), Price (USD/Kg) and Gross Margin (2018-2023)
- Table 79. Shin-Etsu Chemical Main Business and Markets Served
- Table 80. Parker Hannifin Thermal Interface Material for EV Battery Company Information
- Table 81. Parker Hannifin Thermal Interface Material for EV Battery Specification and Application
- Table 82. Parker Hannifin Thermal Interface Material for EV Battery Production (MT), Value (US$ Million), Price (USD/Kg) and Gross Margin (2018-2023)
- Table 83. Parker Hannifin Main Business and Markets Served
- Table 84. Fujipoly Thermal Interface Material for EV Battery Company Information
- Table 85. Fujipoly Thermal Interface Material for EV Battery Specification and Application
- Table 86. Fujipoly Thermal Interface Material for EV Battery Production (MT), Value (US$ Million), Price (USD/Kg) and Gross Margin (2018-2023)
- Table 87. Fujipoly Main Business and Markets Served
- Table 88. Henkel Thermal Interface Material for EV Battery Company Information
- Table 89. Henkel Thermal Interface Gap Filler for EV Battery Product
- Table 90. Henkel Thermal Interface Gap Pad for EV Battery Product
- Table 91. Henkel Thermal Interface Material for EV Battery Production (MT), Value (US$ Million), Price (USD/Kg) and Gross Margin (2018-2023)
- Table 92. Henkel Main Business and Markets Served
- Table 93. Wacker Thermal Interface Material for EV Battery Company Information
- Table 94. Wacker Thermal Interface Material for EV Battery Production (MT), Value (US$ Million), Price (USD/Kg) and Gross Margin (2018-2023)
- Table 95. Wacker Main Business and Markets Served
- Table 96. 3M Thermal Interface Material for EV Battery Company Information
- Table 97. 3M Thermal Interface Material for EV Battery Product
- Table 98. 3M Thermal Interface Material for EV Battery Production (MT), Value (US$ Million), Price (USD/Kg) and Gross Margin (2018-2023)
- Table 99. 3M Main Business and Markets Served
- Table 100. Bornsun Thermal Interface Material for EV Battery Company Information
- Table 101. Bornsun Thermal Interface Material for EV Battery Production (MT), Value (US$ Million), Price (USD/Kg) and Gross Margin (2018-2023)
- Table 102. Bornsun Main Business and Markets Served
- Table 103. Jointas Chemical Thermal Interface Material for EV Battery Company Information
- Table 104. Jointas Chemical Thermal Interface Material for EV Battery Production (MT), Value (US$ Million), Price (USD/Kg) and Gross Margin (2018-2023)
- Table 105. Jointas Chemical Main Business and Markets Served
- Table 106. Nano TIM Thermal Interface Material for EV Battery Company Information
- Table 107. Nano TIM Thermal Liquid Gap Filler Specification
- Table 108. Nano TIM Thermal Interface Material for EV Battery Production (MT), Value (US$ Million), Price (USD/Kg) and Gross Margin (2018-2023)
- Table 109. Nano TIM Main Business and Markets Served
- Table 110. Nano TIM Recent Developments/Updates
- Table 111. Amogreentech Thermal Interface Material for EV Battery Company Information
- Table 112. Amogreentech Thermal Interface Material for EV Battery Specification and Application
- Table 113. Amogreentech Thermal Interface Material for EV Battery Production (MT), Value (US$ Million), Price (USD/Kg) and Gross Margin (2018-2023)
- Table 114. Amogreentech Main Business and Markets Served
- Table 115. Key Raw Materials Lists
- Table 116. Raw Materials Key Suppliers Lists
- Table 117. Thermal Interface Material for EV Battery Distributors List
- Table 118. Thermal Interface Material for EV Battery Customers List
- Table 119. Electric Vehicles (EVs) Major Manufacturers Electric Vehicles (EVs) Product Offered
- Table 120. Opportunity of TIM in EV Market
- Table 121. Trend of PCB Material in EV Market
- Table 122. Demand relating Electronic Material in EV Market
- Table 123. Thermal Interface Material for EV Battery Market Drivers
- Table 124. Thermal Interface Material for EV Battery Market Challenges
- Table 125. Thermal Interface Material for EV Battery Market Restraints
- Table 126. Research Programs/Design for This Report
- Table 127. Key Data Information from Secondary Sources
- Table 128. Key Data Information from Primary Sources
- Table 129. Authors List of This Report
- Table 130. QYR Business Unit and Senior & Team Lead Analysts
List of Figures
- Figure 1. Product Picture of Thermal Interface Material for EV Battery
- Figure 2. Global Thermal Interface Material for EV Battery Market Value by Type, (US$ Million) & (2022 VS 2029)
- Figure 3. Global Thermal Interface Material for EV Battery Market Share by Type: 2022 VS 2029
- Figure 4. HD Gap Filler Product Picture
- Figure 5. HD Sheet Product Picture
- Figure 6. HD Grease Product Picture
- Figure 7. Global Thermal Interface Material for EV Battery Market Value by Application, (US$ Million) & (2022 VS 2029)
- Figure 8. Global Thermal Interface Material for EV Battery Market Share by Application: 2022 VS 2029
- Figure 9. Passenger Vehicle
- Figure 10. Commercial Vehicle
- Figure 11. Global Thermal Interface Material for EV Battery Production Value (US$ Million), 2018 VS 2022 VS 2029
- Figure 12. Global Thermal Interface Material for EV Battery Production Value (US$ Million) & (2018-2029)
- Figure 13. Global Thermal Interface Material for EV Battery Production (MT) & (2018-2029)
- Figure 14. Global Thermal Interface Material for EV Battery Average Price (USD/Kg) & (2018-2029)
- Figure 15. Thermal Interface Material for EV Battery Report Years Considered
- Figure 16. Thermal Interface Material for EV Battery Production Share by Manufacturers in 2022
- Figure 17. The Global 5 and 10 Largest Players: Market Share by Thermal Interface Material for EV Battery Revenue in 2022
- Figure 18. Global Thermal Interface Material for EV Battery Production Value by Region: 2018 VS 2022 VS 2029 (US$ Million)
- Figure 19. Global Thermal Interface Material for EV Battery Production Comparison by Region: 2018 VS 2022 VS 2029 (MT)
- Figure 20. North America Thermal Interface Material for EV Battery Production Value (US$ Million) Growth Rate (2018-2029)
- Figure 21. Europe Thermal Interface Material for EV Battery Production Value (US$ Million) Growth Rate (2018-2029)
- Figure 22. China Thermal Interface Material for EV Battery Production Value (US$ Million) Growth Rate (2018-2029)
- Figure 23. Japan Thermal Interface Material for EV Battery Production Value (US$ Million) Growth Rate (2018-2029)
- Figure 24. Global Thermal Interface Material for EV Battery Consumption by Region: 2018 VS 2022 VS 2029 (MT)
- Figure 25. Global Thermal Interface Material for EV Battery Consumption Market Share by Region: 2018 VS 2022 VS 2029
- Figure 26. North America Thermal Interface Material for EV Battery Consumption and Growth Rate (2018-2029) & (MT)
- Figure 27. North America Thermal Interface Material for EV Battery Consumption Market Share by Country (2018-2029)
- Figure 28. U.S. Thermal Interface Material for EV Battery Consumption and Growth Rate (2018-2029) & (MT)
- Figure 29. Canada Thermal Interface Material for EV Battery Consumption and Growth Rate (2018-2029) & (MT)
- Figure 30. Europe Thermal Interface Material for EV Battery Consumption and Growth Rate (2018-2029) & (MT)
- Figure 31. Europe Thermal Interface Material for EV Battery Consumption Market Share by Country (2018-2029)
- Figure 32. Germany Thermal Interface Material for EV Battery Consumption and Growth Rate (2018-2029) & (MT)
- Figure 33. France Thermal Interface Material for EV Battery Consumption and Growth Rate (2018-2029) & (MT)
- Figure 34. U.K. Thermal Interface Material for EV Battery Consumption and Growth Rate (2018-2029) & (MT)
- Figure 35. Italy Thermal Interface Material for EV Battery Consumption and Growth Rate (2018-2029) & (MT)
- Figure 36. Sweden Thermal Interface Material for EV Battery Consumption and Growth Rate (2018-2029) & (MT)
- Figure 37. Asia Pacific Thermal Interface Material for EV Battery Consumption and Growth Rate (2018-2029) & (MT)
- Figure 38. Asia Pacific Thermal Interface Material for EV Battery Consumption Market Share by Region (2024-2029)
- Figure 39. China Thermal Interface Material for EV Battery Consumption and Growth Rate (2018-2029) & (MT)
- Figure 40. Japan Thermal Interface Material for EV Battery Consumption and Growth Rate (2018-2029) & (MT)
- Figure 41. South Korea Thermal Interface Material for EV Battery Consumption and Growth Rate (2018-2029) & (MT)
- Figure 42. Southeast Asia Thermal Interface Material for EV Battery Consumption and Growth Rate (2018-2029) & (MT)
- Figure 43. India Thermal Interface Material for EV Battery Consumption and Growth Rate (2018-2029) & (MT)
- Figure 44. Latin America Thermal Interface Material for EV Battery Consumption and Growth Rate (2018-2029) & (MT)
- Figure 45. Latin America Thermal Interface Material for EV Battery Consumption Market Share by Country (2018-2029)
- Figure 46. Mexico Thermal Interface Material for EV Battery Consumption and Growth Rate (2018-2029) & (MT)
- Figure 47. Brazil Thermal Interface Material for EV Battery Consumption and Growth Rate (2018-2029) & (MT)
- Figure 48. Middle East & Africa Thermal Interface Material for EV Battery Consumption and Growth Rate (2018-2029) & (MT)
- Figure 49. Global Production Market Share of Thermal Interface Material for EV Battery by Type (2018-2029)
- Figure 50. Global Production Value Market Share of Thermal Interface Material for EV Battery by Type (2018-2029)
- Figure 51. Global Production Market Share of Thermal Interface Material for EV Battery by Application (2018-2029)
- Figure 52. Global Production Value Market Share of Thermal Interface Material for EV Battery by Application (2018-2029)
- Figure 53. Dow Thermal Interface Material for EV Battery Specification and Application
- Figure 54. Wacker Thermal Interface Material for EV Battery Product
- Figure 55. Jointas Chemical Thermal Interface Material for EV Battery Product
- Figure 56. Thermal Interface Material for EV Battery Value Chain
- Figure 57. Manufacturing Process Analysis of Polymer Based Thermal Pad
- Figure 58. Manufacturing Process Analysis of Polymer Based Thermal Grease
- Figure 59. Distributors Profiles
- Figure 60. Bottom-up and Top-down Approaches for This Report
- Figure 61. Data Triangulation
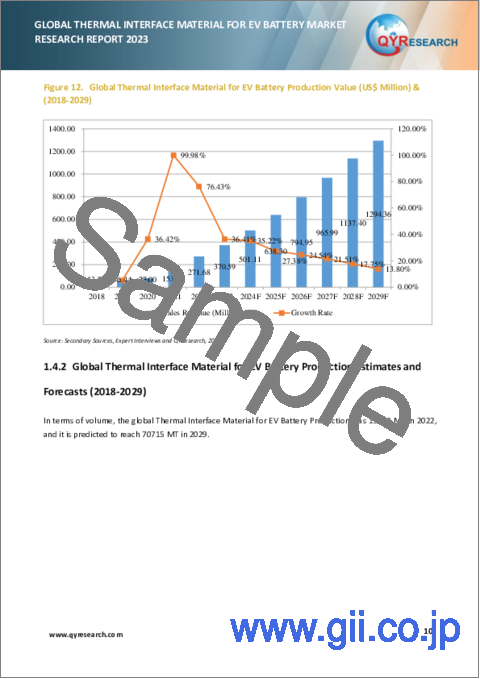
The global Thermal Interface Material for EV Battery market was valued at USD 271.68 million in 2022 and is expected to reach USD 1294.36 million by the end of 2029, growing at a CAGR of 23.18% between 2023 and 2029.
The major global manufacturers of Thermal Interface Material for EV Battery include: Jones Tech PLC, Shenzhen FRD Science & Technology, DuPont, Dow, Shin-Etsu Chemical, Parker Hannifin, Fujipoly, Henkel, and Wacker, etc. In 2022, the world's top three vendors accounted for approximately 53.27% of the revenue.
Report Scope
This report aims to provide a comprehensive presentation of the global market for Thermal Interface Material for EV Battery, with both quantitative and qualitative analysis, to help readers develop business/growth strategies, assess the market competitive situation, analyze their position in the current marketplace, and make informed business decisions regarding Thermal Interface Material for EV Battery.
The Thermal Interface Material for EV Battery market size, estimations, and forecasts are provided in terms of output/shipments (MT) and revenue ($ millions), considering 2022 as the base year, with history and forecast data for the period from 2018 to 2029. This report segments the global Thermal Interface Material for EV Battery market comprehensively. Regional market sizes, concerning products by Type, by Application, and by players, are also provided.
For a more in-depth understanding of the market, the report provides profiles of the competitive landscape, key competitors, and their respective market ranks. The report also discusses technological trends and new product developments.
The report will help the Thermal Interface Material for EV Battery manufacturers, new entrants, and industry chain related companies in this market with information on the revenues, production, and average price for the overall market and the sub-segments across the different segments, by company, by Type, by Application, and by regions.
By Company
- Jones Tech PLC
- Shenzhen FRD Science & Technology
- DuPont
- Dow
- Shin-Etsu Chemical
- Parker Hannifin
- Fujipoly
- Henkel
- Wacker
- 3M
- Bornsun
- Jointas Chemical
- Nano TIM
- Amogreentech
Segment by Type
- HD Gap Filler
- HD Sheet
- HD Grease
- Other
Segment by Application
- Passenger Vehicle
- Commercial Vehicle
Production by Region
- North America
- Europe
- China
- Japan
Consumption by Region
- North America
- U.S.
- Canada
- Asia-Pacific
- China
- Japan
- South Korea
- China Taiwan
- Southeast Asia
- India
- Australia
- Europe
- Germany
- France
- U.K.
- Italy
- Russia
- Rest of Europe
- South America
- Mexico
- Brazil
- Rest of South America
Core Chapters
- Chapter 1: Introduces the report scope of the report, executive summary of different market segments (by region, by Type, by Application, etc), including the market size of each market segment, future development potential, and so on. It offers a high-level view of the current state of the market and its likely evolution in the short to mid-term, and long term.
- Chapter 2: Detailed analysis of Thermal Interface Material for EV Battery manufacturers competitive landscape, price, production and value market share, latest development plan, merger, and acquisition information, etc.
- Chapter 3: Production/output, value of Thermal Interface Material for EV Battery by region/country. It provides a quantitative analysis of the market size and development potential of each region in the next six years.
- Chapter 4: Consumption of Thermal Interface Material for EV Battery in regional level and country level. It provides a quantitative analysis of the market size and development potential of each region and its main countries and introduces the market development, future development prospects, market space, and production of each country in the world.
- Chapter 5: Provides the analysis of various market segments by Type, covering the market size and development potential of each market segment, to help readers find the blue ocean market in different market segments.
- Chapter 6: Provides the analysis of various market segments by Application, covering the market size and development potential of each market segment, to help readers find the blue ocean market in different downstream markets.
- Chapter 7: Provides profiles of key players, introducing the basic situation of the main companies in the market in detail, including product production/output, value, price, gross margin, product introduction, recent development, etc.
- Chapter 8: Analysis of industrial chain, including the upstream and downstream of the industry.
- Chapter 9: Introduces the market dynamics, latest developments of the market, the driving factors and restrictive factors of the market, the challenges and risks faced by manufacturers in the industry, and the analysis of relevant policies in the industry.
- Chapter 10: The main points and conclusions of the report.
Table of Contents
1 Thermal Interface Material for EV Battery Market Overview
- 1.1 Product Definition
- 1.2 Thermal Interface Material for EV Battery by Type
- 1.2.1 Global Thermal Interface Material for EV Battery Market Value Growth Rate Analysis by Type: 2022 VS 2029
- 1.2.2 HD Gap Filler
- 1.2.3 HD Sheet
- 1.2.4 HD Grease
- 1.2.5 Other
- 1.3 Thermal Interface Material for EV Battery by Application
- 1.3.1 Global Thermal Interface Material for EV Battery Market Value Growth Rate Analysis by Application: 2022 VS 2029
- 1.3.2 Passenger Vehicle
- 1.3.3 Commercial Vehicle
- 1.4 Global Market Growth Prospects
- 1.4.1 Global Thermal Interface Material for EV Battery Production Value Estimates and Forecasts (2018-2029)
- 1.4.2 Global Thermal Interface Material for EV Battery Production Estimates and Forecasts (2018-2029)
- 1.4.3 Global Thermal Interface Material for EV Battery Market Average Price Estimates and Forecasts (2018-2029)
- 1.5 Assumptions and Limitations
2 Market Competition by Manufacturers
- 2.1 Global Thermal Interface Material for EV Battery Production Market Share by Manufacturers (2018-2023)
- 2.2 Global Thermal Interface Material for EV Battery Production Value Market Share by Manufacturers (2018-2023)
- 2.3 Global Key Players of Thermal Interface Material for EV Battery, Industry Ranking, 2021 VS 2022
- 2.4 Global Thermal Interface Material for EV Battery Market Share by Company Type (Tier 1, Tier 2, and Tier 3)
- 2.5 Global Thermal Interface Material for EV Battery Average Price by Manufacturers (2018-2023)
- 2.6 Global Key Manufacturers of Thermal Interface Material for EV Battery, Manufacturing Base Distribution and Headquarters
- 2.7 Thermal Interface Material for EV Battery Market Competitive Situation and Trends
- 2.7.1 Thermal Interface Material for EV Battery Market Concentration Rate
- 2.7.2 Global 5 and 10 Largest Thermal Interface Material for EV Battery Players Market Share by Revenue
- 2.8 Mergers & Acquisitions, Expansion
3 Thermal Interface Material for EV Battery Production by Region
- 3.1 Global Thermal Interface Material for EV Battery Production Value Estimates and Forecasts by Region: 2018 VS 2022 VS 2029
- 3.2 Global Thermal Interface Material for EV Battery Production Value by Region (2018-2029)
- 3.2.1 Global Thermal Interface Material for EV Battery Production Value Market Share by Region (2018-2023)
- 3.2.2 Global Forecasted Production Value of Thermal Interface Material for EV Battery by Region (2024-2029)
- 3.3 Global Thermal Interface Material for EV Battery Production Estimates and Forecasts by Region: 2018 VS 2022 VS 2029
- 3.4 Global Thermal Interface Material for EV Battery Production by Region (2018-2029)
- 3.4.1 Global Thermal Interface Material for EV Battery Production Market Share by Region (2018-2023)
- 3.4.2 Global Forecasted Production of Thermal Interface Material for EV Battery by Region (2024-2029)
- 3.5 Global Thermal Interface Material for EV Battery Market Price Analysis by Region (2018-2023)
- 3.6 Global Thermal Interface Material for EV Battery Production and Value, Year-over-Year Growth
- 3.6.1 North America Thermal Interface Material for EV Battery Production Value Estimates and Forecasts (2018-2029)
- 3.6.2 Europe Thermal Interface Material for EV Battery Production Value Estimates and Forecasts (2018-2029)
- 3.6.3 China Thermal Interface Material for EV Battery Production Value Estimates and Forecasts (2018-2029)
- 3.6.4 Japan Thermal Interface Material for EV Battery Production Value Estimates and Forecasts (2018-2029)
4 Thermal Interface Material for EV Battery Consumption by Region
- 4.1 Global Thermal Interface Material for EV Battery Consumption Estimates and Forecasts by Region: 2018 VS 2022 VS 2029
- 4.2 Global Thermal Interface Material for EV Battery Consumption by Region (2018-2029)
- 4.2.1 Global Thermal Interface Material for EV Battery Consumption by Region (2018-2029)
- 4.2.2 Global Thermal Interface Material for EV Battery Forecasted Consumption by Region (2024-2029)
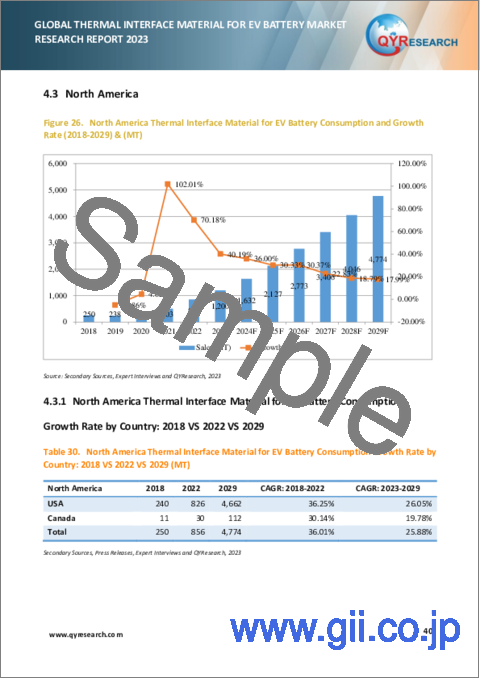
- 4.3 North America
- 4.3.1 North America Thermal Interface Material for EV Battery Consumption Growth Rate by Country: 2018 VS 2022 VS 2029
- 4.3.2 North America Thermal Interface Material for EV Battery Consumption by Country (2018-2029)
- 4.3.3 U.S.
- 4.3.4 Canada
- 4.4 Europe
- 4.4.1 Europe Thermal Interface Material for EV Battery Consumption Growth Rate by Country: 2018 VS 2022 VS 2029
- 4.4.2 Europe Thermal Interface Material for EV Battery Consumption by Country (2018-2029)
- 4.4.3 Germany
- 4.4.4 France
- 4.4.5 U.K.
- 4.4.6 Italy
- 4.4.7 Sweden
- 4.5 Asia Pacific
- 4.5.1 Asia Pacific Thermal Interface Material for EV Battery Consumption Growth Rate by Country: 2018 VS 2022 VS 2029
- 4.5.2 Asia Pacific Thermal Interface Material for EV Battery Consumption by Region (2018-2029)
- 4.5.3 China
- 4.5.4 Japan
- 4.5.5 South Korea
- 4.5.6 Southeast Asia
- 4.5.7 India
- 4.6 Latin America
- 4.6.1 Latin America Thermal Interface Material for EV Battery Consumption Growth Rate by Country: 2018 VS 2022 VS 2029
- 4.6.2 Latin America Thermal Interface Material for EV Battery Consumption by Country (2018-2029)
- 4.6.3 Mexico
- 4.6.4 Brazil
- 4.7 Middle East & Africa
5 Segment by Type
- 5.1 Global Thermal Interface Material for EV Battery Production by Type (2018-2029)
- 5.1.1 Global Thermal Interface Material for EV Battery Production by Type (2018-2023)
- 5.1.2 Global Thermal Interface Material for EV Battery Production by Type (2024-2029)
- 5.1.3 Global Thermal Interface Material for EV Battery Production Market Share by Type (2018-2029)
- 5.2 Global Thermal Interface Material for EV Battery Production Value by Type (2018-2029)
- 5.2.1 Global Thermal Interface Material for EV Battery Production Value by Type (2018-2023)
- 5.2.2 Global Thermal Interface Material for EV Battery Production Value by Type (2024-2029)
- 5.2.3 Global Thermal Interface Material for EV Battery Production Value Market Share by Type (2018-2029)
- 5.3 Global Thermal Interface Material for EV Battery Price by Type (2018-2029)
6 Segment by Application
- 6.1 Global Thermal Interface Material for EV Battery Production by Application (2018-2029)
- 6.1.1 Global Thermal Interface Material for EV Battery Production by Application (2018-2023)
- 6.1.2 Global Thermal Interface Material for EV Battery Production by Application (2024-2029)
- 6.1.3 Global Thermal Interface Material for EV Battery Production Market Share by Application (2018-2029)
- 6.2 Global Thermal Interface Material for EV Battery Production Value by Application (2018-2029)
- 6.2.1 Global Thermal Interface Material for EV Battery Production Value by Application (2018-2023)
- 6.2.2 Global Thermal Interface Material for EV Battery Production Value by Application (2024-2029)
- 6.2.3 Global Thermal Interface Material for EV Battery Production Value Market Share by Application (2018-2029)
- 6.3 Global Thermal Interface Material for EV Battery Price by Application (2018-2029)
7 Key Companies Profiled
- 7.1 Jones Tech PLC
- 7.1.1 Jones Tech PLC Thermal Interface Material for EV Battery Company Information
- 7.1.2 Jones Tech PLC Thermal Interface Material for EV Battery Product Portfolio
- 7.1.3 Jones Tech PLC Thermal Interface Material for EV Battery Production, Value, Price and Gross Margin (2018-2023)
- 7.1.4 Jones Tech PLC Main Business and Markets Served
- 7.2 Shenzhen FRD Science & Technology
- 7.2.1 Shenzhen FRD Science & Technology Thermal Interface Material for EV Battery Company Information
- 7.2.2 Shenzhen FRD Science & Technology Thermal Interface Material for EV Battery Product Portfolio
- 7.2.3 Shenzhen FRD Science & Technology Thermal Interface Material for EV Battery Production, Value, Price and Gross Margin (2018-2023)
- 7.2.4 Shenzhen FRD Science & Technology Main Business and Markets Served
- 7.3 DuPont
- 7.3.1 DuPont Thermal Interface Material for EV Battery Company Information
- 7.3.2 DuPont Thermal Interface Material for EV Battery Product Portfolio
- 7.3.3 DuPont Thermal Interface Material for EV Battery Production, Value, Price and Gross Margin (2018-2023)
- 7.3.4 DuPont Main Business and Markets Served
- 7.4 Dow
- 7.4.1 Dow Thermal Interface Material for EV Battery Company Information
- 7.4.2 Dow Thermal Interface Material for EV Battery Product Portfolio
- 7.4.3 Dow Thermal Interface Material for EV Battery Production, Value, Price and Gross Margin (2018-2023)
- 7.4.4 Dow Main Business and Markets Served
- 7.5 Shin-Etsu Chemical
- 7.5.1 Shin-Etsu Chemical Thermal Interface Material for EV Battery Company Information
- 7.5.2 Shin-Etsu Chemical Thermal Interface Material for EV Battery Product Portfolio
- 7.5.3 Shin-Etsu Chemical Thermal Interface Material for EV Battery Production, Value, Price and Gross Margin (2018-2023)
- 7.5.4 Shin-Etsu Chemical Main Business and Markets Served
- 7.6 Parker Hannifin
- 7.6.1 Parker Hannifin Thermal Interface Material for EV Battery Company Information
- 7.6.2 Parker Hannifin Thermal Interface Material for EV Battery Product Portfolio
- 7.6.3 Parker Hannifin Thermal Interface Material for EV Battery Production, Value, Price and Gross Margin (2018-2023)
- 7.6.4 Parker Hannifin Main Business and Markets Served
- 7.7 Fujipoly
- 7.7.1 Fujipoly Thermal Interface Material for EV Battery Company Information
- 7.7.2 Fujipoly Thermal Interface Material for EV Battery Product Portfolio
- 7.7.3 Fujipoly Thermal Interface Material for EV Battery Production, Value, Price and Gross Margin (2018-2023)
- 7.7.4 Fujipoly Main Business and Markets Served
- 7.8 Henkel
- 7.8.1 Henkel Thermal Interface Material for EV Battery Company Information
- 7.8.2 Henkel Thermal Interface Material for EV Battery Product Portfolio
- 7.8.3 Henkel Thermal Interface Material for EV Battery Production, Value, Price and Gross Margin (2018-2023)
- 7.8.4 Henkel Main Business and Markets Served
- 7.9 Wacker
- 7.9.1 Wacker Thermal Interface Material for EV Battery Company Information
- 7.9.2 Wacker Thermal Interface Material for EV Battery Product Portfolio
- 7.9.3 Wacker Thermal Interface Material for EV Battery Production, Value, Price and Gross Margin (2018-2023)
- 7.9.4 Wacker Main Business and Markets Served
- 7.10 3M
- 7.10.1 3M Thermal Interface Material for EV Battery Company Information
- 7.10.2 3M Thermal Interface Material for EV Battery Product Portfolio
- 7.10.3 3M Thermal Interface Material for EV Battery Production, Value, Price and Gross Margin (2018-2023)
- 7.10.4 3M Main Business and Markets Served
- 7.11 Bornsun
- 7.11.1 Bornsun Thermal Interface Material for EV Battery Company Information
- 7.11.2 Bornsun Thermal Interface Material for EV Battery Product Portfolio
- 7.11.3 Bornsun Thermal Interface Material for EV Battery Production, Value, Price and Gross Margin (2018-2023)
- 7.11.4 Bornsun Main Business and Markets Served
- 7.12 Jointas Chemical
- 7.12.1 Jointas Chemical Thermal Interface Material for EV Battery Company Information
- 7.12.2 Jointas Chemical Thermal Interface Material for EV Battery Product Portfolio
- 7.12.3 Jointas Chemical Thermal Interface Material for EV Battery Production, Value, Price and Gross Margin (2018-2023)
- 7.12.4 Jointas Chemical Main Business and Markets Served
- 7.13 Nano TIM
- 7.13.1 Nano TIM Thermal Interface Material for EV Battery Company Information
- 7.13.2 Nano TIM Thermal Interface Material for EV Battery Product Portfolio
- 7.13.3 Nano TIM Thermal Interface Material for EV Battery Production, Value, Price and Gross Margin (2018-2023)
- 7.13.4 Nano TIM Main Business and Markets Served
- 7.13.5 Nano TIM Recent Developments/Updates
- 7.14 Amogreentech
- 7.14.1 Amogreentech Thermal Interface Material for EV Battery Company Information
- 7.14.2 Amogreentech Thermal Interface Material for EV Battery Product Portfolio
- 7.14.3 Amogreentech Thermal Interface Material for EV Battery Production, Value, Price and Gross Margin (2018-2023)
- 7.14.4 Amogreentech Main Business and Markets Served
8 Industry Chain and Sales Channels Analysis
- 8.1 Thermal Interface Material for EV Battery Industry Chain Analysis
- 8.2 Thermal Interface Material for EV Battery Key Raw Materials
- 8.2.1 Raw Materials Key Suppliers
- 8.3 Thermal Interface Material for EV Battery Production Mode & Process
- 8.4 Thermal Interface Material for EV Battery Sales and Marketing
- 8.4.1 Thermal Interface Material for EV Battery Sales Channels
- 8.4.2 Thermal Interface Material for EV Battery Distributors
- 8.5 Thermal Interface Material for EV Battery Customers
9 Thermal Interface Material for EV Battery Market Dynamics
- 9.1 Thermal Interface Material for EV Battery Industry Trends
- 9.2 Thermal Interface Material for EV Battery Market Drivers
- 9.3 Thermal Interface Material for EV Battery Market Challenges
- 9.4 Thermal Interface Material for EV Battery Market Restraints
10 Research Findings and Conclusion
11 Methodology and Data Source
- 11.1 Methodology/Research Approach
- 11.1.1 Research Programs/Design
- 11.1.2 Market Size Estimation
- 11.1.3 Market Breakdown and Data Triangulation
- 11.2 Data Source
- 11.2.1 Secondary Sources
- 11.2.2 Primary Sources
- 11.3 Author List
- 11.4 Disclaimer
