|
|
市場調査レポート
商品コード
1337843
世界および米国のブロードバンドネットワークゲートウェイ (BNG) 市場:2023-2029年Global and United States Broadband Network Gateway (BNG) Market Report & Forecast 2023-2029 |
||||||
|
|
|||||||
カスタマイズ可能
適宜更新あり
|
|||||||


| 世界および米国のブロードバンドネットワークゲートウェイ (BNG) 市場:2023-2029年 |
|
出版日: 2023年08月25日
発行: QYResearch
ページ情報: 英文 120 Pages
納期: 2~3営業日
|

- 全表示
- 概要
- 図表
- 目次
世界のブロードバンドネットワークゲートウェイ (BNG) の市場規模は、2022年の9億3,858万米ドルから、予測期間中は13.16%のCAGRで推移し、2029年には21億746万米ドルの収益規模に成長すると予測されています。
米国のブロードバンドネットワークゲートウェイ (BNG) の市場規模は、2022年の2億6,196万米ドルから、予測期間中は12.65%のCAGRで推移し、2029年には5億7,069万米ドルの収益規模に成長すると予測されています。
世界の主要5社による2022年のシェアは72.61%を示しています。
当レポートでは、世界および米国のブロードバンドネットワークゲートウェイ (BNG) の市場を調査し、市場および製品の概要、競合情勢、市場規模の推移・予測、各種区分・地域/主要国別の詳細分析、価格動向、市場成長への各種影響因子の分析、主要企業の分析などをまとめています。
目次
第1章 調査範囲
- 製品概要
- BNG市場の見通し:2018 vs 2022 vs 2029
- 世界市場の推移・予測
- 米国市場の推移・予測
- 市場規模:米国 vs 世界:2018 vs 2022 vs 2029
- 市場シェア:2018 vs 2022 vs 2029
- 成長率:米国 vs 世界:2018 vs 2022 vs 2029
- 市場力学
- 産業動向
- 市場促進要因
- 市場課題
- ポーターのファイブフォース分析
- 前提・制約
- 調査目的
- 調査年数
第2章 ブロードバンドネットワークゲートウェイ (BNG) 市場:タイプ別
- BNG市場:タイプ別
- 従来型BNG
- vBNG
- 世界市場の規模(2018、2022、2029年)
- 世界市場の規模(2018~2029年)
- 米国市場の規模(2018、2022、2029年)
- 米国市場の規模(2018~2029年)
第3章 ブロードバンドネットワークゲートウェイ (BNG) 市場:用途別
- BNG市場:用途別
- 世界市場の規模(2018、2022、2029年)
- 世界市場の規模(2018~2029年)
- 米国市場の規模(2018、2022、2029年)
- 米国市場の規模(2018~2029年)
第4章 世界のブロードバンドネットワークゲートウェイ (BNG) 市場の競合情勢:企業別
- 市場規模:企業別
- 集中率(CR)
- 世界の主要企業の本社・サービス対象エリア
- 世界の主要企業の製品・用途
- 世界の主要企業の設立日
- M&A・拡大計画
- 米国市場の規模:企業別
第5章 世界のブロードバンドネットワークゲートウェイ (BNG) 市場規模:地域別
- 市場規模:2018 vs 2022 vs 2029
- 市場規模:2018~2029年
第6章 地域・国別市場
- 北米
- 欧州
- アジア太平洋
- ラテンアメリカ・中東・アフリカ
第7章 主要企業のプロファイル
- Cisco Systems
- Juniper Networks
- Nokia
- Huawei Technologies
- Casa Systems
- Ciena
- NetElastic
- Waystream AB
- Sanctum Networks
- RtBrick
第8章 調査結果・総論
第9章 付録
List of Tables
- Table 1. Broadband Network Gateway (BNG) Market Size, United States VS Global, CAGR (2018 VS 2022 VS 2029)
- Table 2. Broadband Network Gateway (BNG) Market Trends
- Table 3. Broadband Network Gateway (BNG) Market Drivers
- Table 4. Broadband Network Gateway (BNG) Market Challenges
- Table 5. Global Broadband Network Gateway (BNG) Market Size Growth Rate (CAGR) by Type: 2018 VS 2022 VS 2029 (US$ Million)
- Table 6. United States Broadband Network Gateway (BNG) Market Size by Type: 2018 VS 2022 VS 2029 (US$ Million)
- Table 7. Global Broadband Network Gateway (BNG) Market Size Growth Rate (CAGR) by Application: 2018 VS 2022 VS 2029 (US$ Million)
- Table 8. United States Broadband Network Gateway (BNG) Market Size by Application: 2018 VS 2022 VS 2029 (US$ Million)
- Table 9. Global Key Companies of Broadband Network Gateway (BNG), Ranked by Revenue (2022) & (US$ Million)
- Table 10. Global Broadband Network Gateway (BNG) Revenue by Player, (US$ Million), 2018-2023
- Table 11. Global Broadband Network Gateway (BNG) Revenue Share by Player, 2018-2023
- Table 12. Global Broadband Network Gateway (BNG) Companies Market Concentration Ratio (CR5)
- Table 13. Global Broadband Network Gateway (BNG) by Company Type (Tier 1, Tier 2, and Tier 3) & (based on the Revenue in Broadband Network Gateway (BNG) as of 2022)
- Table 14. Global Key Players of Broadband Network Gateway (BNG), Headquarters and Area Served
- Table 15. Global Key Players of Broadband Network Gateway (BNG), Product
- Table 16. Global Established Date of Key Broadband Network Gateway (BNG) Players
- Table 17. Key Players of Broadband Network Gateway (BNG) in United States, Ranked by Revenue (2022) & (US$ Million)
- Table 18. United States Broadband Network Gateway (BNG) Revenue by Players, (US$ Million), (2018-2023)
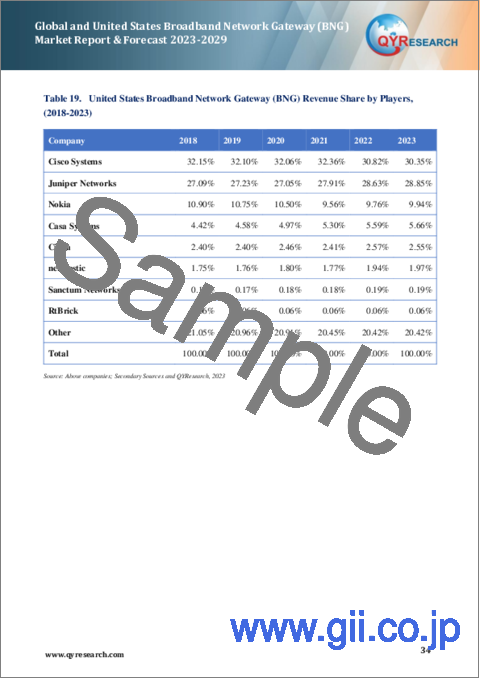
- Table 19. United States Broadband Network Gateway (BNG) Revenue Share by Players, (2018-2023)
- Table 20. Global Broadband Network Gateway (BNG) Market Size Growth Rate (CAGR) by Region (US$ Million): 2018 VS 2022 VS 2029
- Table 21. Global Broadband Network Gateway (BNG) Market Size by Region (2018-2023) & (US$ Million)
- Table 22. Global Broadband Network Gateway (BNG) Market Size Forecast by Region (2024-2029) & (US$ Million)
- Table 23. North America Broadband Network Gateway (BNG) Consumption Growth Rate by Country: 2018 VS 2022 VS 2029 (Million USD)
- Table 24. North America Broadband Network Gateway (BNG) Consumption by Country (2018-2023) & (Million USD)
- Table 25. North America Broadband Network Gateway (BNG) Consumption by Country (2024-2029) & (Million USD)
- Table 26. Europe Broadband Network Gateway (BNG) Consumption Growth Rate by Country: 2018 VS 2022 VS 2029 (Million USD)
- Table 27. Europe Broadband Network Gateway (BNG) Consumption by Country (2018-2023) & (Million USD)
- Table 28. Europe Broadband Network Gateway (BNG) Consumption by Country (2024-2029) & (Million USD)
- Table 29. Asia Pacific Broadband Network Gateway (BNG) Consumption Growth Rate by Country: 2018 VS 2022 VS 2029 (Million USD)
- Table 30. Asia Pacific Broadband Network Gateway (BNG) Consumption by Region (2018-2023) & (Million USD)
- Table 31. Asia Pacific Broadband Network Gateway (BNG) Consumption by Region (2024-2029) & (Million USD)
- Table 32. Latin America, Middle East & Africa Broadband Network Gateway (BNG) Consumption Growth Rate by Country: 2018 VS 2022 VS 2029 (Million USD)
- Table 33. Latin America, Middle East & Africa Broadband Network Gateway (BNG) Consumption by Country (2018-2023) & (Million USD)
- Table 34. Latin America, Middle East & Africa Broadband Network Gateway (BNG) Consumption by Country (2024-2029) & (Million USD)
- Table 35. Cisco Systems Basic Information, Manufacturing Base, Sales Area and Its Competitors
- Table 36. Cisco Systems Broadband Network Gateway (BNG) Revenue (Million USD) and Gross Margin (%) (2018-2023)
- Table 37. Juniper Networks Basic Information, Manufacturing Base, Sales Area and Its Competitors
- Table 38. Juniper Networks Broadband Network Gateway (BNG) Revenue (Million USD) and Gross Margin (%) (2018-2023)
- Table 39. Nokia Basic Information, Manufacturing Base, Sales Area and Its Competitors
- Table 40. Nokia Broadband Network Gateway (BNG) Revenue (Million USD) and Gross Margin (%) (2018-2023)
- Table 41. Huawei Technologies Basic Information, Manufacturing Base, Sales Area and Its Competitors
- Table 42. Huawei Technologies Broadband Network Gateway (BNG) Revenue (Million USD) and Gross Margin (%) (2018-2023)
- Table 43. Casa Systems Basic Information, Manufacturing Base, Sales Area and Its Competitors
- Table 44. Casa Systems Broadband Network Gateway (BNG) Revenue (Million USD) and Gross Margin (%) (2018-2023)
- Table 45. Ciena Basic Information, Manufacturing Base, Sales Area and Its Competitors
- Table 46. Ciena Broadband Network Gateway (BNG) Revenue (Million USD) and Gross Margin (%) (2018-2023)
- Table 47. NetElastic Basic Information, Manufacturing Base, Sales Area and Its Competitors
- Table 48. NetElastic Broadband Network Gateway (BNG) Revenue (Million USD) and Gross Margin (%) (2018-2023)
- Table 49. Waystream AB Basic Information, Manufacturing Base, Sales Area and Its Competitors
- Table 50. Waystream AB Broadband Network Gateway (BNG) Revenue (Million USD) and Gross Margin (%) (2018-2023)
- Table 51. Sanctum Networks Basic Information, Manufacturing Base, Sales Area and Its Competitors
- Table 52. Sanctum Networks Broadband Network Gateway (BNG) Revenue (Million USD) and Gross Margin (%) (2018-2023)
- Table 53. RtBrick Basic Information, Manufacturing Base, Sales Area and Its Competitors
- Table 54. RtBrick Broadband Network Gateway (BNG) Revenue (Million USD) and Gross Margin (%) (2018-2023)
- Table 55. Research Programs/Design for This Report
- Table 56. Key Data Information from Secondary Sources
- Table 57. Key Data Information from Primary Sources
- Table 58. QYR Business Unit and Senior & Team Lead Analysts
List of Figures
- Figure 1. Broadband Network Gateway (BNG) Product Examples Picture
- Figure 2. Global Broadband Network Gateway (BNG) Market Size, (US$ Million), 2018 VS 2022 VS 2029
- Figure 3. Global Broadband Network Gateway (BNG) Market Size 2018-2029 (US$ Million)
- Figure 4. United States Broadband Network Gateway (BNG) Market Size, (US$ Million), 2018 VS 2022 VS 2029
- Figure 5. United States Broadband Network Gateway (BNG) Market Size 2018-2029 (US$ Million)
- Figure 6. United States Broadband Network Gateway (BNG) Market Share in Global 2018-2029
- Figure 7. Porter's Five Forces Analysis
- Figure 8. Broadband Network Gateway (BNG) Report Years Considered
- Figure 9. Global Broadband Network Gateway (BNG) Market Share by Type in 2022 & 2029
- Figure 10. Global Broadband Network Gateway (BNG) Market Size by Type (2018-2029) & (US$ Million)
- Figure 11. Global Broadband Network Gateway (BNG) Market Share by Type (2018-2029)
- Figure 12. United States Broadband Network Gateway (BNG) Market Share by Type in 2022 & 2029
- Figure 13. United States Broadband Network Gateway (BNG) Market Size by Type (2018-2029) & (US$ Million)
- Figure 14. United States Broadband Network Gateway (BNG) Market Share by Type (2018-2029)
- Figure 15. Broadband Network Gateway (BNG) Application
- Figure 16. Global Broadband Network Gateway (BNG) Market Share by Application in 2022 & 2029
- Figure 17. Global Broadband Network Gateway (BNG) Market Size by Application (2018-2029) & (US$ Million)
- Figure 18. Global Broadband Network Gateway (BNG) Market Share by Application (2018-2029)
- Figure 19. United States Broadband Network Gateway (BNG) Market Share by Application in 2022 & 2029
- Figure 20. United States Broadband Network Gateway (BNG) Market Size by Application (2018-2029) & (US$ Million)
- Figure 21. United States Broadband Network Gateway (BNG) Market Share by Application (2018-2029)
- Figure 22. The Top 5 and 10 Largest Companies of Broadband Network Gateway (BNG) in the World: Market Share by Broadband Network Gateway (BNG) Revenue in 2022
- Figure 23. Global Broadband Network Gateway (BNG) Market Size Market Share by Region: 2018 VS 2022 VS 2029
- Figure 24. Global Broadband Network Gateway (BNG) Market Share by Region (2018-2029)
- Figure 25. North America Broadband Network Gateway (BNG) Consumption and Growth Rate (2018-2029) & (Million USD)
- Figure 26. North America Broadband Network Gateway (BNG) Consumption Market Share by Country (2018-2029)
- Figure 27. U.S. Broadband Network Gateway (BNG) Consumption and Growth Rate (2018-2029) & (Million USD)
- Figure 28. Canada Broadband Network Gateway (BNG) Consumption and Growth Rate (2018-2029) & (Million USD)
- Figure 29. Europe Broadband Network Gateway (BNG) Consumption and Growth Rate (2018-2029) & (Million USD)
- Figure 30. Europe Broadband Network Gateway (BNG) Consumption Market Share by Country (2018-2029)
- Figure 31. Germany Broadband Network Gateway (BNG) Consumption and Growth Rate (2018-2029) & (Million USD)
- Figure 32. France Broadband Network Gateway (BNG) Consumption and Growth Rate (2018-2029) & (Million USD)
- Figure 33. U.K. Broadband Network Gateway (BNG) Consumption and Growth Rate (2018-2029) & (Million USD)
- Figure 34. Italy Broadband Network Gateway (BNG) Consumption and Growth Rate (2018-2029) & (Million USD)
- Figure 35. Russia Broadband Network Gateway (BNG) Consumption and Growth Rate (2018-2029) & (Million USD)
- Figure 36. Asia Pacific Broadband Network Gateway (BNG) Consumption and Growth Rate (2018-2029) & (Million USD)
- Figure 37. Asia Pacific Broadband Network Gateway (BNG) Consumption Market Share by Region (2024-2029)
- Figure 38. China Broadband Network Gateway (BNG) Consumption and Growth Rate (2018-2029) & (Million USD)
- Figure 39. Japan Broadband Network Gateway (BNG) Consumption and Growth Rate (2018-2029) & (Million USD)
- Figure 40. South Korea Broadband Network Gateway (BNG) Consumption and Growth Rate (2018-2029) & (Million USD)
- Figure 41. China Taiwan Broadband Network Gateway (BNG) Consumption and Growth Rate (2018-2029) & (Million USD)
- Figure 42. India Broadband Network Gateway (BNG) Consumption and Growth Rate (2018-2029) & (Million USD)
- Figure 43. Australia Broadband Network Gateway (BNG) Consumption and Growth Rate (2018-2029) & (Million USD)
- Figure 44. Indonesia Broadband Network Gateway (BNG) Consumption and Growth Rate (2018-2029) & (Million USD)
- Figure 45. Thailand Broadband Network Gateway (BNG) Consumption and Growth Rate (2018-2029) & (Million USD)
- Figure 46. Malaysia Broadband Network Gateway (BNG) Consumption and Growth Rate (2018-2029) & (Million USD)
- Figure 47. Latin America, Middle East & Africa Broadband Network Gateway (BNG) Consumption and Growth Rate (2018-2029) & (Million USD)
- Figure 48. Latin America, Middle East & Africa Broadband Network Gateway (BNG) Consumption Market Share by Country (2018-2029)
- Figure 49. Mexico Broadband Network Gateway (BNG) Consumption and Growth Rate (2018-2029) & (Million USD)
- Figure 50. Brazil Broadband Network Gateway (BNG) Consumption and Growth Rate (2018-2029) & (Million USD)
- Figure 51. Turkey Broadband Network Gateway (BNG) Consumption and Growth Rate (2018-2029) & (Million USD)
- Figure 52. GCC Countries Broadband Network Gateway (BNG) Consumption and Growth Rate (2018-2029) & (Million USD)
- Figure 53. Broadband Network Gateway (BNG) Product Picture Examples of Cisco Systems
- Figure 54. Broadband Network Gateway (BNG) Product Picture Examples of Juniper Networks
- Figure 55. Nokia Multi-access Broadband Network Gateway
- Figure 56. Broadband Network Gateway (BNG) Product Picture Examples of Huawei Technologies
- Figure 57. Broadband Network Gateway (BNG) Product Picture Examples of NetElastic
- Figure 58. Broadband Network Gateway (BNG) MPC480 Product Picture Examples of Waystream AB
- Figure 59. Broadband Network Gateway (BNG) Product Picture Examples of Sanctum Networks
- Figure 60. Broadband Network Gateway (BNG) Product Picture Examples of RtBrick
- Figure 61. Bottom-up and Top-down Approaches for This Report
- Figure 62. Data Triangulation
- Figure 63. Key Executives Interviewed
This report focuses on global and United States Broadband Network Gateway (BNG) market, also covers the segmentation data of other regions in regional level and county level.
The global Broadband Network Gateway (BNG) revenue was US$ 938.58 million in 2022 and is forecast to a readjusted size of US$ 2,107.46 million by 2029 with a CAGR of 13.16% during the review period (2023-2029).
In United States the Broadband Network Gateway (BNG) revenue is expected to grow from US$ 261.96 million in 2022 to US$ 570.69 million by 2029, at a CAGR of 12.65% during the forecast period (2023-2029).
The global key players of Broadband Network Gateway (BNG) include: Cisco Systems, Juniper Networks, Nokia, Huawei Technologies, Casa Systems, Ciena, netElastic, Waystream AB, and Sanctum Networks, etc. The global five biggest players hold a share of 72.61% in 2022.
Scope and Market Size:
Broadband Network Gateway (BNG) market is segmented in regional and country level, by players, by Type, and by Application. Players, stakeholders, and other participants in the global Broadband Network Gateway (BNG) market will be able to gain the upper hand as they use the report as a powerful resource. The segmental analysis focuses on revenue and forecast by Type and by Application for the period 2018-2029.
For United States market, this report focuses on the Broadband Network Gateway (BNG) market size by players, by Type, and by Application, for the period 2018-2029. The key players include the global and local players which play important roles in United States.
By Company
- Cisco Systems
- Juniper Networks
- Nokia
- Huawei Technologies
- Casa Systems
- Ciena
- netElastic
- Waystream AB
- Sanctum Networks
- RtBrick
Segment by Type
- Traditional BNG
- vBNG
Segment by Application
- Residential
- Commercial
By Region
- Americas
- United States
- Canada
- Mexico
- Brazil
- Europe
- Germany
- UK
- France
- Russia
- Italy
- Asia-Pacific
- China
- Japan
- South Korea
- India
- Australia
- China Taiwan
- Indonesia
- Thailand
- Malaysia
- Latin America, Middle East & Africa
- Mexico
- Brazil
- Turkey
- GCC Countries
Table of Contents
1 Study Coverage
- 1.1 Broadband Network Gateway (BNG) Product Introduction
- 1.2 Global Broadband Network Gateway (BNG) Outlook, 2018 VS 2022 VS 2029
- 1.2.1 Global Broadband Network Gateway (BNG) Market Size for the Year 2018-2029
- 1.2.2 United States Broadband Network Gateway (BNG) Market Size for the Year 2018-2029
- 1.3 Broadband Network Gateway (BNG) Market Size, United States VS Global, 2018 VS 2022 VS 2029
- 1.3.1 The Market Share of United States Broadband Network Gateway (BNG) in Global, 2018 VS 2022 VS 2029
- 1.3.2 The Growth Rate of Broadband Network Gateway (BNG) Market Size, United States VS Global, 2018 VS 2022 VS 2029
- 1.4 Broadband Network Gateway (BNG) Market Dynamics
- 1.4.1 Broadband Network Gateway (BNG) Industry Trends
- 1.4.2 Broadband Network Gateway (BNG) Market Drivers
- 1.4.3 Broadband Network Gateway (BNG) Market Challenges
- 1.4.4 Porter's Five Forces Analysis
- 1.5 Assumptions and Limitations
- 1.6 Study Objectives
- 1.7 Years Considered
2 Broadband Network Gateway (BNG) by Type
- 2.1 Broadband Network Gateway (BNG) Market by Type
- 2.1.1 Traditional BNG
- 2.1.2 vBNG
- 2.2 Global Broadband Network Gateway (BNG) Market Size by Type (2018, 2022 & 2029)
- 2.3 Global Broadband Network Gateway (BNG) Market Size by Type (2018-2029)
- 2.4 United States Broadband Network Gateway (BNG) Market Size by Type (2018, 2022 & 2029)
- 2.5 United States Broadband Network Gateway (BNG) Market Size by Type (2018-2029)
3 Broadband Network Gateway (BNG) by Application
- 3.1 Broadband Network Gateway (BNG) Market by Application
- 3.2 Global Broadband Network Gateway (BNG) Market Size, by Application (2018, 2022 & 2029)
- 3.3 Global Broadband Network Gateway (BNG) Market Size by Application (2018-2029)
- 3.4 United States Broadband Network Gateway (BNG) Market Size by Application (2018, 2022 & 2029)
- 3.5 United States Broadband Network Gateway (BNG) Market Size by Application (2018-2029)
4 Global Broadband Network Gateway (BNG) Competitor Landscape by Company
- 4.1 Global Broadband Network Gateway (BNG) Market Size by Company
- 4.1.1 Global Key Companies of Broadband Network Gateway (BNG), Ranked by Revenue (2022)
- 4.1.2 Global Broadband Network Gateway (BNG) Revenue by Player (2018-2023)
- 4.2 Global Broadband Network Gateway (BNG) Concentration Ratio (CR)
- 4.2.1 Broadband Network Gateway (BNG) Market Concentration Ratio (CR) (2018-2023)
- 4.2.2 Global Top 5 and Top 10 Largest Companies of Broadband Network Gateway (BNG) in 2022
- 4.2.3 Global Broadband Network Gateway (BNG) Market Share by Company Type (Tier 1, Tier 2, and Tier 3)
- 4.3 Global Key Players of Broadband Network Gateway (BNG) Head office and Area Served
- 4.4 Global Key Players of Broadband Network Gateway (BNG), Product and Application
- 4.5 Global Established Date of Key Broadband Network Gateway (BNG) Players
- 4.6 Companies Mergers & Acquisitions, Expansion Plans
- 4.7 United States Broadband Network Gateway (BNG) Market Size by Company
- 4.7.1 Key Players of Broadband Network Gateway (BNG) in United States, Ranked by Revenue (2022)
- 4.7.2 United States Broadband Network Gateway (BNG) Revenue by Players (2018-2023)
5 Global Broadband Network Gateway (BNG) Market Size by Region
- 5.1 Global Broadband Network Gateway (BNG) Market Size by Region: 2018 VS 2022 VS 2029
- 5.2 Global Broadband Network Gateway (BNG) Market Size by Region (2018-2029)
- 5.2.1 Global Broadband Network Gateway (BNG) Market Size by Region: 2018-2023
- 5.2.2 Global Broadband Network Gateway (BNG) Market Size by Region: 2024-2029
6 Segment in Region Level & Country Level
- 6.1 North America
- 6.1.1 North America Broadband Network Gateway (BNG) Consumption Growth Rate by Country: 2018 VS 2022 VS 2029
- 6.1.2 North America Broadband Network Gateway (BNG) Consumption by Country (2018-2029)
- 6.1.3 U.S.
- 6.1.4 Canada
- 6.2 Europe
- 6.2.1 Europe Broadband Network Gateway (BNG) Consumption Growth Rate by Country: 2018 VS 2022 VS 2029
- 6.2.2 Europe Broadband Network Gateway (BNG) Consumption by Country (2018-2029)
- 6.2.3 Germany
- 6.2.4 France
- 6.2.5 U.K.
- 6.2.6 Italy
- 6.2.7 Russia
- 6.3 Asia Pacific
- 6.3.1 Asia Pacific Broadband Network Gateway (BNG) Consumption Growth Rate by Country: 2018 VS 2022 VS 2029
- 6.3.2 Asia Pacific Broadband Network Gateway (BNG) Consumption by Region (2018-2029)
- 6.3.3 China
- 6.3.4 Japan
- 6.3.5 South Korea
- 6.3.6 China Taiwan
- 6.3.7 India
- 6.3.8 Australia
- 6.3.9 Indonesia
- 6.3.10 Thailand
- 6.3.11 Malaysia
- 6.4 Latin America, Middle East & Africa
- 6.4.1 Latin America, Middle East & Africa Broadband Network Gateway (BNG) Consumption Growth Rate by Country: 2018 VS 2022 VS 2029
- 6.4.2 Latin America, Middle East & Africa Broadband Network Gateway (BNG) Consumption by Country (2018-2029)
- 6.4.3 Mexico
- 6.4.4 Brazil
- 6.4.5 Turkey
- 6.4.6 GCC Countries
7 Key Players Profiles
- 7.1 Cisco Systems
- 7.1.1 Company Basic Information, Manufacturing Base, Sales Area and Its Competitors
- 7.1.2 Broadband Network Gateway (BNG) Product Overview
- 7.1.3 Cisco Systems Broadband Network Gateway (BNG) Revenue (Million USD) and Gross Margin (%) (2018-2023)
- 7.1.4 Main Business/Business Overview
- 7.2 Juniper Networks
- 7.2.1 Company Basic Information, Manufacturing Base, Sales Area and Its Competitors
- 7.2.2 Broadband Network Gateway (BNG) Product Overview
- 7.2.3 Juniper Networks Broadband Network Gateway (BNG) Revenue (Million USD) and Gross Margin (%) (2018-2023)
- 7.2.4 Main Business/Business Overview
- 7.3 Nokia
- 7.3.1 Company Basic Information, Manufacturing Base, Sales Area and Its Competitors
- 7.3.2 Broadband Network Gateway (BNG) Product Overview
- 7.3.3 Nokia Broadband Network Gateway (BNG) Revenue (Million USD) and Gross Margin (%) (2018-2023)
- 7.3.4 Main Business/Business Overview
- 7.4 Huawei Technologies
- 7.4.1 Company Basic Information, Manufacturing Base, Sales Area and Its Competitors
- 7.4.2 Broadband Network Gateway (BNG) Product Overview
- 7.4.3 Huawei Technologies Broadband Network Gateway (BNG) Revenue (Million USD) and Gross Margin (%) (2018-2023)
- 7.4.4 Main Business/Business Overview
- 7.5 Casa Systems
- 7.5.1 Company Basic Information, Manufacturing Base, Sales Area and Its Competitors
- 7.5.2 Broadband Network Gateway (BNG) Product Overview
- 7.5.3 Casa Systems Broadband Network Gateway (BNG) Revenue (Million USD) and Gross Margin (%) (2018-2023)
- 7.5.4 Main Business/Business Overview
- 7.6 Ciena
- 7.6.1 Company Basic Information, Manufacturing Base, Sales Area and Its Competitors
- 7.6.2 Broadband Network Gateway (BNG) Product Overview
- 7.6.3 Ciena Broadband Network Gateway (BNG) Revenue (Million USD) and Gross Margin (%) (2018-2023)
- 7.6.4 Main Business/Business Overview
- 7.7 NetElastic
- 7.7.1 Company Basic Information, Manufacturing Base, Sales Area and Its Competitors
- 7.7.2 Broadband Network Gateway (BNG) Product Overview
- 7.7.3 NetElastic Broadband Network Gateway (BNG) Revenue (Million USD) and Gross Margin (%) (2018-2023)
- 7.7.4 Main Business/Business Overview
- 7.8 Waystream AB
- 7.8.1 Company Basic Information, Manufacturing Base, Sales Area and Its Competitors
- 7.8.2 Broadband Network Gateway (BNG) Product Overview
- 7.8.3 Waystream AB Broadband Network Gateway (BNG) Revenue (Million USD) and Gross Margin (%) (2018-2023)
- 7.8.4 Main Business/Business Overview
- 7.9 Sanctum Networks
- 7.9.1 Company Basic Information, Manufacturing Base, Sales Area and Its Competitors
- 7.9.2 Broadband Network Gateway (BNG) Product Overview
- 7.9.3 Sanctum Networks Broadband Network Gateway (BNG) Revenue (Million USD) and Gross Margin (%) (2018-2023)
- 7.9.4 Main Business/Business Overview
- 7.10 RtBrick
- 7.10.1 Company Basic Information, Manufacturing Base, Sales Area and Its Competitors
- 7.10.2 Broadband Network Gateway (BNG) Product Overview
- 7.10.3 RtBrick Broadband Network Gateway (BNG) Revenue (Million USD) and Gross Margin (%) (2018-2023)
- 7.10.4 Main Business/Business Overview
8 Research Findings and Conclusion
9 Appendix
- 9.1 Research Methodology
- 9.1.1 Methodology/Research Approach
- 9.1.2 Data Source
- 9.2 Author Details
- 9.3 Disclaimer
