|
|
市場調査レポート
商品コード
1654184
ブロードバンドサービスの市場規模、シェア、動向分析:ブロードバンド接続別、最終用途別、地域別、セグメント予測、2025年~2030年Broadband Services Market Size, Share & Trends Analysis By Broadband Connection (Fiber Optic, Wireless, Satellite, Cable, Digital Subscriber Line), By End Use (Business, Household), By Region, and Segment Forecasts, 2025 - 2030 |
||||||

|
|||||||
カスタマイズ可能
|
|||||||


| ブロードバンドサービスの市場規模、シェア、動向分析:ブロードバンド接続別、最終用途別、地域別、セグメント予測、2025年~2030年 |
|
出版日: 2025年01月13日
発行: Grand View Research
ページ情報: 英文 130 Pages
納期: 2~10営業日
|

全表示
- 概要
- 図表
- 目次
ブロードバンドサービス市場の成長と動向
Grand View Research, Inc.の最新レポートによると、世界のブロードバンドサービス市場規模は2030年までに8,750億6,000万米ドルに達すると推定されています。
同市場は2025~2030年にかけてCAGR 9.8%でまともに拡大すると推定されます。ブロードバンドサービスは、幅広い技術を使用してより最新のインターネット アクセスを提供できることから、ブロードバンド サービスに対する需要が急速に高まっており、これが市場の成長の大きな原動力となっています。
同市場は、主に市場の急激な需要に牽引され、予測期間中に力強い成長を記録するものと考えられます。高い需要は、政府の積極的な取り組み、ユーザーの利便性向上のための技術の進歩、消費者の意識、ブロードバンド接続を必要とする携帯電話、タブレット、MID、電子書籍などのデバイスの利用増加によって支えられています。インターネットの高速化とブロードバンドサービスの普及は、特筆すべき成長要因です。
同市場の主要動向には以下のようなものがあります。価格、技術的な決定、ユーザーの嗜好に関する市場データを収集するためのブロードバンド事前登録指標の戦略的利用、ブロードバンドサービスのオンライン登録によるプロセスの透明化とユーザーフレンドリー化、登録書類の電子署名と身元証明の検証による自動契約状態の維持と不正行為の制限、マーケティング、メール、管理、設置、カスタマーサポートのすべてのニーズに対するワンストップ・ショップサービスを提供するためのシステムインテグレーションがますます重視されるようになっています。
COVID-19の流行はブロードバンドサービスに好影響を与え、デジタル消費はここ数週間で急増しています。ほとんどのビジネスにおける在宅勤務の概念、教育形式におけるオンライン授業、会議や個人的な用途におけるビデオ通話の利用率の向上、必需品のオンラインショッピング、娯楽コンテンツの視聴率の向上は、ブロードバンドサービスへの要求を顕著に高めています。製品の宣伝や販売にデジタルチャネルを導入する企業への投資も、近い将来急増すると考えられます。速度だけでなく、付加サービスも顧客にとって重要な魅力であり、それによって市場間の競争企業間の敵対関係も激化しています。
ブロードバンドサービス市場レポートハイライト
- アジア太平洋市場は、ブロードバンドサービスの広範な利用により、2024年に最大の市場シェアを占めました。
- 光ファイバーセグメントは、接続の速さ、大規模な普及、継続的な技術の進化により、市場を独占しています。
- ワイヤレスブロードバンドサービスは、予測期間中に2桁成長の勢いを示すと見られています。
- COVID-19期間中にブロードバンドサービスの採用が増加したことで、市場の成長が顕著に増大し、ビジネスモデルのデジタル革命に拍車がかかった。
目次
第1章 調査手法と範囲
第2章 エグゼクティブサマリー
第3章 ブロードバンドサービス市場の変数、動向、範囲
- 市場系統の展望
- 市場力学
- 市場促進要因分析
- 市場抑制要因分析
- 産業の課題
- ブロードバンドサービス市場分析ツール
- 産業分析-ポーターのファイブフォース分析
- PESTEL分析
- 問題点分析
第4章 ブロードバンドサービス市場:ブロードバンド接続別、接続、推定・動向分析
- セグメントダッシュボード
- ブロードバンドサービス市場:ブロードバンド接続変動分析、2024年と2030年
- 光ファイバー
- 無線
- 衛星
- ケーブル
- デジタル加入者線(DSL)
第5章 ブロードバンドサービス市場:最終用途別、推定・動向分析
- セグメントダッシュボード
- ブロードバンドサービス市場:最終用途変動分析、2024年と2030年
- 仕事
- 家庭
- その他
第6章 ブロードバンドサービス市場:地域別、推定・動向分析
- ブロードバンドサービス市場シェア、地域別、2024年と2030年
- 北米
- 米国
- カナダ
- メキシコ
- 欧州
- 英国
- ドイツ
- フランス
- アジア太平洋
- 中国
- 日本
- インド
- 韓国
- オーストラリア
- ラテンアメリカ
- ブラジル
- 中東・アフリカ
- アラブ首長国連邦
- サウジアラビア
- 南アフリカ
第7章 競合情勢
- 企業分類
- 企業の市場ポジショニング
- 企業ヒートマップ分析
- 企業プロファイル/上場企業
- AT&T
- BCE Inc
- Charter Communications
- Hughes Network Systems, LLC
- Comcast
- CenturyLink
- KT Corp.
- LG Uplus Corp.
- Singtel
- SK broadband CO.LTD.
- T-Mobile USA, Inc.
- Verizon
- Viasat, Inc.
List of Tables
- Table 1 Global Broadband services market size estimates & forecasts 2018 - 2030 (USD Billion)
- Table 2 Global Broadband services market, by region 2018 - 2030 (USD Billion)
- Table 3 Global Broadband services market, by broadband connection 2018 - 2030 (USD Billion)
- Table 4 Global Broadband services market, by end use 2018 - 2030 (USD Billion)
- Table 5 Fiber optic Broadband services market, by region 2018 - 2030 (USD Billion)
- Table 6 Wireless Broadband services market, by region 2018 - 2030 (USD Billion)
- Table 7 Satellite Broadband services market, by region 2018 - 2030 (USD Billion)
- Table 8 Cable Broadband services market, by region 2018 - 2030 (USD Billion)
- Table 9 Digital Subscriber Line (DSL) Broadband services market, by region 2018 - 2030 (USD Billion)
- Table 10 Business Broadband services market, by region 2018 - 2030 (USD Billion)
- Table 11 Household Broadband services market, by region 2018 - 2030 (USD Billion)
- Table 12 Others Broadband services market, by region 2018 - 2030 (USD Billion)
- Table 13 North America Broadband services market, by broadband connection 2018 - 2030 (USD Billion)
- Table 14 North America Broadband services market, by end use 2018 - 2030 (USD Billion)
- Table 15 U.S. Broadband services market, by broadband connection 2018 - 2030 (USD Billion)
- Table 16 U.S. Broadband services market, by end use 2018 - 2030 (USD Billion)
- Table 17 Canada Broadband services market, by broadband connection 2018 - 2030 (USD Billion)
- Table 18 Canada Broadband services market, by end use 2018 - 2030 (USD Billion)
- Table 19 Mexico Broadband services market, by broadband connection 2018 - 2030 (USD Billion)
- Table 20 Mexico Broadband services market, by end use 2018 - 2030 (USD Billion)
- Table 21 Europe Broadband services market, by broadband connection 2018 - 2030 (USD Billion)
- Table 22 Europe Broadband services market, by end use 2018 - 2030 (USD Billion)
- Table 23 UK Broadband services market, by broadband connection 2018 - 2030 (USD Billion)
- Table 24 UK Broadband services market, by end use 2018 - 2030 (USD Billion)
- Table 25 Germany Broadband services market, by broadband connection 2018 - 2030 (USD Billion)
- Table 26 Germany Broadband services market, by end use 2018 - 2030 (USD Billion)
- Table 27 France Broadband services market, by broadband connection 2018 - 2030 (USD Billion)
- Table 28 France Broadband services market, by end use 2018 - 2030 (USD Billion)
- Table 29 Asia Pacific Broadband services market, by broadband connection 2018 - 2030 (USD Billion)
- Table 30 Asia Pacific Broadband services market, by end use 2018 - 2030 (USD Billion)
- Table 31 China Broadband services market, by broadband connection 2018 - 2030 (USD Billion)
- Table 32 China Broadband services market, by end use 2018 - 2030 (USD Billion)
- Table 33 India Broadband services market, by broadband connection 2018 - 2030 (USD Billion)
- Table 34 India Broadband services market, by end use 2018 - 2030 (USD Billion)
- Table 35 Japan Broadband services market, by broadband connection 2018 - 2030 (USD Billion)
- Table 36 Japan Broadband services market, by end use 2018 - 2030 (USD Billion)
- Table 37 South Korea Broadband services market, by broadband connection 2018 - 2030 (USD Billion)
- Table 38 South Korea Broadband services market, by end use 2018 - 2030 (USD Billion)
- Table 39 Australia Broadband services market, by broadband connection 2018 - 2030 (USD Billion)
- Table 40 Australia Broadband services market, by end use 2018 - 2030 (USD Billion)
- Table 41 Latin America Broadband services market, by broadband connection 2018 - 2030 (USD Billion)
- Table 42 Latin America Broadband services market, by end use 2018 - 2030 (USD Billion)
- Table 43 Brazil Broadband services market, by broadband connection 2018 - 2030 (USD Billion)
- Table 44 Brazil Broadband services market, by end use 2018 - 2030 (USD Billion)
- Table 45 MEA Broadband services market, by broadband connection 2018 - 2030 (USD Billion)
- Table 46 MEA Broadband services market, by end use 2018 - 2030 (USD Billion)
- Table 47 UAE Broadband services market, by broadband connection 2018 - 2030 (USD Billion)
- Table 48 UAE Broadband services market, by end use 2018 - 2030 (USD Billion)
- Table 49 KSA Broadband services market, by broadband connection 2018 - 2030 (USD Billion)
- Table 50 KSA Broadband services market, by end use 2018 - 2030 (USD Billion)
- Table 51 South Africa Broadband services market, by broadband connection 2018 - 2030 (USD Billion)
- Table 52 South Africa Broadband services market, by end use 2018 - 2030 (USD Billion)
List of Figures
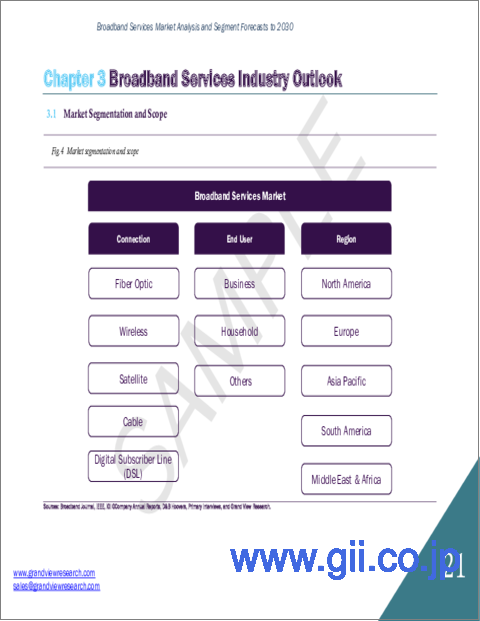
- Fig. 1 Broadband services market segmentation
- Fig. 2 Market research process
- Fig. 3 Information procurement
- Fig. 4 Primary research pattern
- Fig. 5 Market research approaches
- Fig. 6 Value chain-based sizing & forecasting
- Fig. 7 Parent market analysis
- Fig. 8 Market formulation & validation
- Fig. 9 Broadband services market snapshot
- Fig. 10 Broadband services market segment snapshot
- Fig. 11 Broadband services market competitive landscape snapshot
- Fig. 12 Market research process
- Fig. 13 Market driver relevance analysis (Current & future impact)
- Fig. 14 Market restraint relevance analysis (Current & future impact)
- Fig. 15 Broadband services market, broadband connection outlook key takeaways (USD Billion)
- Fig. 16 Broadband services market, broadband connection movement analysis (USD Billion), 2024 & 2030
- Fig. 17 Fiber Optic market revenue estimates and forecasts, 2018 - 2030 (USD Billion)
- Fig. 18 Wireless market revenue estimates and forecasts, 2018 - 2030 (USD Billion)
- Fig. 19 Satellite market revenue estimates and forecasts, 2018 - 2030 (USD Billion)
- Fig. 20 Cable market revenue estimates and forecasts, 2018 - 2030 (USD Billion)
- Fig. 21 Digital Subscriber Line (DSL) market revenue estimates and forecasts, 2018 - 2030 (USD Billion)
- Fig. 22 Broadband services market: End user outlook key takeaways (USD Billion)
- Fig. 23 Broadband services market: End user movement analysis (USD Billion), 2024 & 2030
- Fig. 24 Business market revenue estimates and forecasts, 2018 - 2030 (USD Billion)
- Fig. 25 Household market revenue estimates and forecasts, 2018 - 2030 (USD Billion)
- Fig. 26 Others market revenue estimates and forecasts, 2018 - 2030 (USD Billion)
- Fig. 27 Regional marketplace: Key takeaways
- Fig. 28 Broadband services market: Regional outlook, 2024 & 2030 (USD Billion)
- Fig. 29 North America Broadband services market estimates and forecasts, 2018 - 2030 (USD Billion)
- Fig. 30 U.S. Broadband services market estimates and forecasts, 2018 - 2030 (USD Billion)
- Fig. 31 Canada Broadband services market estimates and forecasts, 2018 - 2030 (USD Billion)
- Fig. 32 Mexico Broadband services market estimates and forecasts, 2018 - 2030 (USD Billion)
- Fig. 33 Europe Broadband services market estimates and forecasts, 2018 - 2030 (USD Billion)
- Fig. 34 UK Broadband services market estimates and forecasts, 2018 - 2030 (USD Billion)
- Fig. 35 Germany Broadband services market estimates and forecasts, 2018 - 2030 (USD Billion)
- Fig. 36 France Broadband services market estimates and forecasts, 2018 - 2030 (USD Billion)
- Fig. 37 Asia Pacific Broadband services market estimates and forecasts, 2018 - 2030 (USD Billion)
- Fig. 38 China Broadband services market estimates and forecasts, 2018 - 2030 (USD Billion)
- Fig. 39 Japan Broadband services market estimates and forecasts, 2018 - 2030 (USD Billion)
- Fig. 40 India Broadband services market estimates and forecasts, 2018 - 2030 (USD Billion)
- Fig. 41 Australia Broadband services market estimates and forecasts, 2018 - 2030 (USD Billion)
- Fig. 42 South Korea Broadband services market estimates and forecasts, 2018 - 2030 (USD Billion)
- Fig. 43 Latin America Broadband services market estimates and forecasts, 2018 - 2030 (USD Billion)
- Fig. 44 Brazil Broadband services market estimates and forecasts, 2018 - 2030 (USD Billion)
- Fig. 45 MEA Broadband services market estimates and forecasts, 2018 - 2030 (USD Billion)
- Fig. 46 KSA Broadband services market estimates and forecasts, 2018 - 2030 (USD Billion)
- Fig. 47 UAE Broadband services market estimates and forecasts, 2018 - 2030 (USD Billion)
- Fig. 48 South Africa Broadband services market estimates and forecasts, 2018 - 2030 (USD Billion)
- Fig. 49 Strategy framework
- Fig. 50 Company Categorization
Broadband Services Market Growth & Trends:
The global broadband services market size is estimated to reach USD 875.06 billion by 2030, according to the new report by Grand View Research, Inc. The market is estimated to expand at a decent CAGR of 9.8% from 2025 to 2030. The rapidly escalating demand for broadband services due to their ability to offer higher date access to the internet using a wide spectrum of technologies is a major propeller of market growth of the market.
The market is positioned to register strong growth over the forecast period, driven primarily by the steep demand in the market. The high demand is supported by proactive government initiatives, technological advancements for improved user convenience, consumer awareness, and increased usage of devices-such as mobile phones, tablets, MIDs, and eBooks-requiring a broadband connection. The internet speed and widespread availability of broadband services are notable growth-contributors.
Some of the key market trends in the market include the following: strategic usage of broadband pre-registration indices to collect market data regarding price, engineering decisions, and user preferences; online registration of broadband services makes the process transparent and user-friendly; electronic signature in registration documents and validation of identity proofs aids in maintaining an automatic contract status and limits malpractice; system integration is increasingly emphasized to offer a one-stop-shop service for all marketing, mails, management, installation, and customer support needs; and finally, B2C models are increasingly focused on impacting crowd mentality to attract a larger customer base.
The COVID-19 pandemic has rendered a positive impact on the broadband services as digital consumption has witnessed a sharp rise over the last few weeks. Work-from-home concepts in most business, online classes in education formats, higher usage of video calls for conferences and personal uses, online shopping of essential items, and higher viewership of entertainment content have notably increased the requirement for broadband services. Investment in companies to adopt digital channels for product promotion and sales is also likely to surge in the near future. Besides speed, add-on services are a key attraction for customers, thereby leveling up the competitive rivalry in the market.
Broadband Services Market Report Highlights:
- Asia Pacific regional market accounted for the largest market share in 2024, owing to the widescale usage of broadband services
- The fiber optics segment dominated the market due to its speedy connection, large-scale adoption, and continuously evolving technology
- Wireless broadband services are positioned to demonstrate double-digit growth momentum over the forecast period
- Increased adoption of broadband services during COVID-19 has prominently augmented market growth and fueled the digital revolution in business models
Table of Contents
Chapter 1. Methodology and Scope
- 1.1. Market Segmentation and Scope
- 1.2. Research Methodology
- 1.2.1. Information Procurement
- 1.3. Information or Data Analysis
- 1.4. Methodology
- 1.5. Research Scope and Assumptions
- 1.6. Market Formulation & Validation
- 1.7. List of Data Sources
Chapter 2. Executive Summary
- 2.1. Market Outlook
- 2.2. Segment Outlook
- 2.3. Competitive Insights
Chapter 3. Broadband Services Market Variables, Trends, & Scope
- 3.1. Market Lineage Outlook
- 3.2. Market Dynamics
- 3.2.1. Market Driver Analysis
- 3.2.2. Market Restraint Analysis
- 3.2.3. Industry Challenge
- 3.3. Broadband Services Market Analysis Tools
- 3.3.1. Industry Analysis - Porter's
- 3.3.1.1. Bargaining power of the suppliers
- 3.3.1.2. Bargaining power of the buyers
- 3.3.1.3. Threats of substitution
- 3.3.1.4. Threats from new entrants
- 3.3.1.5. Competitive rivalry
- 3.3.2. PESTEL Analysis
- 3.3.2.1. Political landscape
- 3.3.2.2. Economic and social landscape
- 3.3.2.3. Technological landscape
- 3.3.1. Industry Analysis - Porter's
- 3.4. Pain Point Analysis
Chapter 4. Broadband Services Market: Broadband Connection Estimates & Trend Analysis
- 4.1. Segment Dashboard
- 4.2. Broadband Services Market: Broadband Connection Movement Analysis, 2024 & 2030 (USD Billion)
- 4.3. Fiber Optic
- 4.3.1. Fiber Optic Market Revenue Estimates and Forecasts, 2018 - 2030 (USD Billion)
- 4.4. Wireless
- 4.4.1. Wireless Market Revenue Estimates and Forecasts, 2018 - 2030 (USD Billion)
- 4.5. Satellite
- 4.5.1. Satellite Market Revenue Estimates and Forecasts, 2018 - 2030 (USD Billion)
- 4.6. Cable
- 4.6.1. Cable Market Revenue Estimates and Forecasts, 2018 - 2030 (USD Billion)
- 4.7. Digital Subscriber Line (DSL)
- 4.7.1. Digital Subscriber Line (DSL) Market Revenue Estimates and Forecasts, 2018 - 2030 (USD Billion)
Chapter 5. Broadband Services Market: End Use Estimates & Trend Analysis
- 5.1. Segment Dashboard
- 5.2. Broadband Services Market: End Use Movement Analysis, 2024 & 2030 (USD Billion)
- 5.3. Business
- 5.3.1. Business Market Revenue Estimates and Forecasts, 2018 - 2030 (USD Billion)
- 5.4. Household
- 5.4.1. Household Market Revenue Estimates and Forecasts, 2018 - 2030 (USD Billion)
- 5.5. Others
- 5.5.1. Others Market Revenue Estimates and Forecasts, 2018 - 2030 (USD Billion)
Chapter 6. Broadband Services Market: Regional Estimates & Trend Analysis
- 6.1. Broadband Services Market Share, By Region, 2024 & 2030 (USD Billion)
- 6.2. North America
- 6.2.1. North America Broadband Services Market Estimates and Forecasts, 2018 - 2030 (USD Billion)
- 6.2.2. U.S.
- 6.2.2.1. U.S. Broadband Services Market Estimates and Forecasts, 2018 - 2030 (USD Billion)
- 6.2.3. Canada
- 6.2.3.1. Canada Broadband Services Market Estimates and Forecasts, 2018 - 2030 (USD Billion)
- 6.2.4. Mexico
- 6.2.4.1. Mexico Broadband Services Market Estimates and Forecasts, 2018 - 2030 (USD Billion)
- 6.3. Europe
- 6.3.1. Europe Broadband Services Market Estimates and Forecasts, 2018 - 2030 (USD Billion)
- 6.3.2. UK
- 6.3.2.1. UK Broadband Services Market Estimates and Forecasts, 2018 - 2030 (USD Billion)
- 6.3.3. Germany
- 6.3.3.1. Germany Broadband Services Market Estimates and Forecasts, 2018 - 2030 (USD Billion)
- 6.3.4. France
- 6.3.4.1. France Broadband Services Market Estimates and Forecasts, 2018 - 2030 (USD Billion)
- 6.4. Asia Pacific
- 6.4.1. Asia Pacific Broadband Services Market Estimates and Forecasts, 2018 - 2030 (USD Billion)
- 6.4.2. China
- 6.4.2.1. China Broadband Services Market Estimates and Forecasts, 2018 - 2030 (USD Billion)
- 6.4.3. Japan
- 6.4.3.1. Japan Broadband Services Market Estimates and Forecasts, 2018 - 2030 (USD Billion)
- 6.4.4. India
- 6.4.4.1. India Broadband Services Market Estimates and Forecasts, 2018 - 2030 (USD Billion)
- 6.4.5. South Korea
- 6.4.5.1. South Korea Broadband Services Market Estimates and Forecasts, 2018 - 2030 (USD Billion)
- 6.4.6. Australia
- 6.4.6.1. Australia Broadband Services Market Estimates and Forecasts, 2018 - 2030 (USD Billion)
- 6.5. Latin America
- 6.5.1. Latin America Broadband Services Market Estimates and Forecasts, 2018 - 2030 (USD Billion)
- 6.5.2. Brazil
- 6.5.2.1. Brazil Broadband Services Market Estimates and Forecasts, 2018 - 2030 (USD Billion)
- 6.6. Middle East and Africa
- 6.6.1. Middle East and Africa Broadband Services Market Estimates and Forecasts, 2018 - 2030 (USD Billion)
- 6.6.2. UAE
- 6.6.2.1. UAE Broadband Services Market Estimates and Forecasts, 2018 - 2030 (USD Billion)
- 6.6.3. KSA
- 6.6.3.1. KSA Broadband Services Market Estimates and Forecasts, 2018 - 2030 (USD Billion)
- 6.6.4. South Africa
- 6.6.4.1. South Africa Broadband Services Market Estimates and Forecasts, 2018 - 2030 (USD Billion)
Chapter 7. Competitive Landscape
- 7.1. Company Categorization
- 7.2. Company Market Positioning
- 7.3. Company Heat Map Analysis
- 7.4. Company Profiles/Listing
- 7.4.1. AT&T
- 7.4.1.1. Participant's Overview
- 7.4.1.2. Financial Performance
- 7.4.1.3. Product Benchmarking
- 7.4.1.4. Strategic Initiatives
- 7.4.2. BCE Inc
- 7.4.2.1. Participant's Overview
- 7.4.2.2. Financial Performance
- 7.4.2.3. Product Benchmarking
- 7.4.2.4. Strategic Initiatives
- 7.4.3. Charter Communications
- 7.4.3.1. Participant's Overview
- 7.4.3.2. Financial Performance
- 7.4.3.3. Product Benchmarking
- 7.4.3.4. Strategic Initiatives
- 7.4.4. Hughes Network Systems, LLC
- 7.4.4.1. Participant's Overview
- 7.4.4.2. Financial Performance
- 7.4.4.3. Product Benchmarking
- 7.4.4.4. Strategic Initiatives
- 7.4.5. Comcast
- 7.4.5.1. Participant's Overview
- 7.4.5.2. Financial Performance
- 7.4.5.3. Product Benchmarking
- 7.4.5.4. Strategic Initiatives
- 7.4.6. CenturyLink
- 7.4.6.1. Participant's Overview
- 7.4.6.2. Financial Performance
- 7.4.6.3. Product Benchmarking
- 7.4.6.4. Strategic Initiatives
- 7.4.7. KT Corp.
- 7.4.7.1. Participant's Overview
- 7.4.7.2. Financial Performance
- 7.4.7.3. Product Benchmarking
- 7.4.7.4. Strategic Initiatives
- 7.4.8. LG Uplus Corp.
- 7.4.8.1. Participant's Overview
- 7.4.8.2. Financial Performance
- 7.4.8.3. Product Benchmarking
- 7.4.8.4. Strategic Initiatives
- 7.4.9. Singtel
- 7.4.9.1. Participant's Overview
- 7.4.9.2. Financial Performance
- 7.4.9.3. Product Benchmarking
- 7.4.9.4. Strategic Initiatives
- 7.4.10. SK broadband CO.LTD.
- 7.4.10.1. Participant's Overview
- 7.4.10.2. Financial Performance
- 7.4.10.3. Product Benchmarking
- 7.4.10.4. Strategic Initiatives
- 7.4.11. T-Mobile USA, Inc.
- 7.4.11.1. Participant's Overview
- 7.4.11.2. Financial Performance
- 7.4.11.3. Product Benchmarking
- 7.4.11.4. Strategic Initiatives
- 7.4.12. Verizon
- 7.4.12.1. Participant's Overview
- 7.4.12.2. Financial Performance
- 7.4.12.3. Product Benchmarking
- 7.4.12.4. Strategic Initiatives
- 7.4.13. Viasat, Inc.
- 7.4.13.1. Participant's Overview
- 7.4.13.2. Financial Performance
- 7.4.13.3. Product Benchmarking
- 7.4.13.4. Strategic Initiatives
- 7.4.1. AT&T

