|
|
市場調査レポート
商品コード
1191392
イベントサービスの世界市場 - 市場シェア、規模、動向、業界分析:コンポーネント別、展開タイプ別、組織規模別、地域別、セグメント予測(2022年~2030年)Event Services Market Share, Size, Trends, Industry Analysis Report, By Component (Software and Service); By Deployment Type; By Organization Size; By Region; Segment Forecast, 2022 - 2030 |
||||||
|
|
|||||||
|
● お客様のご希望に応じて、既存データの加工や未掲載情報(例:国別セグメント)の追加などの対応が可能です。 詳細はお問い合わせください。 |
|||||||


| イベントサービスの世界市場 - 市場シェア、規模、動向、業界分析:コンポーネント別、展開タイプ別、組織規模別、地域別、セグメント予測(2022年~2030年) |
|
出版日: 2022年12月01日
発行: Polaris Market Research
ページ情報: 英文 116 Pages
納期: 即日から翌営業日
|
- 全表示
- 概要
- 図表
- 目次
世界のイベントサービスの市場規模は、2030年までに9,682億米ドルに達すると予測されています。
当レポートでは、世界のイベントサービス市場を調査しており、市場の概要、市場規模や予測、動向、促進要因・抑制要因、コンポーネント別・展開タイプ別・組織規模別・地域別などの分析、さらに企業プロファイルなどを提供しています。
目次
第1章 イントロダクション
- レポートの説明
- 調査の目的
- 市場範囲
- 前提条件
- 利害関係者
第2章 エグゼクティブサマリー
- 市場のハイライト
第3章 調査手法
- 概要
- データマイニング
- 情報源
- 一次情報
- 二次情報
第4章 世界のイベントサービス市場の洞察
- イベントサービス - 業界のスナップショット
- イベントサービス市場力学
- 促進要因と機会
- 抑制要因と課題
- ポーターのファイブフォース分析
- 供給企業の交渉力
- 新規参入者の脅威
- 買い手の交渉力
- 代替品の脅威
- 既存企業間の競争力
- PESTEL分析
- イベントサービス市場の業界動向
- バリューチェーン分析
- COVID-19影響分析
第5章 世界のイベントサービス市場:コンポーネント別
- 主な調査結果
- イントロダクション
- 世界のイベントサービス市場、コンポーネント別(2018年~2030年)
- ソフトウェア
- 世界のイベントサービス市場、ソフトウェア別、地域別(2018年~2030年)
- サービス
- 世界のイベントサービス市場、サービス別、地域別(2018年~2030年)
第6章 世界のイベントサービス市場:展開タイプ別
- 主な調査結果
- イントロダクション
- 世界のイベントサービス市場、展開タイプ別(2018年~2030年)
- オンプレミス
- 世界のイベントサービス市場、オンプレミス別、地域別(2018年~2030年)
- クラウド
- 世界のイベントサービス市場、クラウド別、地域別(2018年~2030年)
第7章 世界のイベントサービス市場:組織規模別
- 主な調査結果
- イントロダクション
- 世界のイベントサービス市場、組織規模別(2018年~2030年)
- 中小企業
- 世界のイベントサービス市場、中小企業別、地域別(2018年~2030年)
- 大企業
- 世界のイベントサービス市場、大企業別、地域別(2018年~2030年)
第8章 世界のイベントサービス市場:地域別
- 主な調査結果
- イントロダクション
- イベントサービス市場の評価、地域別(2018年~2030年)
- イベントサービス市場 - 北米
- 北米:イベントサービス市場、コンポーネント別(2018年~2030年)
- 北米:イベントサービス市場、組織規模別(2018年~2030年)
- 北米:イベントサービス市場、展開タイプ別(2018年~2030年)
- イベントサービス市場 - 米国
- イベントサービス市場 - カナダ
- イベントサービス市場 - 欧州
- 欧州:イベントサービス市場、コンポーネント別(2018年~2030年)
- 欧州:イベントサービス市場、組織規模別(2018年~2030年)
- 欧州:イベントサービス市場、展開タイプ別(2018年~2030年)
- イベントサービス市場 - 英国
- イベントサービス市場 - フランス
- イベントサービス市場 - ドイツ
- イベントサービス市場 - イタリア
- イベントサービス市場 - スペイン
- イベントサービス市場 - オランダ
- イベントサービス市場 - ロシア
- イベントサービス市場 - アジア太平洋
- アジア太平洋:イベントサービス市場、コンポーネント別(2018年~2030年)
- アジア太平洋:イベントサービス市場、組織規模別(2018年~2030年)
- アジア太平洋:イベントサービス市場、展開タイプ別(2018年~2030年)
- イベントサービス市場 - 中国
- イベントサービス市場 - インド
- イベントサービス市場 - マレーシア
- イベントサービス市場 - 日本
- イベントサービス市場 - インドネシア
- イベントサービス市場 - 韓国
- イベントサービス市場 -中東・アフリカ
- 中東・アフリカ:イベントサービス市場、コンポーネント別(2018年~2030年)
- 中東・アフリカ:イベントサービス市場、組織規模別(2018年~2030年)
- 中東・アフリカ:イベントサービス市場、展開タイプ別(2018年~2030年)
- イベントサービス市場 - サウジアラビア
- イベントサービス市場 - アラブ首長国連邦
- イベントサービス市場 - イスラエル
- イベントサービス市場 - 南アフリカ
- イベントサービス市場 - ラテンアメリカ
- ラテンアメリカ:イベントサービス市場、コンポーネント別(2018年~2030年)
- ラテンアメリカ:イベントサービス市場、組織規模別(2018年~2030年)
- ラテンアメリカ:イベントサービス市場、展開タイプ別(2018年~2030年)
- イベントサービス市場 - メキシコ
- イベントサービス市場 - ブラジル
- イベントサービス市場 - アルゼンチン
第9章 競合情勢
- 拡大と買収の分析
- 拡大
- 買収
- パートナーシップ/コラボレーション/協定/公開
第10章 企業プロファイル
- Basset Events
- Access Destination Services
- BCD Group
- ATPI
- FX Group
- Martin Audio
- International Security Agency
- Intelligent Protection International
- Wonderland
- Seven Events
- Clarion Events
- CL Events
- Riviera Events
- Penguins
- Capita PLC
List of Tables
- Table 1 Global Event Services Market, by Component, 2018 - 2030 (USD Billion)
- Table 2 Global Event Services Market, by Deployment Type, 2018 - 2030 (USD Billion)
- Table 3 Global Event Services Market, by Organization Size, 2018 - 2030 (USD Billion)
- Table 4 Event Services Market Assessment, By Geography, 2018 - 2030 (USD Billion)
- Table 5 North America: Event Services Market, by Component, 2018 - 2030 (USD Billion)
- Table 6 North America: Event Services Market, by Deployment Type, 2018 - 2030 (USD Billion)
- Table 7 North America: Event Services Market, by Organization Size, 2018 - 2030 (USD Billion)
- Table 8 U.S.: Event Services Market, by Component, 2018 - 2030 (USD Billion)
- Table 9 U.S.: Event Services Market, by Deployment Type, 2018 - 2030 (USD Billion)
- Table 10 U.S.: Event Services Market, by Organization Size, 2018 - 2030 (USD Billion)
- Table 11 Canada: Event Services Market, by Component, 2018 - 2030 (USD Billion)
- Table 12 Canada: Event Services Market, by Deployment Type, 2018 - 2030 (USD Billion)
- Table 13 Canada: Event Services Market, by Organization Size, 2018 - 2030 (USD Billion)
- Table 14 Europe: Event Services Market, by Component, 2018 - 2030 (USD Billion)
- Table 15 Europe: Event Services Market, by Deployment Type, 2018 - 2030 (USD Billion)
- Table 16 Europe: Event Services Market, by Organization Size, 2018 - 2030 (USD Billion)
- Table 17 UK: Event Services Market, by Component, 2018 - 2030 (USD Billion)
- Table 18 UK: Event Services Market, by Deployment Type, 2018 - 2030 (USD Billion)
- Table 19 UK: Event Services Market, by Organization Size, 2018 - 2030 (USD Billion)
- Table 20 France: Event Services Market, by Component, 2018 - 2030 (USD Billion)
- Table 21 France: Event Services Market, by Deployment Type, 2018 - 2030 (USD Billion)
- Table 22 France: Event Services Market, by Organization Size, 2018 - 2030 (USD Billion)
- Table 23 Germany: Event Services Market, by Component, 2018 - 2030 (USD Billion)
- Table 24 Germany: Event Services Market, by Deployment Type, 2018 - 2030 (USD Billion)
- Table 25 Germany: Event Services Market, by Organization Size, 2018 - 2030 (USD Billion)
- Table 26 Italy: Event Services Market, by Component, 2018 - 2030 (USD Billion)
- Table 27 Italy: Event Services Market, by Deployment Type, 2018 - 2030 (USD Billion)
- Table 28 Italy: Event Services Market, by Organization Size, 2018 - 2030 (USD Billion)
- Table 29 Spain: Event Services Market, by Component, 2018 - 2030 (USD Billion)
- Table 30 Spain: Event Services Market, by Deployment Type, 2018 - 2030 (USD Billion)
- Table 31 Spain: Event Services Market, by Organization Size, 2018 - 2030 (USD Billion)
- Table 32 Netherlands: Event Services Market, by Component, 2018 - 2030 (USD Billion)
- Table 33 Netherlands: Event Services Market, by Deployment Type, 2018 - 2030 (USD Billion)
- Table 34 Netherlands: Event Services Market, by Organization Size, 2018 - 2030 (USD Billion)
- Table 35 Russia: Event Services Market, by Component, 2018 - 2030 (USD Billion)
- Table 36 Russia: Event Services Market, by Deployment Type, 2018 - 2030 (USD Billion)
- Table 37 Russia: Event Services Market, by Organization Size, 2018 - 2030 (USD Billion)
- Table 38 Asia Pacific: Event Services Market, by Component, 2018 - 2030 (USD Billion)
- Table 39 Asia Pacific: Event Services Market, by Deployment Type, 2018 - 2030 (USD Billion)
- Table 40 Asia Pacific: Event Services Market, by Organization Size, 2018 - 2030 (USD Billion)
- Table 41 China: Event Services Market, by Component, 2018 - 2030 (USD Billion)
- Table 42 China: Event Services Market, by Deployment Type, 2018 - 2030 (USD Billion)
- Table 43 China: Event Services Market, by Organization Size, 2018 - 2030 (USD Billion)
- Table 44 India: Event Services Market, by Component, 2018 - 2030 (USD Billion)
- Table 45 India: Event Services Market, by Deployment Type, 2018 - 2030 (USD Billion)
- Table 46 India: Event Services Market, by Organization Size, 2018 - 2030 (USD Billion)
- Table 47 Malaysia: Event Services Market, by Component, 2018 - 2030 (USD Billion)
- Table 48 Malaysia: Event Services Market, by Deployment Type, 2018 - 2030 (USD Billion)
- Table 49 Malaysia: Event Services Market, by Organization Size, 2018 - 2030 (USD Billion)
- Table 50 Japan: Event Services Market, by Component, 2018 - 2030 (USD Billion)
- Table 51 Japan: Event Services Market, by Deployment Type, 2018 - 2030 (USD Billion)
- Table 52 Japan: Event Services Market, by Organization Size, 2018 - 2030 (USD Billion)
- Table 53 Indonesia: Event Services Market, by Component, 2018 - 2030 (USD Billion)
- Table 54 Indonesia: Event Services Market, by Deployment Type, 2018 - 2030 (USD Billion)
- Table 55 Indonesia: Event Services Market, by Organization Size, 2018 - 2030 (USD Billion)
- Table 56 South Korea: Event Services Market, by Component, 2018 - 2030 (USD Billion)
- Table 57 South Korea: Event Services Market, by Deployment Type, 2018 - 2030 (USD Billion)
- Table 58 South Korea: Event Services Market, by Organization Size, 2018 - 2030 (USD Billion)
- Table 59 Middle East & Africa: Event Services Market, by Component, 2018 - 2030 (USD Billion)
- Table 60 Middle East & Africa: Event Services Market, by Deployment Type, 2018 - 2030 (USD Billion)
- Table 61 Middle East & Africa: Event Services Market, by Organization Size, 2018 - 2030 (USD Billion)
- Table 62 Saudi Arabia: Event Services Market, by Component, 2018 - 2030 (USD Billion)
- Table 63 Saudi Arabia: Event Services Market, by Deployment Type, 2018 - 2030 (USD Billion)
- Table 64 Saudi Arabia: Event Services Market, by Organization Size, 2018 - 2030 (USD Billion)
- Table 65 UAE: Event Services Market, by Component, 2018 - 2030 (USD Billion)
- Table 66 UAE: Event Services Market, by Deployment Type, 2018 - 2030 (USD Billion)
- Table 67 UAE: Event Services Market, by Organization Size, 2018 - 2030 (USD Billion)
- Table 68 Israel: Event Services Market, by Component, 2018 - 2030 (USD Billion)
- Table 69 Israel: Event Services Market, by Deployment Type, 2018 - 2030 (USD Billion)
- Table 70 Israel: Event Services Market, by Organization Size, 2018 - 2030 (USD Billion)
- Table 71 South Africa: Event Services Market, by Component, 2018 - 2030 (USD Billion)
- Table 72 South Africa: Event Services Market, by Deployment Type, 2018 - 2030 (USD Billion)
- Table 73 South Africa: Event Services Market, by Organization Size, 2018 - 2030 (USD Billion)
- Table 74 Latin America: Event Services Market, by Component, 2018 - 2030 (USD Billion)
- Table 75 Latin America: Event Services Market, by Deployment Type, 2018 - 2030 (USD Billion)
- Table 76 Latin America: Event Services Market, by Organization Size, 2018 - 2030 (USD Billion)
- Table 77 Mexico: Event Services Market, by Component, 2018 - 2030 (USD Billion)
- Table 78 Mexico: Event Services Market, by Deployment Type, 2018 - 2030 (USD Billion)
- Table 79 Mexico: Event Services Market, by Organization Size, 2018 - 2030 (USD Billion)
- Table 80 Brazil: Event Services Market, by Component, 2018 - 2030 (USD Billion)
- Table 81 Brazil: Event Services Market, by Deployment Type, 2018 - 2030 (USD Billion)
- Table 82 Brazil: Event Services Market, by Organization Size, 2018 - 2030 (USD Billion)
- Table 83 Argentina: Event Services Market, by Component, 2018 - 2030 (USD Billion)
- Table 84 Argentina: Event Services Market, by Deployment Type, 2018 - 2030 (USD Billion)
- Table 85 Argentina: Event Services Market, by Organization Size, 2018 - 2030 (USD Billion)
List of Figures
- Figure 1. Global Event Services Market, 2018 - 2030 (USD Billion)
- Figure 2. Integrated Ecosystem
- Figure 3. Research Methodology: Top-Down & Bottom-Up Approach
- Figure 4. Market by Geography
- Figure 5. Porter's Five Forces
- Figure 6. Market by Deployment Type
- Figure 7. Global Event Services Market, by Deployment Type, 2021 & 2030 (USD Billion)
- Figure 8. Market by Component
- Figure 9. Global Event Services Market, by Component, 2021 & 2030 (USD Billion)
- Figure 10. Market by Organization Size
- Figure 11. Global Event Services Market, by Organization Size, 2021 & 2030 (USD Billion)
- Figure 12. Event Services Market Assessment, By Geography, 2018 - 2030 (USD Billion)
- Figure 13. Strategic Analysis - Event Services Market
The global event services market size is expected to reach USD 968.20 billion by 2030, according to a new study by Polaris Market Research. The report "Event Services Market Share, Size, Trends, Industry Analysis Report, By Component (Software and Solution); By Deployment Type; By Organization Size; By Region; Segment Forecast, 2022 - 2030" gives a detailed insight into the current market dynamics and provides analysis on future market growth.
Rapid growth in the number of events of various types, increasing consumer disposable income, and the high purchasing power of consumers coupled with the rising popularity of virtual events are major factors expected to drive market growth. Development of small and large size corporate and personal events across the globe such as ceremonies, conferences, festivals, formal parties, and weddings, forcing service providers to introduce new and more innovative services and coordinate with technical aspects of the events are further likely to be one of the major driving factors in the forecasted period.
Furthermore, increasing focus on research & development activities by key market companies and their shift towards a few business developing strategies including mergers, acquisitions, and collaborations are estimated to create lucrative growth opportunities over the course of the forecast period. For instance, in December 2021, Cvent merged with Dragonner Growth Opportunities Corporation II. With this merger, Cvent get USD 801 million, which would enable the company to accelerate its product innovation, increase R&D, and expand its market share.
In the last few years, the trend of organizing events or parties on any type of special occasions like weddings, birthdays, conferences, and inaugurations has been on the rise, which has substantially increased the demand for event services and is likely to impact the global market positively over the coming years. Nowadays, event service companies have started coupling with concierge services for the expansion of their market reach and to strengthen their market position.
Event Services Market Report Highlights
Service segment is expected to register the fastest growth rate over the forecast period due to several types of professional services offered by vendors globally which help business in mitigating security gaps and makes them highly strong to ensure the effective implementation of event services
Cloud segment accounted for over significant market revenue share in 2021 and is likely to continue its position during the projected period owing to its capabilities to allow businesses and organizations to run multiple campaigns at the same time from many different locations
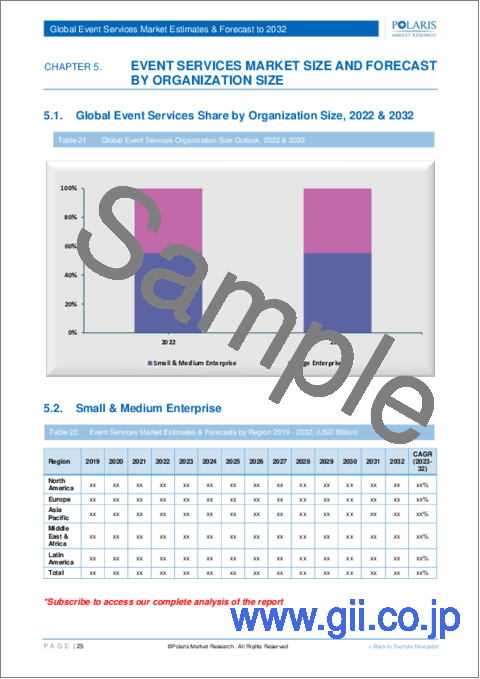
Large enterprises segment held a significant market share in 2021 due to the large corporate network and availability of several revenue streams along with their capabilities to integrate with the latest and innovative technologies and help them to connect with their investors and colleagues
North America dominated the event services market in 2021 with a significant holding of market share on account of the numerous public events organizing including sports, film festivals, product launches, and marathons, and the growing need for efficient event services by consumers in the region
The global players include Access Destination Services, BCD Group, Seven Events, Penguins Ltd., and Clarion Events
Polaris Market Research has segmented the event services market report based on component, deployment type, organization size, and region:
Event Services, Component Outlook (Revenue - USD Billion, 2018 - 2030)
Software
Service
Event Services, Deployment Type Outlook (Revenue - USD Billion, 2018 - 2030)
On-premises
Cloud
Event Services, Organization Size Outlook (Revenue - USD Billion, 2018 - 2030)
Small & Medium Enterprise
Large Enterprise
Event Services, Regional Outlook (Revenue - USD Billion, 2018 - 2030)
North America
U.S
Canada
Europe
Germany
UK
France
Italy
Spain
Russia
Netherlands
Asia Pacific
China
India
Japan
South Korea
Indonesia
Malaysia
Latin America
Argentina
Brazil
Mexico
Middle East & Africa
UAE
Saudi Arabia
Israel
South Africa
Table of Contents
1. Introduction
- 1.1. Report Description
- 1.1.1. Objectives of the Study
- 1.1.2. Market Scope
- 1.1.3. Assumptions
- 1.2. Stakeholders
2. Executive Summary
- 2.1. Market Highlights
3. Research Methodology
- 3.1. Overview
- 3.1.1. Data Mining
- 3.2. Data Sources
- 3.2.1. Primary Sources
- 3.2.2. Secondary Sources
4. Global Event Services Market Insights
- 4.1. Event Services - Industry Snapshot
- 4.2. Event Services Market Dynamics
- 4.2.1. Drivers and Opportunities
- 4.2.1.1. Rising development in online registration processes
- 4.2.1.2. Growing popularity and prevalence of virtual events
- 4.2.2. Restraints and Challenges
- 4.2.2.1. Lack of awareness regarding available advanced event services
- 4.2.1. Drivers and Opportunities
- 4.3. Porter's Five Forces Analysis
- 4.3.1. Bargaining Power of Suppliers (Moderate)
- 4.3.2. Threats of New Entrants: (Low)
- 4.3.3. Bargaining Power of Buyers (Moderate)
- 4.3.4. Threat of Substitute (Moderate)
- 4.3.5. Rivalry among existing firms (High)
- 4.4. PESTEL Analysis
- 4.5. Event Services Market Industry Trends
- 4.6. Value Chain Analysis
- 4.7. COVID-19 Impact Analysis
5. Global Event Services Market, by Component
- 5.1. Key Findings
- 5.2. Introduction
- 5.2.1. Global Event Services Market, by Component, 2018 - 2030 (USD Billion)
- 5.3. Software
- 5.3.1. Global Event Services Market, by Software, by Region, 2018 - 2030 (USD Billion)
- 5.4. Service
- 5.4.1. Global Event Services Market, by Service, by Region, 2018 - 2030 (USD Billion)
6. Global Event Services Market, by Deployment Type
- 6.1. Key Findings
- 6.2. Introduction
- 6.2.1. Global Event Services Market, by Deployment Type, 2018 - 2030 (USD Billion)
- 6.3. On-premises
- 6.3.1. Global Event Services Market, by On-premises, by Region, 2018 - 2030 (USD Billion)
- 6.4. Cloud
- 6.4.1. Global Event Services Market, by Cloud, by Region, 2018 - 2030 (USD Billion)
7. Global Event Services Market, by Organization Size
- 7.1. Key Findings
- 7.2. Introduction
- 7.2.1. Global Event Services Market, by Organization Size, 2018 - 2030 (USD Billion)
- 7.3. Small & Medium Enterprise
- 7.3.1. Global Event Services Market, by Small & Medium Enterprise, by Region, 2018 - 2030 (USD Billion)
- 7.4. Large Enterprise
- 7.4.1. Global Event Services Market, by Large Enterprise, by Region, 2018 - 2030 (USD Billion)
8. Global Event Services Market, by Geography
- 8.1. Key findings
- 8.2. Introduction
- 8.2.1. Event Services Market Assessment, By Geography, 2018 - 2030 (USD Billion)
- 8.3. Event Services Market - North America
- 8.3.1. North America: Event Services Market, by Component, 2018 - 2030 (USD Billion)
- 8.3.2. North America: Event Services Market, by Organization Size, 2018 - 2030 (USD Billion)
- 8.3.3. North America: Event Services Market, by Deployment Type, 2018 - 2030 (USD Billion)
- 8.3.4. Event Services Market - U.S.
- 8.3.4.1. U.S.: Event Services Market, by Component, 2018 - 2030 (USD Billion)
- 8.3.4.2. U.S.: Event Services Market, by Organization Size, 2018 - 2030 (USD Billion)
- 8.3.4.3. U.S.: Event Services Market, by Deployment Type, 2018 - 2030 (USD Billion)
- 8.3.5. Event Services Market - Canada
- 8.3.5.1. Canada: Event Services Market, by Component, 2018 - 2030 (USD Billion)
- 8.3.5.2. Canada.: Event Services Market, by Organization Size, 2018 - 2030 (USD Billion)
- 8.3.5.3. Canada: Event Services Market, by Deployment Type, 2018 - 2030 (USD Billion)
- 8.4. Event Services Market - Europe
- 8.4.1. Europe: Event Services Market, by Component, 2018 - 2030 (USD Billion)
- 8.4.2. Europe.: Event Services Market, by Organization Size, 2018 - 2030 (USD Billion)
- 8.4.3. Europe: Event Services Market, by Deployment Type, 2018 - 2030 (USD Billion)
- 8.4.4. Event Services Market - UK
- 8.4.4.1. UK: Event Services Market, by Component, 2018 - 2030 (USD Billion)
- 8.4.4.2. UK.: Event Services Market, by Organization Size, 2018 - 2030 (USD Billion)
- 8.4.4.3. UK: Event Services Market, by Deployment Type, 2018 - 2030 (USD Billion)
- 8.4.5. Event Services Market - France
- 8.4.5.1. France: Event Services Market, by Component, 2018 - 2030 (USD Billion)
- 8.4.5.2. France.: Event Services Market, by Organization Size, 2018 - 2030 (USD Billion)
- 8.4.5.3. France: Event Services Market, by Deployment Type, 2018 - 2030 (USD Billion)
- 8.4.6. Event Services Market - Germany
- 8.4.6.1. Germany: Event Services Market, by Component, 2018 - 2030 (USD Billion)
- 8.4.6.2. Germany.: Event Services Market, by Organization Size, 2018 - 2030 (USD Billion)
- 8.4.6.3. Germany: Event Services Market, by Deployment Type, 2018 - 2030 (USD Billion)
- 8.4.7. Event Services Market - Italy
- 8.4.7.1. Italy: Event Services Market, by Component, 2018 - 2030 (USD Billion)
- 8.4.7.2. Italy.: Event Services Market, by Organization Size, 2018 - 2030 (USD Billion)
- 8.4.7.3. Italy: Event Services Market, by Deployment Type, 2018 - 2030 (USD Billion)
- 8.4.8. Event Services Market - Spain
- 8.4.8.1. Spain: Event Services Market, by Component, 2018 - 2030 (USD Billion)
- 8.4.8.2. Spain.: Event Services Market, by Organization Size, 2018 - 2030 (USD Billion)
- 8.4.8.3. Spain: Event Services Market, by Deployment Type, 2018 - 2030 (USD Billion)
- 8.4.9. Event Services Market - Netherlands
- 8.4.9.1. Netherlands: Event Services Market, by Component, 2018 - 2030 (USD Billion)
- 8.4.9.2. Netherlands.: Event Services Market, by Organization Size, 2018 - 2030 (USD Billion)
- 8.4.9.3. Netherlands: Event Services Market, by Deployment Type, 2018 - 2030 (USD Billion)
- 8.4.10. Event Services Market - Russia
- 8.4.10.1. Russia: Event Services Market, by Component, 2018 - 2030 (USD Billion)
- 8.4.10.2. Russia.: Event Services Market, by Organization Size, 2018 - 2030 (USD Billion)
- 8.4.10.3. Russia: Event Services Market, by Deployment Type, 2018 - 2030 (USD Billion)
- 8.5. Event Services Market - Asia Pacific
- 8.5.1. Asia Pacific: Event Services Market, by Component, 2018 - 2030 (USD Billion)
- 8.5.2. Asia Pacific.: Event Services Market, by Organization Size, 2018 - 2030 (USD Billion)
- 8.5.3. Asia Pacific: Event Services Market, by Deployment Type, 2018 - 2030 (USD Billion)
- 8.5.4. Event Services Market - China
- 8.5.4.1. China: Event Services Market, by Component, 2018 - 2030 (USD Billion)
- 8.5.4.2. China.: Event Services Market, by Organization Size, 2018 - 2030 (USD Billion)
- 8.5.4.3. China: Event Services Market, by Deployment Type, 2018 - 2030 (USD Billion)
- 8.5.5. Event Services Market - India
- 8.5.5.1. India: Event Services Market, by Component, 2018 - 2030 (USD Billion)
- 8.5.5.2. India.: Event Services Market, by Organization Size, 2018 - 2030 (USD Billion)
- 8.5.5.3. India: Event Services Market, by Deployment Type, 2018 - 2030 (USD Billion)
- 8.5.6. Event Services Market - Malaysia
- 8.5.6.1. Malaysia: Event Services Market, by Component, 2018 - 2030 (USD Billion)
- 8.5.6.2. Malaysia.: Event Services Market, by Organization Size, 2018 - 2030 (USD Billion)
- 8.5.6.3. Malaysia: Event Services Market, by Deployment Type, 2018 - 2030 (USD Billion)
- 8.5.7. Event Services Market - Japan
- 8.5.7.1. Japan: Event Services Market, by Component, 2018 - 2030 (USD Billion)
- 8.5.7.2. Japan.: Event Services Market, by Organization Size, 2018 - 2030 (USD Billion)
- 8.5.7.3. Japan: Event Services Market, by Deployment Type, 2018 - 2030 (USD Billion)
- 8.5.8. Event Services Market - Indonesia
- 8.5.8.1. Indonesia: Event Services Market, by Component, 2018 - 2030 (USD Billion)
- 8.5.8.2. Indonesia.: Event Services Market, by Organization Size, 2018 - 2030 (USD Billion)
- 8.5.8.3. Indonesia: Event Services Market, by Deployment Type, 2018 - 2030 (USD Billion)
- 8.5.9. Event Services Market - South Korea
- 8.5.9.1. South Korea: Event Services Market, by Component, 2018 - 2030 (USD Billion)
- 8.5.9.2. South Korea.: Event Services Market, by Organization Size, 2018 - 2030 (USD Billion)
- 8.5.9.3. South Korea: Event Services Market, by Deployment Type, 2018 - 2030 (USD Billion)
- 8.6. Event Services Market - Middle East & Africa
- 8.6.1. Middle East & Africa: Event Services Market, by Component, 2018 - 2030 (USD Billion)
- 8.6.2. Middle East & Africa.: Event Services Market, by Organization Size, 2018 - 2030 (USD Billion)
- 8.6.3. Middle East & Africa: Event Services Market, by Deployment Type, 2018 - 2030 (USD Billion)
- 8.6.4. Event Services Market - Saudi Arabia
- 8.6.4.1. Saudi Arabia: Event Services Market, by Component, 2018 - 2030 (USD Billion)
- 8.6.4.2. Saudi Arabia.: Event Services Market, by Organization Size, 2018 - 2030 (USD Billion)
- 8.6.4.3. Saudi Arabia: Event Services Market, by Deployment Type, 2018 - 2030 (USD Billion)
- 8.6.5. Event Services Market - UAE
- 8.6.5.1. UAE: Event Services Market, by Component, 2018 - 2030 (USD Billion)
- 8.6.5.2. UAE.: Event Services Market, by Organization Size, 2018 - 2030 (USD Billion)
- 8.6.5.3. UAE: Event Services Market, by Deployment Type, 2018 - 2030 (USD Billion)
- 8.6.6. Event Services Market - Israel
- 8.6.6.1. Israel: Event Services Market, by Component, 2018 - 2030 (USD Billion)
- 8.6.6.2. Israel.: Event Services Market, by Organization Size, 2018 - 2030 (USD Billion)
- 8.6.6.3. Israel: Event Services Market, by Deployment Type, 2018 - 2030 (USD Billion)
- 8.6.7. Event Services Market - South Africa
- 8.6.7.1. South Africa: Event Services Market, by Component, 2018 - 2030 (USD Billion)
- 8.6.7.2. South Africa.: Event Services Market, by Organization Size, 2018 - 2030 (USD Billion)
- 8.6.7.3. South Africa: Event Services Market, by Deployment Type, 2018 - 2030 (USD Billion)
- 8.7. Event Services Market - Latin America
- 8.7.1. Latin America: Event Services Market, by Component, 2018 - 2030 (USD Billion)
- 8.7.2. Latin America.: Event Services Market, by Organization Size, 2018 - 2030 (USD Billion)
- 8.7.3. Latin America: Event Services Market, by Deployment Type, 2018 - 2030 (USD Billion)
- 8.7.4. Event Services Market - Mexico
- 8.7.4.1. Mexico: Event Services Market, by Component, 2018 - 2030 (USD Billion)
- 8.7.4.2. Mexico.: Event Services Market, by Organization Size, 2018 - 2030 (USD Billion)
- 8.7.4.3. Mexico: Event Services Market, by Deployment Type, 2018 - 2030 (USD Billion)
- 8.7.5. Event Services Market - Brazil
- 8.7.5.1. Brazil: Event Services Market, by Component, 2018 - 2030 (USD Billion)
- 8.7.5.2. Brazil.: Event Services Market, by Organization Size, 2018 - 2030 (USD Billion)
- 8.7.5.3. Brazil: Event Services Market, by Deployment Type, 2018 - 2030 (USD Billion)
- 8.7.6. Event Services Market - Argentina
- 8.7.6.1. Argentina: Event Services Market, by Component, 2018 - 2030 (USD Billion)
- 8.7.6.2. Argentina.: Event Services Market, by Organization Size, 2018 - 2030 (USD Billion)
- 8.7.6.3. Argentina: Event Services Market, by Deployment Type, 2018 - 2030 (USD Billion)
9. Competitive Landscape
- 9.1. Expansion and Acquisition Analysis
- 9.1.1. Expansion
- 9.1.2. Acquisitions
- 9.2. Partnerships/Collaborations/Agreements/Exhibitions
10. Company Profiles
- 10.1. Basset Events
- 10.1.1. Company Overview
- 10.1.2. Financial Performance
- 10.1.3. Product Benchmarking
- 10.1.4. Recent Development
- 10.2. Access Destination Services
- 10.2.1. Company Overview
- 10.2.2. Financial Performance
- 10.2.3. Product Benchmarking
- 10.2.4. Recent Development
- 10.3. BCD Group
- 10.3.1. Company Overview
- 10.3.2. Financial Performance
- 10.3.3. Product Benchmarking
- 10.3.4. Recent Development
- 10.4. ATPI
- 10.4.1. Company Overview
- 10.4.2. Financial Performance
- 10.4.3. Product Benchmarking
- 10.4.4. Recent Development
- 10.5. FX Group
- 10.5.1. Company Overview
- 10.5.2. Financial Performance
- 10.5.3. Product Benchmarking
- 10.5.4. Recent Development
- 10.6. Martin Audio
- 10.6.1. Company Overview
- 10.6.2. Financial Performance
- 10.6.3. Product Benchmarking
- 10.6.4. Recent Development
- 10.7. International Security Agency
- 10.7.1. Company Overview
- 10.7.2. Financial Performance
- 10.7.3. Product Benchmarking
- 10.7.4. Recent Development
- 10.8. Intelligent Protection International
- 10.8.1. Company Overview
- 10.8.2. Financial Performance
- 10.8.3. Product Benchmarking
- 10.8.4. Recent Development
- 10.9. Wonderland
- 10.9.1. Company Overview
- 10.9.2. Financial Performance
- 10.9.3. Product Benchmarking
- 10.9.4. Recent Development
- 10.10. Seven Events
- 10.10.1. Company Overview
- 10.10.2. Financial Performance
- 10.10.3. Product Benchmarking
- 10.10.4. Recent Development
- 10.11. Clarion Events
- 10.11.1. Company Overview
- 10.11.2. Financial Performance
- 10.11.3. Product Benchmarking
- 10.11.4. Recent Development
- 10.12. CL Events
- 10.12.1. Company Overview
- 10.12.2. Financial Performance
- 10.12.3. Product Benchmarking
- 10.12.4. Recent Development
- 10.13. Riviera Events
- 10.13.1. Company Overview
- 10.13.2. Financial Performance
- 10.13.3. Product Benchmarking
- 10.13.4. Recent Development
- 10.14. Penguins
- 10.14.1. Company Overview
- 10.14.2. Financial Performance
- 10.14.3. Product Benchmarking
- 10.14.4. Recent Development
- 10.15. Capita PLC
- 10.15.1. Company Overview
- 10.15.2. Financial Performance
- 10.15.3. Product Benchmarking
- 10.15.4. Recent Development