|
|
市場調査レポート
商品コード
1547131
CAR-T細胞療法市場:世界の産業分析、規模、シェア、成長、動向、2024-2033年予測CAR T-Cell Therapy Market: Global Industry Analysis, Size, Share, Growth, Trends, and Forecast, 2024-2033 |
||||||

|
|||||||
カスタマイズ可能
|
|||||||

| CAR-T細胞療法市場:世界の産業分析、規模、シェア、成長、動向、2024-2033年予測 |
|
出版日: 2024年08月29日
発行: Persistence Market Research
ページ情報: 英文 150 Pages
納期: 2~5営業日
|

全表示
- 概要
- 目次
Persistence Market Research社はこのほど、世界のCAR-T細胞療法市場に関する包括的なレポートを発表しました。当レポートでは、市場促進要因・動向・機会・課題を含む重要な市場力学を徹底的に評価し、市場構造に関する詳細な洞察を提供しています。
主な洞察
- CAR-T細胞療法の市場規模(2024E):37億米ドル
- 予測市場規模(2033F):206億米ドル
- 世界市場成長率(CAGR 2024年から2033年まで):21.3%
CAR-T細胞療法市場- レポート範囲:
CAR-T細胞療法は、特定のがん治療における画期的な進歩であり、がん細胞を標的として破壊するように患者のT細胞を改変することにより、個別化免疫療法を提供します。この治療法は、特に白血病やリンパ腫などの血液悪性腫瘍において顕著な効果を示しています。CAR-T細胞療法市場は、がん罹患率の増加、進行中の研究開発活動、精密医療の採用拡大によって牽引されています。この市場は、商業的応用と進行中の臨床試験の両方に対応しており、すでにいくつかのCAR-T細胞療法が規制当局によって承認されています。
市場成長の促進要因:
世界のCAR-T細胞療法市場は、がん罹患率の上昇、より効果的で標的を絞った治療への需要の高まりなど、いくつかの主要な要因によって推進されています。遺伝子工学と細胞療法の継続的な進歩により、安全性と有効性のプロファイルが改善された新しいCAR-T細胞療法の開発が可能となっています。さらに、研究や臨床試験への投資の増加と有利な規制の枠組みが、新規CAR-T細胞療法の承認と商業化を促進し、市場の成長を後押ししています。
市場抑制要因:
CAR-T細胞療法市場は、その可能性にもかかわらず、高額な治療費と複雑な製造工程に関する課題に直面しています。特に中低所得国では、この治療法の高価格が利用しやすさの大きな障壁となる可能性があります。さらに、CAR T細胞の製造には、患者の細胞の抽出、改変、再接種を伴う複雑で時間のかかるプロセスが必要であるため、この治療法の拡張性と普及が制限される可能性があります。サイトカイン放出症候群(CRS)のような重篤な副作用のリスクといった安全性への懸念も、患者の転帰を改善するために対処すべき課題となっています。
市場機会:
CAR-T細胞療法市場は、技術の進歩、血液がん以外の適応拡大、既製治療の可能性を提供する同種CAR-T細胞療法の市場開拓などにより、大きな成長機会をもたらしています。精密医療と個別化治療への注目の高まりは、今後数年間、CAR-T細胞療法の採用を促進すると予想されます。バイオテクノロジー企業と研究機関の戦略的提携、次世代CAR T細胞プラットフォームへの投資、併用療法の探求は、こうした新たな機会を生かすために不可欠です。
本レポートで扱う主な質問
- CAR-T細胞療法市場の世界の成長を促進する主な要因は何か?
- CAR-T細胞療法の採用を牽引しているがんの種類と適応症は何か?
- 技術の進歩はCAR-T細胞療法市場の競合情勢にどのような影響を与えているか?
- CAR-T細胞療法市場に貢献している主要プレイヤーは誰で、市場の関連性を維持するためにどのような戦略を採用しているのか?
- 世界のCAR-T細胞療法市場における新たな動向と将来性は?
目次
第1章 エグゼクティブサマリー
第2章 市場概要
- 市場範囲/分類
- 市場の定義/範囲
第3章 重要成功要因
- 氷山分析
- 収益機会分析
- 親市場分析
- パイプライン評価
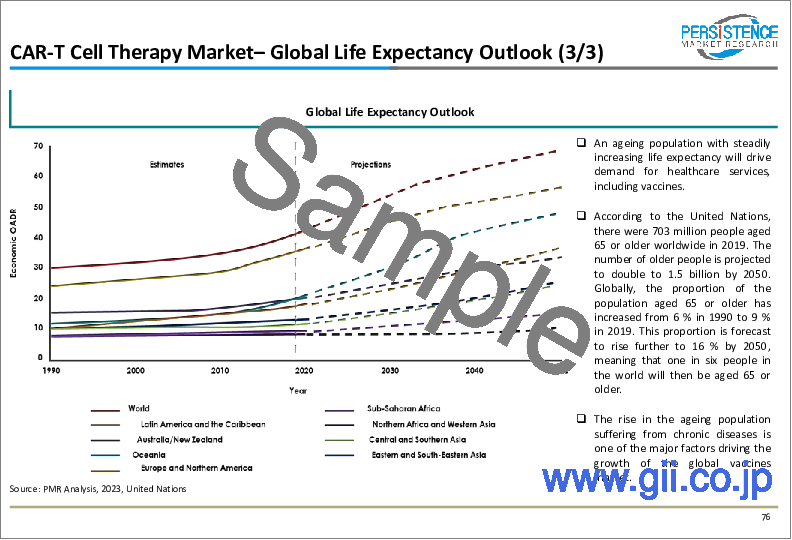
- CAR-T細胞療法の対象となる可能性のある人口(地域別)
- 米国と英国の認定治療センターのリスト
- 主要な包含と除外
第4章 市場背景
- マクロ経済要因
- 予測要因- 関連性と影響
- 市場力学
第5章 COVID-19危機の影響分析
- COVID-19の将来的な影響
- GDP予測と予想される影響
- 2008年と比較した経済予測経済分析
- COVID19と影響分析
- 製品別収益
- 適応症別収益
- エンドユーザー別収益
- 国別収益
第6章 世界のCAR-T細胞療法市場金額分析
- 市場金額分析、2019~2023年
- 市場金額予測、2024~2033年
- 前年比成長動向分析
- 絶対的収益機会
第7章 世界のCAR-T細胞療法市場金額分析、製品別
- イントロダクション/主な調査結果
- 市場金額分析、製品別、2019~2023年
- 市場金額予測、製品別、2024~2033年
- イエスカルタ(アキシカブタゲンシロレウセル)
- キムリア(ティサゲンレクルセル)
- JCAR017(リソカブタゲンマラレウセル)
- bb2121
- 製品別の市場の魅力
第8章 世界のCAR-T細胞療法市場金額分析、適応症別
- イントロダクション/主な調査結果
- 市場金額分析、適応症別、2019~2023年
- 市場金額予測、適応症別、2024~2033年
- 再発性大細胞型B細胞リンパ腫
- 急性リンパ性白血病(ALL)
- 多発性骨髄腫
- 適応症別の市場の魅力
第9章 世界CAR-T細胞療法市場金額分析、エンドユーザー別
- イントロダクション/主な調査結果
- エンドユーザー別市場金額分析、2019~2023年
- エンドユーザー別市場金額予測、2024~2033年
- 病院
- がん治療センター
- エンドユーザー別の市場の魅力
第10章 世界のCAR-T細胞療法市場金額分析、地域別
- イントロダクション/主な調査結果
- 地域別市場金額分析、2019~2023年
- 地域別市場規模分析と予測、2024~2033年
- 北米
- ラテンアメリカ
- 欧州
- 南アジア
- 東アジア
- オセアニア
- 中東・アフリカ
- 地域別の市場の魅力
第11章 北米のCAR-T細胞療法市場分析
第12章 ラテンアメリカのCAR-T細胞療法市場分析
第13章 欧州のCAR-T細胞療法市場分析
第14章 南アジアのCAR-T細胞療法市場分析
第15章 東アジアのCAR-T細胞療法市場分析
第16章 オセアニアのCAR-T細胞療法市場分析
第17章 中東およびアフリカのCAR-T細胞療法市場分析
第18章 主要国および新興国のCAR-T細胞療法市場分析2024-2033
- 米国のCAR-T細胞療法市場分析
- 製品別
- 適応症別
- エンドユーザー別
- カナダのCAR-T細胞療法市場分析
- 製品別
- 適応症別
- エンドユーザー別
- ブラジルのCAR-T細胞療法市場分析
- 製品別
- 適応症別
- エンドユーザー別
- メキシコのCAR-T細胞療法市場分析
- 製品別
- 適応症別
- エンドユーザー別
- アルゼンチンのCAR-T細胞療法市場分析
- 製品別
- 適応症別
- エンドユーザー別
- 英国のCAR-T細胞療法市場分析
- 製品別
- 適応症別
- エンドユーザー別
- ドイツのCAR-T細胞療法市場分析
- 製品別
- 適応症別
- エンドユーザー別
- フランスのCAR-T細胞療法市場分析
- 製品別
- 適応症別
- エンドユーザー別
- イタリアのCAR-T細胞療法市場分析
- 製品別
- 適応症別
- エンドユーザー別
- スペインのCAR-T細胞療法市場分析
- 製品別
- 適応症別
- エンドユーザー別
- ロシアのCAR-T細胞療法市場分析
- 製品別
- 適応症別
- エンドユーザー別
- ベネルクスのCAR-T細胞療法市場分析
- 製品別
- 適応症別
- エンドユーザー別
- インドのCAR-T細胞療法市場分析
- 製品別
- 適応症別
- エンドユーザー別
- ASEANCAR-T細胞療法市場分析
- 製品別
- 適応症別
- エンドユーザー別
- 中国のCAR-T細胞療法市場分析
- 製品別
- 適応症別
- エンドユーザー別
- 日本のCAR-T細胞療法市場分析
- 製品別
- 適応症別
- エンドユーザー別
- 韓国のCAR-T細胞療法市場分析
- 製品別
- 適応症別
- エンドユーザー別
- オーストラリアのCAR-T細胞療法市場分析
- 製品別
- 適応症別
- エンドユーザー別
- ニュージーランドのCAR-T細胞療法市場分析
- 製品別
- 適応症別
- エンドユーザー別
- GCC諸国のCAR-T細胞療法市場分析
- 製品別
- 適応症別
- エンドユーザー別
- トルコのCAR-T細胞療法市場分析
- 製品別
- 適応症別
- エンドユーザー別
- 南アフリカのCAR-T細胞療法市場分析
- 製品別
- 適応症別
- エンドユーザー別
第19章 市場構造分析
- 企業階層別市場分析
- 主要プレーヤーによる市場シェア分析
第20章 競合分析
- 競合ダッシュボード
- 競合の詳細
- Novartis AG
- Gilead Sciences Inc.
- Celgene Corporation
- bluebird bio, Inc.
第21章 前提条件と頭字語
第22章 調査手法
Persistence Market Research has recently released a comprehensive report on the worldwide CAR T-Cell Therapy Market. The report offers a thorough assessment of crucial market dynamics, including drivers, trends, opportunities, and challenges, providing detailed insights into the market structure.
Key Insights:
- CAR T-Cell Therapy Market Size (2024E): USD 3.7 Bn
- Projected Market Value (2033F): USD 20.6 Bn
- Global Market Growth Rate (CAGR 2024 to 2033): 21.3%
CAR T-Cell Therapy Market - Report Scope:
CAR T-cell therapy represents a groundbreaking advancement in the treatment of certain cancers, offering personalized immunotherapy by modifying a patient's T-cells to target and destroy cancer cells. This therapy has shown remarkable efficacy, particularly in hematologic malignancies such as leukemia and lymphoma. The market for CAR T-cell therapy is driven by increasing incidences of cancer, ongoing research and development activities, and the growing adoption of precision medicine. This market caters to both commercial applications and ongoing clinical trials, with several CAR T-cell therapies already approved by regulatory bodies.
Market Growth Drivers:
The global CAR T-cell therapy market is propelled by several key factors, including the rising prevalence of cancer, which has increased the demand for more effective and targeted therapies. Continuous advancements in genetic engineering and cellular therapies are enabling the development of new CAR T-cell therapies with improved safety and efficacy profiles. Additionally, growing investments in research and clinical trials, coupled with favorable regulatory frameworks, are facilitating the approval and commercialization of novel CAR T-cell therapies, thereby boosting market growth.
Market Restraints:
Despite its potential, the CAR T-cell therapy market faces challenges related to high treatment costs and complex manufacturing processes. The therapy's high price point can be a significant barrier to accessibility, particularly in low- and middle-income countries. Furthermore, the intricate and time-consuming process of manufacturing CAR T-cells, which involves extracting, modifying, and reinfusing the patient's cells, can limit the scalability and widespread adoption of this therapy. Safety concerns, such as the risk of severe side effects like cytokine release syndrome (CRS), also pose challenges that need to be addressed to enhance patient outcomes.
Market Opportunities:
The CAR T-cell therapy market presents significant growth opportunities driven by advancements in technology, the expansion of indications beyond hematologic cancers, and the development of allogeneic CAR T-cell therapies, which offer the potential for off-the-shelf treatments. The increasing focus on precision medicine and personalized treatments is expected to drive the adoption of CAR T-cell therapies in the coming years. Strategic partnerships between biotech companies and research institutions, investment in next-generation CAR T-cell platforms, and the exploration of combination therapies are essential to capitalize on these emerging opportunities.
Key Questions Answered in the Report:
- What are the primary factors driving the growth of the CAR T-cell therapy market globally?
- Which cancer types and indications are leading the adoption of CAR T-cell therapy?
- How are technological advancements influencing the competitive landscape of the CAR T-cell therapy market?
- Who are the key players contributing to the CAR T-cell therapy market, and what strategies are they employing to maintain market relevance?
- What are the emerging trends and future prospects in the global CAR T-cell therapy market?
Competitive Intelligence and Business Strategy:
Leading players in the global CAR T-cell therapy market, including Gilead Sciences, Novartis AG, and Bristol-Myers Squibb, focus on innovation, clinical trial expansions, and strategic collaborations to gain a competitive edge. These companies invest heavily in R&D to develop next-generation CAR T-cell therapies with enhanced safety profiles and broader therapeutic applications. Collaborations with academic institutions, biopharma companies, and regulatory agencies are crucial in facilitating clinical development and market access. Emphasis on addressing manufacturing challenges, expanding treatment indications, and improving patient outcomes is driving market growth and reinforcing the position of key players in the evolving CAR T-cell therapy landscape.
Key Companies Profiled:
- Novartis AG
- Gilead Sciences Inc.
- Celgene Corporation
- bluebird bio, Inc.
Car T-Cell Therapy Industry Research by Category
Product
- Yescarta (axicabtagene ciloleucel)
- Kymriah (tisagenlecleucel)
- JCAR017 (lisocabtagene maraleucel)
- bb2121
Indication
- Relapsed Large B-cell Lymphoma
- Acute Lymphoblastic Leukemia (ALL)
- Multiple Myeloma
End User
- Car T-Cell Therapy at Hospitals
- Car T-Cell Therapy at Cancer Treatment Centers
Table of Contents
1. Executive Summary
- 1.1. Global Market Outlook
- 1.2. Demand Side Trends
- 1.3. Supply Side Trends
- 1.4. Analysis and Recommendations
2. Market Overview
- 2.1. Market Coverage/Taxonomy
- 2.2. Market Definition/Scope
3. Key Success Factors
- 3.1. Iceberg Analysis
- 3.2. Revenue Opportunity Analysis
- 3.3. Parent Market Analysis
- 3.4. Pipeline Assessment
- 3.5. Potential Population Eligible for CAR T-cell Therapy, By Region
- 3.6. List of Authorized Treatment Centers in the U.S. & U.K.
- 3.7. Key Inclusion & Exclusion
4. Market Background
- 4.1. Macro-Economic Factors
- 4.1.1. Global GDP Outlook
- 4.1.2. Global Healthcare Expenditure Outlook
- 4.2. Forecast Factors - Relevance & Impact
- 4.2.1. Increasing Availability of CAR T-cell Therapy
- 4.2.2. Increasing Adoption of CAR T-cell Therapy
- 4.2.3. Superior Product Efficacy
- 4.2.4. Improving Reimbursement Scenario
- 4.2.5. Collaboration among Pharmaceutical and Biopharmaceutical Companies
- 4.3. Market Dynamics
- 4.3.1. Drivers
- 4.3.2. Restraints
- 4.3.3. Opportunities
5. COVID-19 Crisis Impact Analysis
- 5.1. Current COVID-19 Probable Future Impact
- 5.2. Current GDP Projection and Probable Impact
- 5.3. Current Economic Projection as compared to 2008 Economic analysis
- 5.4. COVID19 and Impact Analysis
- 5.4.1. Revenue By Product
- 5.4.2. Revenue By Indication
- 5.4.3. Revenue By End User
- 5.4.4. Revenue By Country
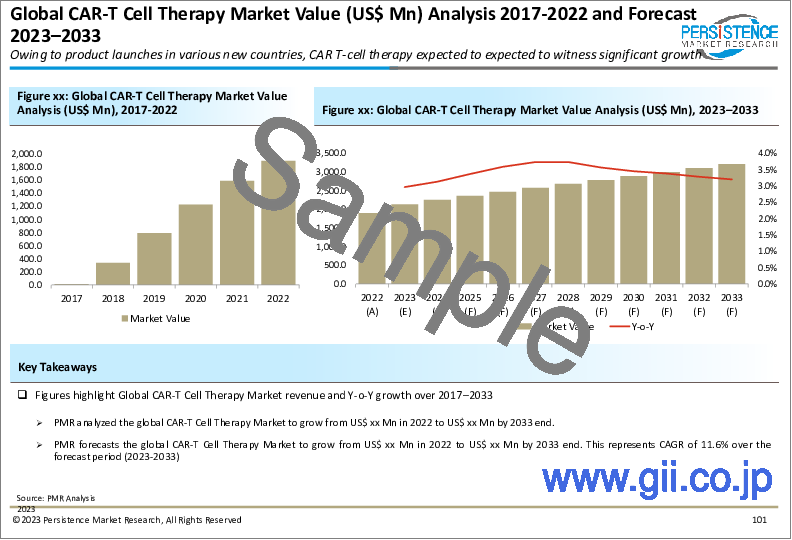
6. Global Car T cell Therapy Market Value (Size US$Mn) Analysis 2019-2023 and Forecast 2024-2033,
- 6.1. Historical Market Value (US$Mn) Analysis, 2019-2023
- 6.2. Current and Future Market Value (US$Mn) Projections, 2024-2033
- 6.2.1. Y-o-Y Growth Trend Analysis
- 6.2.2. Absolute $ Opportunity Analysis
7. Global Car T cell Therapy Market Value (Size US$Mn) Analysis 2019-2023 and Forecast 2024-2033,By Product
- 7.1. Introduction/Key Findings
- 7.2. Historical Market Value (US$Mn) Analysis, By Product, 2019-2023
- 7.3. Current and Future Market Value (US$Mn) Projections, By Product, 2024-2033
- 7.3.1. Yescarta (axicabtagene ciloleucel)
- 7.3.2. Kymriah (tisagenlecleucel)
- 7.3.3. JCAR017 (lisocabtagene maraleucel)
- 7.3.4. bb2121
- 7.4. Market Attractiveness By Product
8. Global Car T cell Therapy Market Value (Size US$Mn) Analysis 2019-2023 and Forecast 2024-2033,By Indication
- 8.1. Introduction/Key Findings
- 8.2. Historical Market Value (US$Mn) Analysis, By Indication, 2019-2023
- 8.3. Current and Future Market Value (US$Mn) Projections, By Indication, 2024-2033
- 8.3.1. Relapsed Large B-cell Lymphoma
- 8.3.2. Acute Lymphoblastic Leukemia (ALL)
- 8.3.3. Multiple Myeloma
- 8.4. Market Attractiveness By Indication
9. Global Car T cell Therapy Market Value (Size US$Mn) Analysis 2019-2023 and Forecast 2024-2033,By End User
- 9.1. Introduction/Key Findings
- 9.2. Historical Market Value (US$Mn) Analysis, By End User, 2019-2023
- 9.3. Current and Future Market Value (US$Mn) Projections, By End User, 2024-2033
- 9.3.1. Hospitals
- 9.3.2. Cancer Treatment Centers
- 9.4. Market Attractiveness By End User
10. Global Car T cell Therapy Market Value (Size US$Mn) Analysis 2019-2023 and Forecast 2024-2033,By Region
- 10.1. Introduction/Key Findings
- 10.2. Historical Market Value (US$Mn) Analysis, By Region, 2019-2023
- 10.3. Current Market Size (US$Mn) Analysis and Forecast By Region, 2024-2033
- 10.3.1. North America
- 10.3.2. Latin America
- 10.3.3. Europe
- 10.3.4. South Asia
- 10.3.5. East Asia
- 10.3.6. Oceania
- 10.3.7. Middle East & Africa
- 10.4. Market Attractiveness By Region
11. North America Car T cell Therapy Market Analysis 2019-2023 and Forecast 2024-2033
- 11.1. Introduction
- 11.2. Historical Market Size (US$Mn) Trend Analysis, By Market Taxonomy, 2019-2023
- 11.3. Current Market Size (US$Mn) Forecast By Market Taxonomy,2024-2033
- 11.3.1. By Country
- 11.3.1.1. U.S.
- 11.3.1.2. Canada
- 11.3.2. By Product
- 11.3.3. By Indication
- 11.3.4. By End User
- 11.3.1. By Country
- 11.4 Market Attractiveness Analysis
12. Latin America Car T cell Therapy Market Analysis 2019-2023 and Forecast 2024-2033
- 12.1. Introduction
- 12.2. Historical Market Size (US$Mn) Trend Analysis, By Market Taxonomy, 2019-2023
- 12.3. Current Market Size (US$Mn) Forecast By Market Taxonomy,2024-2033
- 12.3.1. By Country
- 12.3.1.1. Brazil
- 12.3.1.2. Mexico
- 12.3.1.3. Argentina
- 12.3.1.4. Rest of Latin America
- 12.3.2. By Product
- 12.3.3. By Indication
- 12.3.4. By End User
- 12.3.1. By Country
- 12.4. Market Attractiveness Analysis
13. Europe Car T cell Therapy Market Analysis 2019-2023 and Forecast 2024-2033
- 13.1. Introduction
- 13.2. Historical Market Size (US$Mn) Trend Analysis, By Market Taxonomy, 2019-2023
- 13.3. Current Market Size (US$Mn) Forecast By Market Taxonomy,2024-2033
- 13.3.1. By Country
- 13.3.1.1. U.K.
- 13.3.1.2. Germany
- 13.3.1.3. France
- 13.3.1.4. Italy
- 13.3.1.5. Spain
- 13.3.1.6. Russia
- 13.3.1.7. BENELUX
- 13.3.1.8. Rest of Europe
- 13.3.2. By Product
- 13.3.3. By Indication
- 13.3.4. By End User
- 13.3.1. By Country
- 13.4. Market Attractiveness Analysis
14. South Asia Car T cell Therapy Market Analysis 2019-2023 and Forecast 2024-2033
- 14.1. Introduction
- 14.2. Historical Market Size (US$Mn) Trend Analysis, By Market Taxonomy, 2019-2023
- 14.3. Current Market Size (US$Mn) Forecast By Market Taxonomy,2024-2033
- 14.3.1. By Country
- 14.3.1.1. India
- 14.3.1.2. Thailand
- 14.3.1.3. Indonesia
- 14.3.1.4. Malaysia
- 14.3.1.5. Rest of South Asia
- 14.3.2. By Product
- 14.3.3. By Indication
- 14.3.4. By End User
- 14.3.1. By Country
- 14.4. Market Attractiveness Analysis
15. East Asia Car T cell Therapy Market Analysis 2019-2023 and Forecast 2024-2033
- 15.1. Introduction
- 15.2. Historical Market Size (US$Mn) Trend Analysis, By Market Taxonomy, 2019-2023
- 15.3. Current Market Size (US$Mn) Forecast By Market Taxonomy,2024-2033
- 15.3.1. By Country
- 15.3.1.1. China
- 15.3.1.2. Japan
- 15.3.1.3. South Korea
- 15.3.2. By Product
- 15.3.3. By Indication
- 15.3.4. By End User
- 15.3.1. By Country
- 15.4. Market Attractiveness Analysis
16. Oceania Car T cell Therapy Market Analysis 2019-2023 and Forecast 2024-2033
- 16.1. Introduction
- 16.2. Historical Market Size (US$Mn) Trend Analysis, By Market Taxonomy, 2019-2023
- 16.3. Current Market Size (US$Mn) Forecast By Market Taxonomy,2024-2033
- 16.3.1. By Country
- 16.3.1.1. Australia
- 16.3.1.2. New Zealand
- 16.3.2. By Product
- 16.3.3. By Indication
- 16.3.4. By End User
- 16.3.1. By Country
- 16.4. Market Attractiveness Analysis
17. Middle East & Africa Car T cell Therapy Market Analysis 2019-2023 and Forecast 2024-2033
- 17.1. Introduction
- 17.2. Historical Market Size (US$Mn) Trend Analysis, By Market Taxonomy, 2019-2023
- 17.3. Current Market Size (US$Mn) Forecast By Market Taxonomy,2024-2033
- 17.3.1. By Country
- 17.3.1.1. Turkey
- 17.3.1.2. South Africa
- 17.3.1.3. GCC Countries
- 17.3.1.4. Rest of Middle East & Africa
- 17.3.2. By Product
- 17.3.3. By Indication
- 17.3.4. By End User
- 17.3.1. By Country
- 17.4. Market Attractiveness Analysis
18. Key and Emerging Countries Car T cell Therapy Market Analysis 2024-2033
- 18.1. U.S. Car T cell Therapy Market Analysis
- 18.1.1. By Product
- 18.1.2. By Indication
- 18.1.3. By End User
- 18.2. Canada Car T cell Therapy Market Analysis
- 18.2.1. By Product
- 18.2.2. By Indication
- 18.2.3. By End User
- 18.3. Brazil Car T cell Therapy Market Analysis
- 18.3.1. By Product
- 18.3.2. By Indication
- 18.3.3. By End User
- 18.4. Mexico Car T cell Therapy Market Analysis
- 18.4.1. By Product
- 18.4.2. By Indication
- 18.4.3. By End User
- 18.5. Argentina Car T cell Therapy Market Analysis
- 18.5.1. By Product
- 18.5.2. By Indication
- 18.5.3. By End User
- 18.6. U.K. Car T cell Therapy Market Analysis
- 18.6.1. By Product
- 18.6.2. By Indication
- 18.6.3. By End User
- 18.7. Germany Car T cell Therapy Market Analysis
- 18.7.1. By Product
- 18.7.2. By Indication
- 18.7.3. By End User
- 18.8. France Car T cell Therapy Market Analysis
- 18.8.1. By Product
- 18.8.2. By Indication
- 18.8.3. By End User
- 18.9. Italy Car T cell Therapy Market Analysis
- 18.9.1. By Product
- 18.9.2. By Indication
- 18.9.3. By End User
- 18.10. Spain Car T cell Therapy Market Analysis
- 18.10.1. By Product
- 18.10.2. By Indication
- 18.10.3. By End User
- 18.11. Russia Car T cell Therapy Market Analysis
- 18.11.1. By Product
- 18.11.2. By Indication
- 18.11.3. By End User
- 18.12. BENELUX Car T cell Therapy Market Analysis
- 18.12.1. By Product
- 18.12.2. By Indication
- 18.12.3. By End User
- 18.13. India Car T cell Therapy Market Analysis
- 18.13.1. By Product
- 18.13.2. By Indication
- 18.13.3. By End User
- 18.14. ASEAN Car T cell Therapy Market Analysis
- 18.14.1. By Product
- 18.14.2. By Indication
- 18.14.3. By End User
- 18.15. China Car T cell Therapy Market Analysis
- 18.15.1. By Product
- 18.15.2. By Indication
- 18.15.3. By End User
- 18.16. Japan Car T cell Therapy Market Analysis
- 18.16.1. By Product
- 18.16.2. By Indication
- 18.16.3. By End User
- 18.17. South Korea Car T cell Therapy Market Analysis
- 18.17.1. By Product
- 18.17.2. By Indication
- 18.17.3. By End User
- 18.18. Australia Car T cell Therapy Market Analysis
- 18.18.1. By Product
- 18.18.2. By Indication
- 18.18.3. By End User
- 18.19. New Zealand Car T cell Therapy Market Analysis
- 18.19.1. By Product
- 18.19.2. By Indication
- 18.19.3. By End User
- 18.20. GCC Countries Car T cell Therapy Market Analysis
- 18.20.1. By Product
- 18.20.2. By Indication
- 18.20.3. By End User
- 18.21. Turkey Car T cell Therapy Market Analysis
- 18.21.1. By Product
- 18.21.2. By Indication
- 18.21.3. By End User
- 18.22. South Africa Car T cell Therapy Market Analysis
- 18.22.1. By Product
- 18.22.2. By Indication
- 18.22.3. By End Users
19. Market Structure Analysis
- 19.1. Market Analysis By Tier of Companies
- 19.2. Market Share Analysis By Key Players
- 19.2.1. Regional footprint of Players
- 19.2.2. Service Footprint by players
- 19.2.3. Channel Foot Print by Players
20. Competition Analysis
- 20.1. Competition Dashboard
- 20.2. Competition Deep Dive
- 20.2.1. Novartis AG
- 20.2.1.1. Overview
- 20.2.1.2. Product Portfolio
- 20.2.1.3. Profitability by Market Segments (Product /End User/Region)
- 20.2.1.4. Sales Footprint
- 20.2.1.5. Strategy Overview
- 20.2.1.5.1. Marketing Strategy
- 20.2.1.5.2. Service Strategy
- 20.2.1.5.3. End User Strategy
- 20.2.2. Gilead Sciences Inc.
- 20.2.2.1. Overview
- 20.2.2.2. Product Portfolio
- 20.2.2.3. Profitability by Market Segments (Product /End User/Region)
- 20.2.2.4. Sales Footprint
- 20.2.2.5. Strategy Overview
- 20.2.2.5.1. Marketing Strategy
- 20.2.2.5.2. Service Strategy
- 20.2.2.5.3. End User Strategy
- 20.2.3. Celgene Corporation
- 20.2.3.1. Overview
- 20.2.3.2. Product Portfolio
- 20.2.3.3. Profitability by Market Segments (Product /End User/Region)
- 20.2.3.4. Sales Footprint
- 20.2.3.5. Strategy Overview
- 20.2.3.5.1. Marketing Strategy
- 20.2.3.5.2. Service Strategy
- 20.2.3.5.3. End User Strategy
- 20.2.4. bluebird bio, Inc.
- 20.2.4.1. Overview
- 20.2.4.2. Product Portfolio
- 20.2.4.3. Profitability by Market Segments (Product /End User/Region)
- 20.2.4.4. Sales Footprint
- 20.2.4.5. Strategy Overview
- 20.2.4.5.1. Marketing Strategy
- 20.2.4.5.2. Service Strategy
- 20.2.4.5.3. End User Strategy
- 20.2.1. Novartis AG

